Q1 - 2020 Investor Presentation
←
→
Page content transcription
If your browser does not render page correctly, please read the page content below

Q1 – 2020 Investor Presentation
Forward–Looking Statements
This presentation contains "forward-looking information" as defined under Canadian securities laws (collectively, “forward-looking statements”) which reflect management’s expectations regarding objectives, plans, goals, strategies, future
growth, results of operations, performance, business prospects and opportunities of the REIT. The words “plans”, “expects”, “scheduled”, “estimates”, “intends”, “anticipates”, “projects”, “believes”, or variations of such words and phrases
(including negative variations) or statements to the effect that certain actions, events or results “may”, “will”, “could”, “would”, “might”, “be achieved”, or “continue” and similar expressions identify forward-looking statements. Some of the
specific forward-looking statements in this presentation include, but are not limited to statements regarding the objectives and strategic focus of the REIT; future distributions by the REIT; predictability and certainty of cash flow; investment
opportunities in the U.S. industrial real estate market; U.S. vacancy rate trends; tenant demand in the distribution sub-segment; including demand for state-of-the-art distribution and logistics space; development in distribution markets; vacancy
rates in the state-of-the-art distribution market and absorption of vacancy in distribution investment properties in major distribution markets in the U.S. over the past years; re-tenanting costs; key trends and continued and increased demand
within the industrial real estate market; the effect of the experience of the asset and property manager of the REIT; in the U.S. industrial real estate market on tenant retention and future acquisitions by the REIT; the expected accretion to the
REIT’s funds from operations (“FFO”) per Unit and adjusted funds from operations (“AFFO”) per Unit from completed acquisitions; the sources of organic growth; including initiatives aimed at optimizing the performance; value and long-term
cash flow of the REIT’s investment property portfolio; the REIT’s external growth strategy; including diversification; the REIT’s cost of capital; borrowing costs and opportunities to increase the cash flow and value of the existing portfolio of
investment properties through initiatives designed to enhance operations; future maintenance expenditures; future project costs related to the development of investment properties; the attractiveness of newer investment properties to prospective
tenants; the quality and future valuations of the REIT’s portfolio of investment properties; lease terms; termination and future maintenance and leasing expenditures; the REIT’s ability to meet all of its ongoing obligations with current cash
generated from operations; draws on its Credit Facility and new equity and debt issuances; the fair values of the REIT’s investment properties; the REIT’s debt strategy, including the REIT’s intention to maintain staggered mortgages payable
maturities; and anticipated and potential adverse impacts resulting from the coronavirus disease (COVID-19) pandemic.

Forward-looking statements are necessarily based on a number of estimates, beliefs and assumptions that are inherently subject to significant business, economic and competitive uncertainties and contingencies which could cause actual results
to differ materially from those that are disclosed in such forward-looking statements. While considered reasonable by management of the REIT as at the date of this presentation, any of these estimates, beliefs or assumptions could prove to be
inaccurate, and as a result, the forward-looking statements based on those estimates, beliefs or assumptions could be incorrect. Such estimates, beliefs and assumptions include the various estimates, beliefs and assumptions set forth herein, and
include but are not limited to, the desirability of investment properties in the distribution subsector of the U.S. industrial real estate market to investors, including the industrial investment properties in the REIT’s portfolio; key trends and
continued and increased demand within the industrial investment property real estate market; the effect of management’s experience in the U.S. industrial real estate market on tenant retention and future acquisitions by the REIT; the future
growth potential of the REIT and its properties; anticipated amounts of expenses; results of operations; future prospects and opportunities; the demographic and industry trends remaining unchanged; no change in legislative or
regulatory matters; future levels of indebtedness; the tax laws in both Canada and the U.S. as currently in effect remaining unchanged; current levels of volatility in the demand for space in the distribution sub-segment have increased as a result
of COVID-19; the continued availability of capital; the current economic conditions have become increasingly unstable due to COVID-19 and lower tenant demand for industrial investment properties and flat vacancy rates in the markets in
which the REIT’s investment properties are located; and the scope and duration of the COVID-19 pandemic and its impact on the REIT.

This presentation does not constitute or form part of any offer for sale or solicitation of any offer to buy or subscribe for any securities nor shall it or any part of it form the basis of or be relied on in connection with, or act as any inducement to
enter into, any contract or commitment whatsoever. The information contained in this presentation concerning the REIT and its affiliates does not purport to be all-inclusive or to contain all the information that a prospective purchaser or
investor may desire to have in evaluating whether or not to make an investment in the REIT. The information is qualified entirely by reference to the REIT’s MD&A and the AIF.

Certain terms includes in this presentation such as debt-to-gross book value (“GBV”), FFO, AFFO, net operating income (“NOI”), book value per Unit, same property net operating income (“Same property NOI”), capitalization rate, cash re-
leasing spread, and straight-line rent re-leasing spread are used by management to measure, compare and explain the operating results and financial performance of the REIT and are not recognized terms under IFRS, and therefore should not be
construed as alternatives to net income (loss) and comprehensive income (loss) or cash flow from operating activities calculated in accordance with IFRS. Management believes these terms are relevant measures in comparing the REIT’s
performance to industry data, the REIT’s ability to earn and distribute cash returns to holders of the REIT’s trust units, and the REIT’s ability to meet its ongoing obligations. These terms are defined and reconciled to the most directly
comparable measure specified in the REIT’s MD&A. Such terms do not have a standardized meaning prescribed by IFRS and may not be comparable to a similarly titled measure presented by other issuers.

                                                                                                                         2
Overview

   WPT Industrial Real Estate Investment Trust is an internally managed and publicly
            traded REIT focused exclusively on the U.S. industrial sector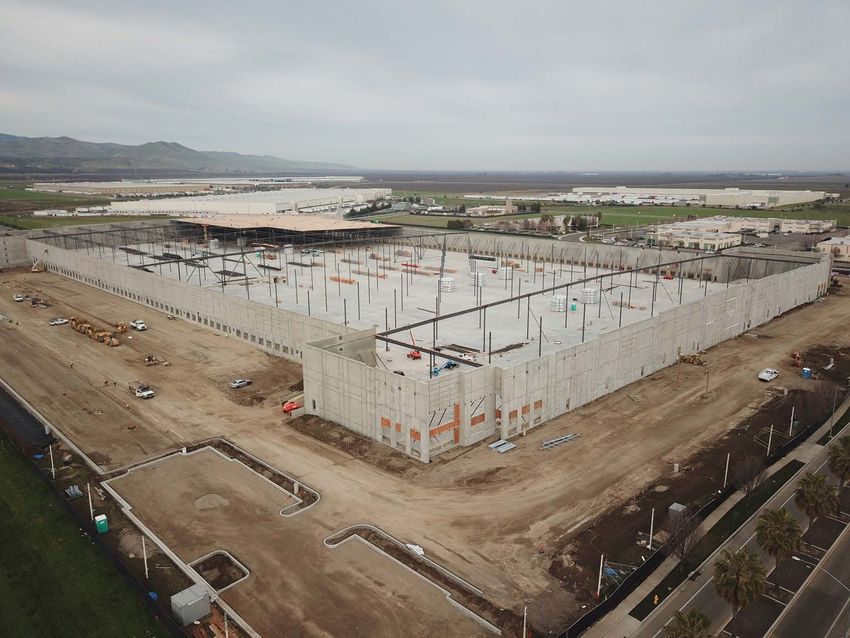
U.S. Exposure Through Fully-Integrated Platform

Seasoned management team with extensive knowledge of the U.S. industrial sector

Unit price and annual distribution of $0.76/unit in U.S. Dollars

Access to high-barrier U.S. markets through off-market private capital acquisition pipeline

                                               4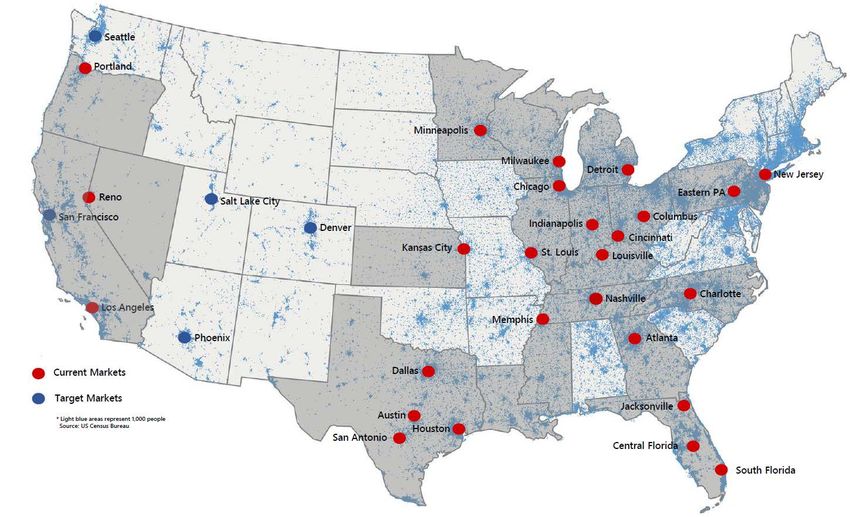
Proven Growth Strategies

       MAINTAINING    CONTRACTUAL                OFF-MARKET   FEE REVENUE
       CONSISTENTLY       RENT                   INVESTMENT   FROM PRIVATE
           HIGH        INCREASES                   PIPELINE     CAPITAL
        OCCUPANCY

 ROLLING                                WPT
                                                                         EXTENSIVE
RENTS TO       INTERNAL             MANAGEMENT           EXTERNAL
                                                                         INDUSTRY
MARKET AT       GROWTH               PLATFORM             GROWTH       RELATIONSHIPS
RENEWAL

         PROPERTY                                ENTRY INTO   PARTNERSHIPS
                       STRATEGIC
        EXPANSION                                 NEW U.S.    WITH PREMIER
                       FINANCING
           AND                                    MARKETS         GLOBAL
       DEVELOPMENT                                              INVESTORS

                                        5
Investment Criteria
                                                                                      We target Tier 1 and 2
       We underwrite investments                                                    distribution markets with
         focusing on asset basis                                                  proximity to major population
            relative to current                                                        centers, significant
          replacement costs and                        Basis
                                                                                  transportation infrastructure,
            competitive future                                                    access to cost-effective labor,
        speculative development                                                   and favorable long-term rent
                                                                                        growth prospects
                                   Rents Relative                   Location
                                     to Market

                                                      Building
We focus on acquisition of                          Functionality              We analyze submarket and
assets with in-place rents                                                      tenant-specific demand
that compare favorably to                                                         drivers to determine
market rents to drive long                                                     desired building attributes
     term NOI growth

                                                         6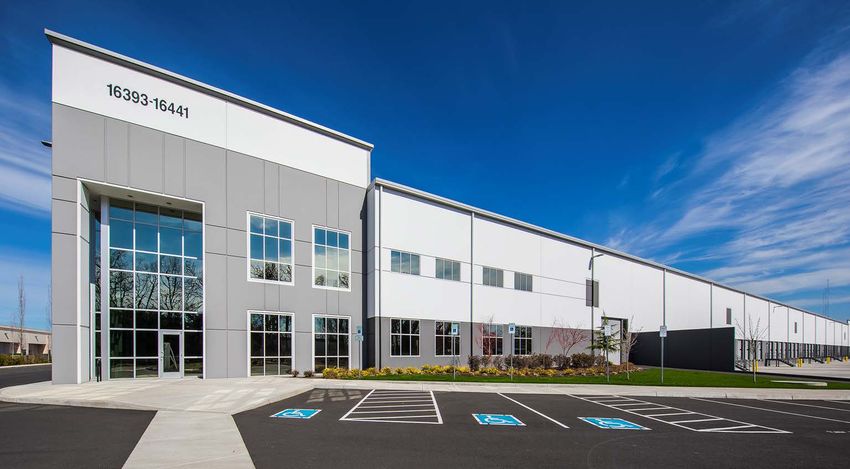
AVG. CEILING HEIGHT
                                  INVESTMENT PROPERTIES2
           31’
     ………………………………                          102
 AVG. BLDG. SIZE (SQ. FT.)            ………………………………

        318,000                  TOTAL SQUARE FEET OF GLA2
    …………………………………
AVG. TENANT SIZE (SQ. FT.)
                                      32,152,917
                                     …………………………………
        172,000                  FAIR VALUE OF INVESTMENT
  ……………………………………….
                                        PROPERTIES
AVG. ASSET AGE (YEARS)
                                         $2.3B
           15

                                                   1.   As at March 31, 2020
                                                   2.   Includes two assets held in joint venture

                             7
Quarterly Performance
                      (all figures in ‘000s, except per Unit amounts and gross leasable area
                      (“GLA”))                                                                        Q1 2020               Q4 2019            Q3 2019       Q2 2019       Q1 2019
                       Investment properties revenue                                           $         32,481 $              31,882 $          29,335 $      28,714 $      25,198
                       Management fee revenue                                                                273                    501           2,237           358           491
                       NOI                                                                               23,381                23,145            21,788        21,164        18,141

                       FFO                                                                               13,749                14,176            14,807        12,961         9,614

                       FFO per Unit (diluted)                                                              0.184                 0.216            0.243         0.213         0.176

                       AFFO                                                                              10,284                 11,069           11,980         9,759         6,698
                       AFFO per Unit (diluted)                                                             0.137                 0.169            0.197         0.161         0.123
                       Book value per Unit                                                                 12.98                 13.31            13.09         12.88         12.40
                       GLA 1                                                                       32,152,917             22,870,482          22,765,482    20,767,799    18,850,627
                       Occupancy 1,2                                                                     95.7%                 99.0%             99.5%         99.4%         99.1%
                       Same property NOI %3                                                                1.4%                  3.1%              4.5%          4.1%          3.4%
                       Weighted average remaining lease term (years) 1                                        4.7                   4.9              5.1           4.9           4.5

1.   Excludes properties owned by the equity accounted joint venture
2.   Exclusive of leases commencing after quarter end. Totaled leased GLA at 3/31/2020 was 97.3%, inclusive of leases commencing in Q2 2020
3.   Quarterly same property NOI vs. comparable period for the prior year

                                                                                                               8
Expanding U.S. Footprint   1

                                   1.   As at March 31, 2020

                               9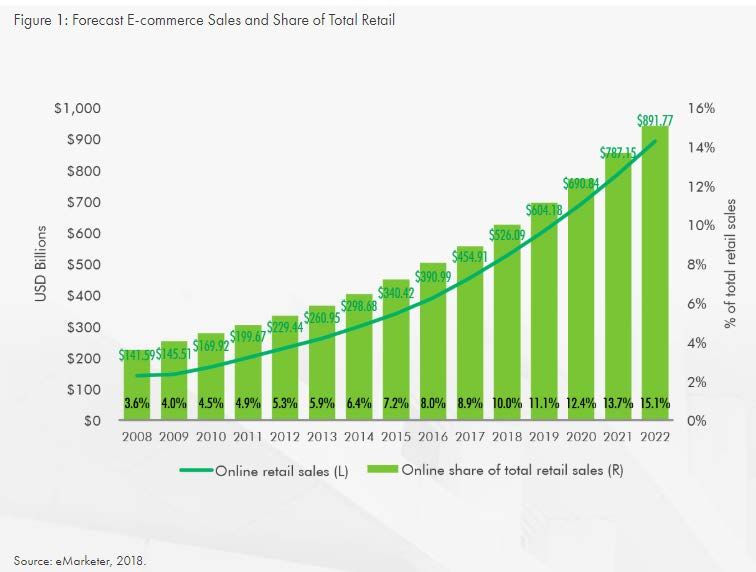
High-Quality Tenant Base
                                                                                                % of Total Annualized GLA Occupied (%) of Total Portfolio
                                  Tenant                                Industry
                                                                                                     Base Rent1       (‘000s sq. ft.)1     GLA1
                 FedEx Ground Package System, Inc.                Third Party Logistics                      13.7%                            1,874.1               5.9%

                 IKEA Distribution Services, Inc.                  Consumer Products                          3.5%                              996.5               3.1%

                 General Mills Operations, LLC                     Consumer Products                          3.0%                            1,512.6               4.8%

                 Continental Tire the Americas                     Consumer Products                          2.8%                              740.9               2.3%

                 Unilever Home & Personal Care                     Consumer Products                          2.8%                            1,262.5               4.0%

                 Amazon.com                                            E-Commerce                             2.6%                              936.0               2.9%

                 Keystone Automotive2                              Consumer Products                          2.3%                              754.8               2.4%

                 Zulily LLC                                            E-Commerce                             2.1%                              737.5               2.3%

                 Exel, Inc                                        Third Party Logistics                       1.7%                              800.0               2.5%

                 FullBeauty Brands, Inc.                               E-Commerce                             1.7%                              741.1               2.3%

                                          Total                                                              36.2%                          10,356.0                32.5%

1. As at March 31, 2020
2. Comprised of two leases with Keystone Automotive Operations, Inc. and Keystone Automotive Industries, Inc.; both wholly-owned subsidiaries of LKQ Corporation.

                                                                                                     10
Well-Positioned Balance Sheet 1
3.1 years Weighted average mortgage term to maturity
3.9 years Weighted average unsecured credit facility term to maturity
3.3% Weighted average effective interest rate of total debt
6.8% Variable interest rate debt as a percent of total debt
52.1% Total debt to GBV
2.9x Fixed charge coverage ratio
8.5x Debt to adjusted EBITDA
$112.3mm Unsecured credit facility availability
$50.4mm Cash on hand
1. As at March 31, 2020
11Staggered Debt Maturity 1
Debt Maturities by Year
350
350.0
331.7
300
3.3% Maturities ($ in Millions) 250
200
Weighted average 200.0
interest rate 150
100
74.9 84.5
50
53.0
35.7 - - 27.7 - 42.4
0
2020 2021 2022 2023 2024 2025
Mortgages Credit Facility
3.4% 4.6% 3.8% 3.8% 1.2% 1.0%
Weighted average interest rate of maturities
1. As at March 31, 2020
12Staggered Lease Expiration Schedule
Lease Expiration (% of GLA) by Year ¹
30.6%
4.7 years
Weighted average 21.5%
remaining lease term
15.2%
11.0% 11.1%
9.4%
1.2%
2020 2021 2022 2023 2024 2025 2026+
6 27 33 21 31 13 48
Number of Leases Expiring 1. As at March 31, 2020
13Leasing Update 1
Highlights
For the three
Asmonths
at 6/30/2017, the REIT
ended March had the
31, 2020, 4 leases totalinginto
REIT entered 2.1% of the portfolio
approximately 30,500remaining tosq.
and 355,200 beft.renewed.
of
new and renewal leases, respectively. Renewals commencing in 2020 had a weighted average cash re-leasing
spread and straight-line rent re-leasing spread of 4.5% and 17.1%, respectively.
2018
During the quarter, the REIT renewed approximately 753,200 sq. ft. of leases commencing after March 31, 2020
with a weighted average cash re-leasing spread and straight-line rent re-leasing spread of 10.4% and 16.1%,
respectively.
Occupancy stabilized at 97.3%, including two leases with an weighted average remaining lease term of 4.7
years, signed in the quarter that commence in the second quarter.
1. As at March 31, 2020
14Track Record of Growing Unitholder Value 1
210
190
170
150
130
125.9
110 108.5
90 91.0
80.3
70
Mar-13 Sep-13 Mar-14 Sep-14 Mar-15 Sep-15 Mar-16 Sep-16 Mar-17 Sep-17 Mar-18 Sep-18 Mar-19 Sep-19 Mar-20
WIR (US$) WIR (CAD$) S&P/TSX Composite Index (CAD$) S&P/TSX Capped REIT Index (CAD$)
1. Unit price growth from IPO – March 31, 2020
15Investment Activity
February 2020 Equity Raise

• Gross proceeds of approximately $271mm

• The REIT used the proceeds to fund a portion of the PIRET
  portfolio acquisition, comprised of 26 industrial buildings and
  one land parcel for a purchase price of $730mm. The
  acquisition closed on March 26, 2020.

• Participation from both existing and new investors

• Full exercise of over-allotment option

                                                 17
PIRET Portfolio Acquisition
IMMEDIATELY
ACCRETIVE The acquisition is immediately accretive to the REIT’s FFO and AFFO on a per unit basis
TRANSACTION
INCREASED The acquisition significantly increased the size and scale of the REIT’s portfolio to
PORTFOLIO SCALE approximately $2.3 billion, with a 39% increase in total GLA to approximately 32
AND LEVERAGE ON million square feet, enhancing the REIT’s ability to leverage its fully internalized
FIXED COSTS management platform
INSTITUTIONAL The acquisition portfolio consists of institutional quality assets with an average age of approximately 14 years,
QUALITY ASSETS average clear height of 31 feet
STRONG AND Approximately 60% of base rent is derived from investment grade tenants, with limited
DIVERSE IN-PLACE overlap to the REIT’s existing tenant roster. The portfolio has a weighted average lease
TENANT ROSTER term of 4.6 years
INCREASED
HIGH-BARRIER
MARKET EXPOSURE Expands WPT’s presence and operating platform in the high-barrier coastal markets of New Jersey, California
AND GEOGRAPHIC and Florida and strengthens the REIT’s presence in other key U.S. distribution markets
DIVERSIFICATION
FUTURE VALUE
Portfolio NOI can be increased over time through vacancy lease up, future development
CREATION
of land parcels and building expansion potential at existing sites
OPPORTUNITIES
CAPITAL
Increased size and scale from the acquisition enhances the REIT’s ability to reassess portfolio composition and
RECYCLING
recycle capital over the near term
OPTIONALITY
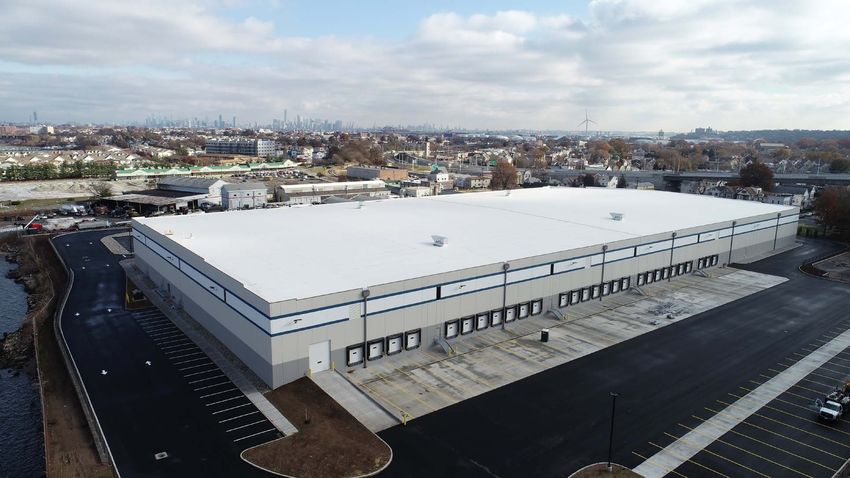
18Portland Acquisition
Acquired: Jan 2020
Purchase Price: $16.2mm
Square Feet: 126,303
Capitalization Rate: 5.6%
Clear Height: 24’
Occupancy: 100.0%
Lease Term: 3 Years
Dock Doors: 18
19Industrial Market Update
Current Market Trends

     Increased E-Commerce Penetration
     E-commerce continues to grow with sales increasing dramatically in response to COVID-19

     Reshoring
     Many companies have begun to reevaluate their supply chains in response to COVID-19

     Rising Inventory Levels
     Inventory levels are expanding in response to disruptions caused by COVID-19

     Measured Supply
     New Supply levels are increasingly muted as new developments are put on hold or cancelled.

     Fragmented Market
     Very few experienced operators relative to other asset classes

                                                       21
COVID-19 Developments
“The global pandemic’s effect on the industrial market sector remains in flux,
as the length and severity of its impact on the economy have yet to be
determined. However, the industrial property sector entered the first quarter of
the new year with strong fundamentals and we expect trends to follow suit
going forward. We continue to see growth in the e-commerce and grocery
industries along with suppliers for critical products including medical devices
and pharmaceuticals. As we move forward, we believe many companies will
be reevaluating their supply and stocking operations as well as redesigning
their distribution networks in response to the supply chain shock from
COVID-19, driving demand for manufacturing and last-mile facilities.”
Source: JLL Q1 2020 Industrial Outlook Source: CBRE Q1 2020 U.S. Industrial & Logistics Figures
22U.S. Industrial Market Fundamentals
23U.S. Industrial New Construction Deliveries
24Tenant Demand Continues to Drive Rent Growth
“Despite a potential slowdown in leasing activity as the market adjusts to
the global pandemic, top logistics markets continue to operate at a sub
3.0 percent vacancy rate, and although leasing activity will drop in the
coming quarters, we expect continued competition for quality space
adding pressure on rents through 2020. “
Source: JLL Q3 2019 Industrial Outlook Source: CBRE Q1 2020 U.S. Industrial & Logistics Figures
Reverse Logistics Driving Demand
Market Indicators Q1 20 Q1 19 Market Indicators
“The U.S. industrial vacancy rate closed out 2019 at 5.1% — one
Overall Vacancy 4.9% 4.9% of the lowest rates on record, but an uptick of nine basis points
Net Absorption 42.3mm 45.4mm (BPS) over the prior quarter and 14 BPS higher than year-end
2018. ”
Weighted Asking Rent (NNN) $6.49 $6.40
Source: Cushman & Wakefield Q1 2020 U.S. Industrial MarketBeat report U.S. Research Report | Q4 2019 | Industrial Market Outlook | Colliers International
25E-Commerce Growth Potential
• The industrial tenant sectors that dominated the market going into 2020 included e-
commerce, Retail, and Logistics & Distribution. E-commerce nearly doubled its
leasing volume compared to the previous quarter from 10.7 million square feet to
24.9 million square feet. Inland Empire, Dallas-Fort Worth, Eastern and Central
Pennsylvania, and Houston continue to produce the highest deliveries and leasing
volume in the industrial market. Moving forward we expect this trend to continue as
the adoption of e-commerce and technology by consumers evolves resulting in a
focus on Urban Logistics and demand for last mile spaces
(Source: JLL– Q1 2020 United States Industrial Outlook)
• Although leasing activity may slow in the coming quarters, industrial
demand will be bolstered by greater inventory controls, supply chain
diversification and e-commerce growth.
(Source: CBRE Research,, Q1 2020)
• Fourth quarter 2019 e-commerce sales increased ~16.4% from the same
period in 2018 compared to a total retail sales increase of 4.0%.
(Source: Q4 2019 US Census Bureau’s ‘Quarterly Retail E-Commerce Sales)
26Research Analyst Coverage
Name Firm Email Phone
Troy MacLean, CFA BMO Capital Markets troy.maclean@bmo.com (416) 359-8366
Mark Rothschild Canaccord Genuity Corp mrothschild@canaccordgenuity.com (416) 869-7280
Chris Couprie, CFA CIBC chris.couprie@cibc.com (416) 594-7194
Michael Markidis, CFA Desjardins Capital Markets michael.markidis@desjardins.com (416) 607-3028
Brad Sturges, CFA iA Securities bsturges@iagto.ca (416) 203-5827
Matt Kornack National Bank Financial matt.kornack@nbc.ca (416) 507-8104
Neil Downey, CFA, CA, CPA RBC Capital Markets neil.downey@rbccm.com (416) 842-7835
Himanshu Gupta, CPA, CA, CFA Scotia Capital himanshu.gupta@scotiabank.com (416) 863-7218
27Board of Trustees
Independent Audit Investment CG&N1
Trustee Real Estate/Board Experience Trustee Committee Committee Committee
• Independent Consultant
Milo Arkema • Former Accountant, Baker Tilly Virchow Krause, LLP
(CHAIR)
• Senior Vice President of Investments, Cadillac Fairview
Louie DiNunzio • Chartered Accountant
(CHAIR)
Scott Frederiksen • CEO
Chair of the Board • 30+ Years of industrial experience
• Former Commissioner, Ontario Securities Commission
Sarah Kavanagh • Former Vice Chair, Co-Head, Diversified Industry Group, Scotia Capital
(CHAIR)
• Former Chairman and Founder, EPIC Realty Partners Inc.
Stuart H.B. Smith • Former President and CEO of Oxford Properties Group
• Former President and CEO, Column Canada Financial Corp
Pamela Spackman • Former Vice-President of Mortgage Investments, Ministry of Finance,
Province of British Columbia
Robert Wolf • Principal, RTW Capital Corporation
Lead Trustee • Former CFO, RioCan REIT
1. Compensation, Governance and Nominating
28Scott Frederiksen Chief Executive Officer P: 612-800-8501 E: stf@wptreit.com
You can also read