SENIOR LIVING RESEARCH - ANNUAL PERFORMANCE REVIEW - Thinkhouse
←
→
Page content transcription
If your browser does not render page correctly, please read the page content below
RESEARCH

2019

SENIOR LIVING
ANNUAL PERFORMANCE REVIEW
SENIOR LIVING ANNUAL PERFORMANCE REVIEW 2019
INTRODUCTION
Our market leading research examines the fundamentals of the THE CASE FOR RENTAL
FIGURE 2
private Senior Living market from the strong demographic landscape Private Senior Living and care home models
IN SENIOR LIVING
to sales and rental performance of the largest private operators.
Lauren Harwood
Our database of information on the burgeoning Senior Living sector is expanding rapidly, and
Head of Senior Living Research
our aim is to use the headline data to help contextualise the industry for those already active or
247k*
thinking of investing. We look forward to working with you over the next year.
NUMBER OF EXISTING UNITS/BEDS
213k*
FLEXIBILITY
MARKET FUNDAMENTALS
153k
• Property • Property • Property • Property The former family home can be sold
UK DEMOGRAPHIC • Property • Hospitality • Hospitality • Hospitality • Hospitality at the resident’s convenience
SNAPSHOT
90+
85-89
2019 2029 90+
85-89
• Services • Services • Services
There is a growing demand and supply services, and Independent and Assisted • Assistance with • Assistance with • Assistance with
80-84 80-84 daily activities daily activities daily activities
imbalance
75-79
in the UK, driven by an ageing Living with an increasing facility and service
75-79 • Care • Specialised Care • Specialised Care
population
70-74 and structural undersupply of offering, including care. 70-74 • Nursing Care
21k
suitable
65-69 housing for seniors. 65-69
The private Senior Living market to date has
60-64 60-64
The55-59Senior Living sector has evolved in predominantly been driven by a ‘For-sale’
55-59
AGE RESTRICTED INDEPENDENT ASSISTED PERSONAL NURSING
recent
50-54 years, and there are now an extensive model offering properties on a leasehold
AGE GROUP
AGE GROUP
50-54 HOUSING LIVING LIVING CARE CARE
range45-49of tenures and offerings with varying basis to those looking to downsize. 45-49 LOWER COST OF RE-LOCATING
12 MILLION PEOPLE
AGED 65+ facilities
40-44 and services (which include 40-44 No stamp duty to pay
There has been a shift in the economics from
hospitality
35-39 and care). As the sector evolves 35-39
Number of existing UK units * This includes privately-owned care homes
There are more than 12 million a housebuilder model based maximising 30-34
people in the UK aged aged 65 or over it is30-34
increasingly seen as the seniors housing
25-29 development margins to an operational 25-29
market which comprises Age Restricted
20-24 model with profit derived from the 20-24
Housing,
15-19
Independent Living, Assisted Living 15-19 Source: Knight Frank, EAC
development and the operating business.
and10-14Memory Care. 10-14
Deferred Management Fees or Charges
5-9 5-9
In this analysis we cover: Age Restricted (DMF) are key to this model, to enable land PEACE OF MIND
0-4 0-4
Housing with a lower range of facilities and to be acquired in a competitive market and operational models to be profitable. the growth in value of the residents purchase A resident can move within a
5,000,000 4,000,000 3,000,000 2,00,0000 1,000,000 0 1,000,000 2,00,0000 3,000,000 4,000,000 5,000,000
Increasing clarity from the Law Commission and investment. scheme and trade space for care as
NUMBER (MILLIONS) their needs increase
on the use of DMF’s has helped progress
OLDER POPULATION RISING FIGURE 1 Lastly, it is interesting that the first
The ageing population: England ONS Projections this model in the sector. The DMF enables
The number of those aged 65+ is substantial rental platforms are materialising,
payment of part of the long-leasehold Deferred Management Fee (DMF) model
forecast to grow by 22% over the with increasing equity invested into the
AGE GROUP 2019 2039 AGE GROUP interest when the property is vacated –
next decade rental seniors market from the UK and
CONSTRUCTION
SALES
90+ 128% 90+ allowing for management costs and capex.
% CHANGE overseas. Existing for-sale operators are
85-89 71% 2019-2039 85-89
The DMF aligns the interests of the operator introducing rental as pepper-potted units or
80-84 53% 80-84 TAX PLANNING
75-79 75-79
and the residents – and ensures re- standalone blocks into schemes, and we are
54% Earlier release of equity to reduce
investment and management of the scheme seeing the first BTR Senior Living schemes
70-74 24% 70-74 Inheritance Tax
65-69 65-69
over the long term. This in turn maximises come forward. Development Income
24%
Profit
60-64 6% 60-64
55-59 0% 55-59 FIGURE 3
POPULATION AGEING
50-54 -3% 50-54 Private Senior Living operator income models – For-sale model
The number of people aged 80+ is set YEAR 1 YEAR 2 YEAR 3 YEAR 4 YEAR 5 YEAR 6 YEAR 7 YEAR 8 YEAR 9 YEAR 10
45-49 4% 45-49
to climb by 40% over the next decade
40-44 7% 40-44 Deferred Management Fee (DMF) model Housebuilder Model
35-39 -9% 35-39
CONSTRUCTION
SALES
CONSTRUCTION
SALES
30-34 -2% 30-34
25-29 4% 25-29
20-24 8% 20-24
65 15-19 15% 15-19
10-14 2% 10-14 Development
Profit
1 IN 4 OVER 65 5-9 -6% 5-9 Development Income
Profit
One in four people in the UK will 0-4 -1% 0-4
be aged 65 or over in the next 25 years 5,000,000 4,000,000 3,000,000 2,00,0000 1,000,000 0 1,000,000 2,00,0000 3,000,000 4,000,000 5,000,000
Income
NUMBER
YEAR 1 YEAR 2 YEAR 3 YEAR 4 YEAR 5 YEAR 6 YEAR 7 YEAR 8 YEAR 9 YEAR 10 YEAR 1 YEAR 2 YEAR 3 YEAR 4 YEAR 5 YEAR 6 YEAR 7 YEAR 8 YEAR 9 YEAR 10
Source: Knight Frank Source: Knight Frank, ONS Source: Knight Frank
Housebuilder Model
CONSTRUCTION
SALES
2 RESEARCH KNIGHT FRANK Please see important notice on back page of report KNIGHT FRANK RESEARCH 3SENIOR LIVING ANNUAL PERFORMANCE REVIEW 2019
CURRENT AND
PROJECTED SUPPLY
There are currently around 740,000 Senior Living units across
FIGURE 6
the UK and almost a quarter of these are private units, some Private Senior Living annual supply, by region: current and forecast
175,000 units.
2018 2019
Given the growth of investment in the Senior England. In time, varying DMF models and an The rental market for Senior Living is likely to
017
511
2
Living sector in recent years, an increase in increase of rental schemes will help re-distribute increase, in line with the changing tenure trends
FO
381
20
delivery of units is widely expected. We have 20
delivery into lower priced areas of the UK. across the wider housing market, particularly the
RE
577
518
536
analysed the future plans of all major operators uplift in renting among older age groups in the
6
6
55
against past delivery to forecast a 30% increase In London, we estimate that the number of 01
317
UK. As well as increased interest in purpose- 2
C
private units priced at more than £1,000 psf will
6
62
to the current stock of private living senior units
A S 202
built rental (BTR), for-sale operators are also
31
1,195
1,376
158
7
rise from 300 at present to 2,000 units by the
14
by the end of 2023. This equals an additional increasing their allocation of private rented units
59
T 1
1,05
7
50,000 private sale and rental units being end of 2023.
1,744
0
pepperpotted in their schemes. Projections from
1,508
08
6
64
1,7
15
54
delivered in the next four years.
1,03
There are more than 4,000 existing Senior Living the Centre for Ageing Better suggest that by
20
63
8
39 7
92
2
private rental units in the UK, with 93% of these 2040, a third of those aged 60+ could be living in 50
190
0
However, the growth in private delivery will not
180
80
59
200
6
2,1
1,3
be spread evenly across the country – it will pepper-potted in for-sale schemes, and the privately rented housing. Knight Frank estimates 16
40
71
2,3
488
0
42
20
be concentrated in £350psf+ markets in the remaining 7% delivered as purpose-built rental the value of the private rental market will increase
358
73
7
36
202
3
47
71
9
55
South East, South West, Midlands and East of schemes (BTR).* from £1.3bn in 2019 to £3.4bn by 2023. 3,2
508
1,0
90
38
57
700
4
39 0
20
2
0
201
439
814
3
13
55
59
93
8
58
341
286 44 64
5
FIGURE 4 36 8 2,30
9
6
38
64
67
Annual delivery of Senior Living units in the UK
289
1
931 2
657
FORECA
804
802 7 2,98
208 28 1,54 300
8
8
90
707
216
116
63
90
150
26
1,1 707
5
0
764
20,000
41
3
1,57
41,183
2
67,788
1
82
NUMBER OF UNITS DELIVERED P.A
89 42
SHIRE & THE HUMBER
15
1,0
WEST MIDLANDS
376 8 8
1,45
WALES
Knight Frank 7
SOUTH WEST
Units constructed 1,34
2023
Units forecasted 92
SOUTH EAST
15,000
SCOTLAND
300 46
819 819 2,790 941 816
NORTH WEST
1,806 2,013
forecasts the 802 376 1,548 1,649
TH EAST
931
LONDON
LAND
delivery of more than
DS
10,000
LAN
50,000 private sale
ENG
NOR
ID
units and 6,000
M
OF
5,000 ST
private rental units
YORK
T
EA
Includes private sale and rental units
AS
between 2019-2023
E
0
2014 2015 2016 2017 2018 2019 2020 2021 2022 2023
Source: EAC, Knight Frank
Private owned Private rent Social housing Hybrid*
* Note: This includes a mixed of tenures and shared ownership FIGURE 7 FIGURE 8
Private Senior Living supply Trends in 65+ household tenure In England
projections in the UK
FIGURE 5
Senior Living total UK stock by tenure – current and forecast
PRIVATE FOR-SALE PRIVATE RENTAL
All 65+ households (right hand axis)
All 65+ households projection (right hand axis)
93%
FORECAST PRIVATE FOR-SALE 450 8,000
800,000 Private owned Private rent Social housing Hybrid*
2019 (existing) 2019 (existing) Outright owners (right hand axis) FORECAST
Value - £38.2bn Value - £1.3bn 2019 (existing) 400 Owners with mortgage (left hand axis)
Value - £38.2bn Private renters (left hand axis) 7,000
700,000 Total units - 172,000 Total units - 4,000
Total units - 172,000 350
HOUSEHOLDS (THOUSANDS)
HOUSEHOLDS (THOUSANDS)
6,000
600,000
2023 (forecast total) 300
5,000
TOTAL UNITS
500,000 Value - £51.6bn
250
Total units - 220,000
400,000 4,000
200
300,000 150
3,000
PRIVATE RENTAL
200,000 2019 (existing) 100 2,000
Value - £1.3bn
100,000 Total units - 4,000 50 1,000
0 2023 (forecast total) 0
7% 0
2003-04
2004-05
2005-06
2006-07
2007-08
2008-09
2009-10
2010-11
2011-12
2012-13
2013-14
2014-15
2015-16
2016-17
2017-18
2018-19
2019-20
2020-21
2021-22
2022-23
2023-24
2024-25
1980
1981
1982
1983
1984
1985
1986
1987
1988
1989
1990
1991
1992
1993
1994
1995
1996
1997
1998
1999
2000
2001
2002
2003
2004
2005
2006
2007
2008
2009
2010
2011
2012
2013
2014
2015
2016
2017
2018
2019
2020
2021
2022
2023
2023 (forecast total) 2023 (forecast total) Value - £3.4bn
Value - £51.6bn Value - £3.4bn Total units - 10,700
* Note: This includes a mixed of tenures and shared ownership
Total units - 220,000 Total units - 10,700
Source: EAC, Knight Frank Source: EAC, Girlings, Knight Frank Source: Knight Frank, English Housing Survey
* Note: Private rental units refer to those in existing Age Restricted and Independent Living schemes. These
4 RESEARCH KNIGHT FRANK figures currently exclude beds within higher care provision schemes such as Sunrise and Signature. KNIGHT FRANK RESEARCH 5SENIOR LIVING ANNUAL PERFORMANCE REVIEW 2019
SALES PERFORMANCE
Methodology: We took a sample of 200 Indeed, the data shows that in 2018, the noting that this data will be influenced by the
schemes across the country developed average achieved sales price for Independent/ schemes on sale in any given year. When FIGURE 12
Assisted Living units are higher than for Age Achieved sales values for Senior Living sales
since 2000, split between Age Restricted observing individual property resales, we
Housing (57%) and Independent/Assisted Restricted Housing. can identify that on average, these units are
Living (43%). The schemes are made up Likewise, achieved £psf pricing for new-build retaining value on resales, as identified by ACHIEVED SALES VALUES – 2000-2019 (YTD) BY TYPE
of more than 6,500 individual units, which is higher than resale as expected. It is worth our resale index overleaf.
we tracked from original sale through all £1,400,000
re-sales to today, providing data for more £1,200,000
than 10,000 private Senior Living sales. FIGURE 9 FIGURE 10
ACHIEVED PRICE (£)
Sample: % of sales examined, by Sample: Sales per year – new-build £1,000,000
This analysis includes schemes from all
region, 2014-2019 and resale
major private Senior Living operators, which £800,000
together have delivered 77% of private
2,000 £600,000
Senior Living units in schemes of 20+ units. Age restricted
Independent/Assisted Living
housing
New Build Resale £400,000
The database incorporates schemes spread Independent/ Age-Restricted Housing
assisted living £200,000
across the country, but with a natural bias New Build Resale
towards the South East and the South West of 1,500
£0
England (as shown in Figure 9) as that is where 2000 2001 2002 2003 2004 2005 2006 2007 2008 2009 2010 2011 2012 2013 2014 2015 2016 2017 2018 2019
YORKSHIRE &
most development activity has been focused. THE HUMBER Age restricted housing Independent/assisted living Average property prices (England & Wales)
5% | 6%
NUMBER OF SALES
Using this data, we are able to understand EAST
MIDLANDS
the impact of demographics, local housing 4% | 5%
NORTH WEST
1,000 ACHIEVED SALES VALUES – 2000-2019 (YTD) – AGE RESTRICTED HOUSING
market, scheme facilities and services on 6% | 3% EAST OF
ENGLAND
scheme performance. WEST 10% | 10% £1,400,000
MIDLANDS
5% | 10%
£1,200,000
ACHIEVED PRICE (£)
How Senior Living compares WALES
0% | 0% 500 £1,000,000
Our data demonstrates that Independent/ £800,000
Assisted Living have higher sales values SOUTH WEST
27% | 22% £600,000
on average compared to Age Restricted
Housing, this is typically due to the the wider SOUTH EAST LONDON 0 £400,000
37% | 36% 6% | 8% 2014 2015 2016 2017 2018 2019
provision of facilities and services on offer £200,000
on offer (as examined further on Page 9). Source: Knight Frank, Land Registry Source: Knight Frank, Land Registry *January to June 2019
£0
2000 2001 2002 2003 2004 2005 2006 2007 2008 2009 2010 2011 2012 2013 2014 2015 2016 2017 2018 2019
FIGURE 11 New build Resale Average (new build) Average (resale)
Achieved pricing analysis for Senior Living sales in England
ACHIEVED SALES VALUES – 2000-2019 (YTD) – INDEPENDENT/ASSISTED LIVING
AV E R A G E PR IC E PAID 2 0 1 4-2018 AV ERAGE AC HI EV ED £ P S F I N 2 0 1 8
£1,400,000
£600,000
4
£1,200,000
£49
£500,000
£1,000,000
ACHIEVED PRICE (£)
ACHIEVED PRICE (£)
£400,000
0
£800,000
£44
£600,000
£300,000
£400,000
£200,000
£200,000
£100,000 £0
2014 2015 2016 2017 2018 Age Restricted Housing Independent/Assisted Living
2000 2001 2002 2003 2004 2005 2006 2007 2008 2009 2010 2011 2012 2013 2014 2015 2016 2017 2018 2019
Age Restricted Housing Independent / Assisted living New build Resale Average (new build) Average (resale)
Source: Knight Frank, Land Registry Source: Knight Frank, Land Registry
6 RESEARCH KNIGHT FRANK Note: All Senior Living data on this page is from the Knight Frank sample database. Note: All Senior Living data on this page is from the Knight Frank sample database. KNIGHT FRANK RESEARCH 7SENIOR LIVING ANNUAL PERFORMANCE REVIEW 2019
WHAT DRIVES VALUE
Examining the sales from our sample in
more detail, it can be seen that over time, FIGURE 13
the rise in pricing in Age Restricted Housing Sales index – Senior Living vs Residential
largely tracks the average house price
index, while Independent/Assisted Living 200
has outperformed as shown in Figure 12. Independent/Assisted living The value and performance of a unit within a Senior Living
Age-restricted housing
England HPI scheme is influenced by a number of factors.
175
Location is a crucial factor when assessing Indeed the level of care provision can suggesting that some schemes with a diverse
demand and value as it can strongly also play a large part in the length of stay range of facilities e.g. a pool and a gym,
150
influence a senior’s decision to relocate. The for a resident (figure 15). With increasing achieve higher sales values compared with
location of a scheme can be influenced by: care provision on offer in Assisted Living schemes with little or no facilities.
125
the number of seniors within a specific area, schemes, residents can stay for longer, and
the demographic composition, wealth and Figure 17 demonstrates the relationship
potentially reduce the need for, or the time
liquidity, and downsizing potential in relation between rental pricing and the provision
that would be spent in, a care home.
to affordability. of facilities and services. In time, and with
100
The facility offering is also an influencing more data, we can analyse this relationship
The performance of the local residential
factor in determining value, with evidence in more detail.
market is also an important factor. With a
“
75 large proportion of downsizers selling their
property to release equity for a Senior Living
FIGURE 16
move, an understanding of performance
SOUTH EAST: Achieved £PSF by service offering in Independent/Assisted Living
Our analysis shows that 50 in the residential market – both locally and
2006 2007 2008 2009 2010 2011 2012 2013 2014 2015 2016 2017 2018 schemes built since 2010
Independent/Assisted Living regionally – underpins the success of a
Methodology: This uses hedonic regression based on price and controlling for characteristics such as region, property type Senior Living scheme.
achieves a higher £PSF across and size. The dataset has a bias due to the nature of a sample, with this being heavily weighted towards the South East and 900
many regions compared to South West and to flats. We have tried to control for this. The composition of a scheme itself can also 800
drive value. Unit mix, layout and specification
Age Restricted Housing. Source: Knight Frank, Land Registry
can be determining factors of performance.
700
600
The provision of services such as care or 500
assistance with everyday activities can widen
£ PER SQ FT
FIGURE 14 400
Average achieved £psf – Senior Living by region (2018) the demand and influence the performance
300
of a scheme in terms of achieved pricing,
200
sales rates and length of stay. This
100
AGE RESTRICTED
AGE RESTRICTED INDEPENDENT/INDEPENDENT/
relationship is highlighted in Figure 16, with
HOUSING HOUSING ASSISTED LIVING
ASSISTED LIVING higher service schemes commanding higher 0
2014 2015 2016 2017 2018 2019
£300-£350 £300-£350
£PSF in the South East.
£300-£350 £300-£350 High service provision scheme Average service provision scheme
£350-£400 £350-£400 £350-£400 £350-£400
£400-£450 £400-£450 £400-£450 £400-£450
£450-£500 £450-£500 £450-£500 £450-£500 Source: Knight Frank
£500-£550 £500-£550 £500-£550 £500-£550
FIGURE 15
£600+ £600+ £600+ £600+
Average length of ownership in England
YORKSHIRE & YORKSHIRE & YORKSHIRE & YORKSHIRE & FIGURE 17
THE HUMBER THE HUMBER THE HUMBER THE HUMBER
Rental pricing for private Senior Living schemes
NORTH NORTH NORTH NORTH 3-8
WEST WEST WEST WEST YEARS
EAST EAST EAST EAST
MIDLANDS MIDLANDS MIDLANDS MIDLANDS 2-6
CARE AND HOSPITALITY SERVICES
Care Homes /
WEST WEST WEST WEST YEARS Memory Care
MIDLANDS MIDLANDS EAST OF EAST OF MIDLANDS MIDLANDS EAST OF EAST OF Assisted
ENGLAND ENGLAND ENGLAND ENGLAND Living
Independent
Living
LONDON LONDON LONDON LONDON
SOUTH EAST SOUTH EAST SOUTH EAST SOUTH EAST Age Restricted Age Restricted
SOUTH WEST SOUTH WEST SOUTH WEST SOUTH WEST Housing Housing
(secondary) (new build)
AGE RESTRICTED INDEPENDENT/
HOUSING ASSISTED LIVING TOTAL RENTAL CHARGE PER CALENDAR WEEK (PWC)
Note: Categories with a small number of sales in 2018 have been excluded from our analysis
Source: Knight Frank, Land Registry Source: Knight Frank, Land Registry Source: Knight Frank, operator data
8 RESEARCH KNIGHT FRANK Note: All Senior Living data on this page is from the Knight Frank sample database. Note: All Senior Living data on this page is from the Knight Frank sample database. KNIGHT FRANK RESEARCH 9SENIOR LIVING ANNUAL PERFORMANCE REVIEW 2019
FIGURE 18
£PSF by facility level – schemes with pool and gym
Independent/Assisted Living schemes in the South East
OUTLOOK
£psf with pool or gym £psf no pool or gym
Focusing on Independent/ £900
Assisted Living schemes £800
How would you The sector is being driven by structural
demographic shift, economics of wealth
in the South East, we have characterise 2019 in the accumulation and care needs. This shift is
analysed the achieved £PSF £700
for sales within schemes with Tom Scaife Senior Living Market? happening, and not going away. Seniors are
£600 living longer due to benefits of increased wealth
a higher facility offering versus Head of Senior Living The UK seniors housing market has really
ACHIEVED £PSF
those with a lower offering. £500
and access to healthcare through their lifetimes.
taken off in 2019, fuelled by increased
The analysis indicates that a The development of property specifically
international capital coming into the market –
higher provision of facilities,
£400 designed for seniors will provide them with a
including private equity, institutional investment
particularly the presence of better range of housing options and free up
£300 and investment from family offices. The largest
a pool or gym can positively family housing for future generations.
£200
proportion of international capital has flowed
influence achieved pricing.
from North America this year.
£100 What are your predictions for
The number of deals has increased this year,
0 among both established operators and new the coming years?
2014 2015 2016 2017 2018 2019
entrants. Larger deal sizes are taking place as • We expect increasing levels of activity in
operational efficiencies are sought, and there the sales market and the continued
Source: Knight Frank, Land Registry have also been sizable forward funding deals. expansion of the institutional investment-
Underpinning this trend is a search for real grade rental market.
Operational performance TABLE 1 estate alternatives in the investment markets as • Going forward, we will see increased
FACILITIES AND SERVICES WITHIN PRIVATE SENIOR LIVING SCHEMES other sectors look mature or under pressure. diversification of residential masterplans
As part of this exercise, we were fortunate Certainly there is debt funding available for and more partnerships between builders
FACILITIES SERVICES
to work operators across the Senior Living development across the spectrum of seniors and operators, with a focus on the
sector and undertake a detailed analysis of housing – from Age Restricted Housing, role Senior Living can play creating
Dining, educational activities, exercise activities,
their operations and performance. Entrance hall, guest suite, lounge, cafe, bar, through Independent Living to Assisted Living intergenerational communities.
transportation, assistance with daily living
restaurant, library, cinema room, craft room,
Here is a snapshot of the analysis of the activities (dining, bathing, dressing, help with schemes, both sale and rental.
gym, yoga studio, spa, pool, treatment room • There will be an increased number of joint
operator data. walking), medication management
ventures and management agreements
Any challenges ahead? between care companies and developers.
TABLE 2
Some of the biggest challenges, once More operators will also enter the market.
COMPONENTS OF INCOME 2018/19 (%) overcome, could be significant opportunities • The increased transparency around, and
F&B LEISURE/ SERVICES TOTAL TOTAL SERVICE DMF FEE within our sector. These include effectively rising acceptance of, deferred management
INCOME WELLNESS AND OTHER GROUND CHARGE / applying increasingly sophisticated
INCOME INCOME RENT MANAGEMENT fees (DMF) among residents and investors
RECEIVED INCOME technology to the sector and solving will lead to increased purchase options for
the staffing conundrum. consumers. The charges offer more scope
for flexibility around using housing equity to
We need to increase the use of technology –
FIGURE 19 purchase while retaining pension income.
including for medication administration, human
Average Staff to unit ratio,
Independent/Assisted Living
resources and dissemination of information for • The market will continue to expand
10% 1% 11% 3% 62% 12% family members. with a focus on flexible services, access
to high quality care with wellness a
And we need to come together to find and
Source: Knight Frank operator analysis priority, an expansion of tenure options,
create the employment base to meet the
new construction methods and a long
growing business opportunity. Increased
TABLE 3 term operational approach. Increased
partnerships with universities and colleges are
COMPONENTS OF COSTS 2018/19 (%) government support and clarity at the
required to establish hospitality and wellness
planning level along with SDLT relief for
as a more recognised career. More advanced
PAYROLL REPAIRS & UTILITIES ADMINISTRATIVE F&B LEISURE/ OTHER downsizers would be great – but let’s not
COST MAINTENANCE COSTS COSTS WELLNESS COSTS training programmes will be required to
hang around for it!
COSTS improve staff retention rates and manage
those staffing costs. • The ageing population, especially the
forecast growth in those aged 80 or over
between now and 2040 will lead to an
What about Brexit?
1 STAFF MEMBER increase in demand for assisting living. The
44% 7% 10% 6% 7% 3% 24% Senior Living is not immune from the uncertainty example set by North America illustrates the
TO 6 UNITS
created by Brexit, but we expect a high level potential offered by continuum of care, with
of resilience in this market due to the strong independent, assisted and memory care
Source: Knight Frank operator analysis Source: Knight Frank operator analysis
fundamentals and defensive nature of the sector. being delivered in one scheme.
10 RESEARCH KNIGHT FRANK Note: All Senior Living data on this page is from the Knight Frank sample database. KNIGHT FRANK RESEARCH 11RESEARCH
Lauren Harwood
Head of Senior Living Research
+44 20 7268 2599
lauren.harwood@knightfrank.com
SENIOR LIVING
Tom Scaife
Head of Senior Living
+44 20 7861 5429
tom.scaife@knightfrank.com
Peter Youngs
Partner – Valuation & Advisory
+44 20 7861 1656
peter.youngs@knightfrank.com
HEALTHCARE
Julian Evans
Head of Healthcare
+44 20 7861 1147
julian.evans@knightfrank.com
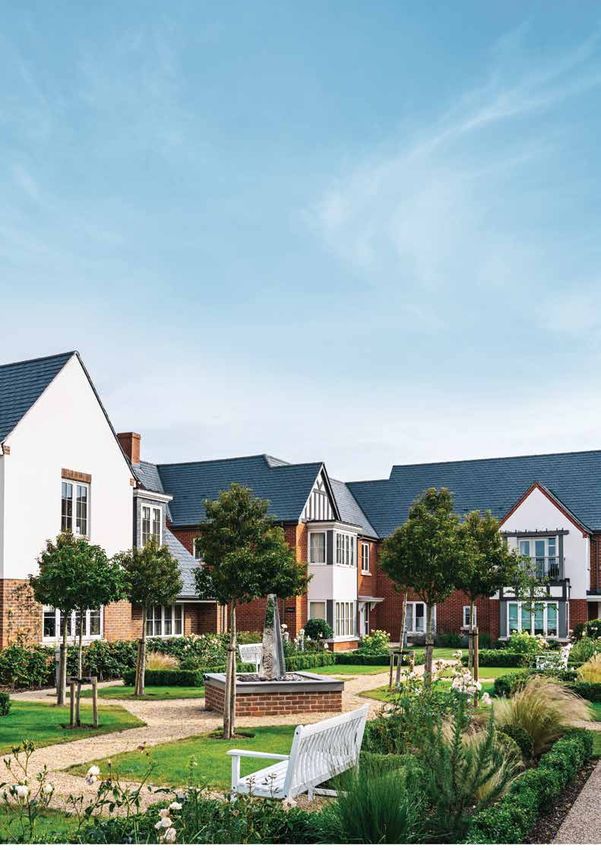
Front cover image: Gifford Lea, Tattenhall, Inspired Villages Group
Knight Frank Research provides strategic advice, consultancy services and forecasting to a wide
range of clients worldwide including developers, investors, funding organisations, corporate
institutions and the public sector. All our clients recognise the need for expert independent advice
customised to their specific needs.
RECENT MARKET-LEADING RESEARCH PUBLICATIONS
RESEARCH
2019
CARE HOMES RESIDENTIAL
TRADING PERFORMANCE REVIEW
INVESTMENT
REPORT 2019
Sectors Analysed | Growth Forecasts | New Investor Survey
SENIOR LIVING The case for
SURVEY Retirement Housing
SENIOR LIVING RESEARCH Retirement Housing Insight Series 2018
HIGHLIGHTS Sector Update | Tenant Survey Results | Investor Survey
Staff costs continue to grow
Average weekly fees up for the eighth Profit margins remain squeezed but the
with operators increasingly
year in a row private pay market is performing well
dependent on agency workers
Care Homes Trading Senior Living Survey Residential Investment The case for Retirement
Performance Review 2019 Report 2019 Housing 2018
Knight Frank Research Reports are available at KnightFrank.com/Research
Important notice: This report is provided strictly on the basis that you cannot rely on its contents and Knight Frank LLP (and our
affiliates, members and employees) will have no responsibility or liability whatsoever in relation to the accuracy, reliability, currency,
completeness or otherwise of its contents or as to any assumption made or as to any errors or for any loss or damage resulting from any
use of or reference to the contents. You must take specific independent advice in each case. It is for general outline interest only and will
contain selective information. It does not purport to be definitive or complete. Its contents will not necessarily be within the knowledge
or represent the opinion of Knight Frank LLP. Knight Frank LLP is a property consultant regulated by the Royal Institution of Chartered
Surveyors and only provides services relating to real estate, not financial services. This report was researched and written in September
2018 based on evidence and data available to Knight Frank LLP at the time. It uses certain data available then, and reflects views of
market sentiment at that time. Details or anticipated details may be provisional or have been estimated or otherwise provided by others
without verification and may not be up to date when you read them. Computer-generated and other sample images or plans may only
be broadly indicative and their subject matter may change. Images and photographs may show only certain parts of any property as
they appeared at the time they were taken or as they were projected. Any forecasts or projections of future performance are inherently
uncertain and liable to different outcomes or changes caused by circumstances whether of a political, economic, social or property
market nature. Prices indicated in any currencies are usually based on a local figure provided to us and/or on a rate of exchange quoted
on a selected date and may be rounded up or down. Any price indicated cannot be relied upon because the source or any relevant rate
of exchange may not be accurate or up to date. VAT and other taxes may be payable in addition to any price in respect of any property
according to the law applicable. © Knight Frank LLP 2019. All rights reserved. No part of this publication may be copied, disclosed or
transmitted in any form or by any means, electronic or otherwise, without prior written permission from Knight Frank LLP for the specific
form and content within which it appears. Each of the provisions set out in this notice shall only apply to the extent that any applicable
laws permit. Knight Frank LLP is a limited liability partnership registered in England with registered number OC305934 and trades as
Knight Frank. Our registered office is 55 Baker Street, London W1U 8AN, where you may look at a list of members’ names. Any person
described as a partner is a member, consultant or employee of Knight Frank LLP, not a partner in a partnership.You can also read


