Investor Presentation - Craig Meller, Chief Executive Officer - March 2018 - AMP
←
→
Page content transcription
If your browser does not render page correctly, please read the page content below

Investor Presentation
Craig Meller, Chief Executive Officer

March 2018
AMP – helping people own tomorrow

       Notes
       Fund Market Overview Retail – Marketer, Strategic Insight (Plan For Life), September 2017. Planner Numbers, Money Management Top 100 Dealer Groups, 2017.
       All data relates to FY17.

2 |
About AMP

  AMP is the leading wealth management company in Australia and New Zealand

  Key facts
  – Largest financial advice network in Australia and New Zealand – 3,277 aligned and employed financial advisers and planners
  – Around 4 million retail customers
  – More than A$257 billion in assets under management
  – Around 753,000 shareholders
  – 5,697 employees across Australia, New Zealand, Asia, United States, United Kingdom and Europe
  – Market capitalisation of A$15.4 billion as at 29 December 2017

  What sets us apart
  –   Trusted and respected brand
  –   Market-leading distribution strength and breadth
  –   Scale and market-leading cost efficiency
  –   Investment management capability
  –   Execution strength in transformational change, integration, project delivery and partnership management

3 |

Section 1
Financial overview

Executive summary

      Business performance
      – FY17 underlying profit of A$1,040m (FY16: A$486m) and net profit of A$848m (FY16: -A$344m)
      – Business recovery reflects stabilisation of wealth protection business and solid broader performance:
           – Growth momentum in AMP Capital and AMP Bank
           – Resilient performance in Australian wealth management; strong underlying growth trajectory emerging
           – Wealth protection business performing in line with expectations
           – Sustained focus on cost management and operational efficiency
      – Underlying Return on Equity (RoE) 14.3%

  Strategy
  Delivery on key drivers of strategy:
  Manage for value
  – Executed comprehensive Australian reinsurance program releasing capital
  – Well progressed with portfolio review of the manage for value businesses with all alternatives being considered. As a result, in discussions with a number of
  interested parties
  – Portfolio review yet to be concluded but expect to provide an update at or before AGM
  Invest to grow: continued investment, repositioning for growth
  Leverage strengths to drive new growth: growing relationships with China Life and MUFG: Trust Bank, new partnerships with United Capital and PCCP

  Capital and dividend
  – Strong capital position with surplus of A$2.3b over MRR, benefiting from reinsurance program
  – Potential for capital management initiatives will be considered at conclusion of portfolio review; update to be provided at or before AGM
  – Final dividend 14.5 cents a share, franked to 90% bringing total FY17 dividend to 29 cents a share. DRP neutralised with shares bought on market

5 |
FY17 profit summary

       A$m                                                  FY 17   FY 16      %

       Australian wealth management                          391     401      (2.5)

       AMP Capital¹                                          156     144       8.3

       AMP Bank                                              140     120      16.7

       Australian wealth protection                          110    (415)      n/a

       New Zealand financial services                        125     126      (0.8)

       Australian mature                                     150     151      (0.7)

       BU operating earnings                                1,072    527     103.4

       Group Office costs                                    (74)   (104)     28.8

       Total operating earnings                              998     423     135.9

       Underlying investment income¹                          95     122     (22.1)

       Interest expense on corporate debt                    (53)    (59)     10.2

       Underlying profit                                    1,040    486     114.0

       Other items                                           (21)     (9)   (133.3)

       Portfolio review and related costs                    (24)       -      n/a

       Business efficiency program costs                        -    (19)      n/a

       Amortisation of AXA acquired intangible assets¹       (80)    (77)     (3.9)

       Goodwill impairment                                      -   (668)      n/a
       Profit before market adjustments and accounting
                                                             915    (287)      n/a     Notes
       mismatches
                                                                                       1. AMP Capital is 15% owned by
       Market adjustments¹                                   (53)    (43)    (23.3)       MUFG: Trust Bank (formerly
                                                                                          MUTB). AMP Capital results, and
       Accounting mismatches                                 (14)    (14)          -      any other impacted line items, are
                                                                                          shown net of minority interests.
       Profit attributable to shareholders of AMP Limited    848    (344)      n/a

6 |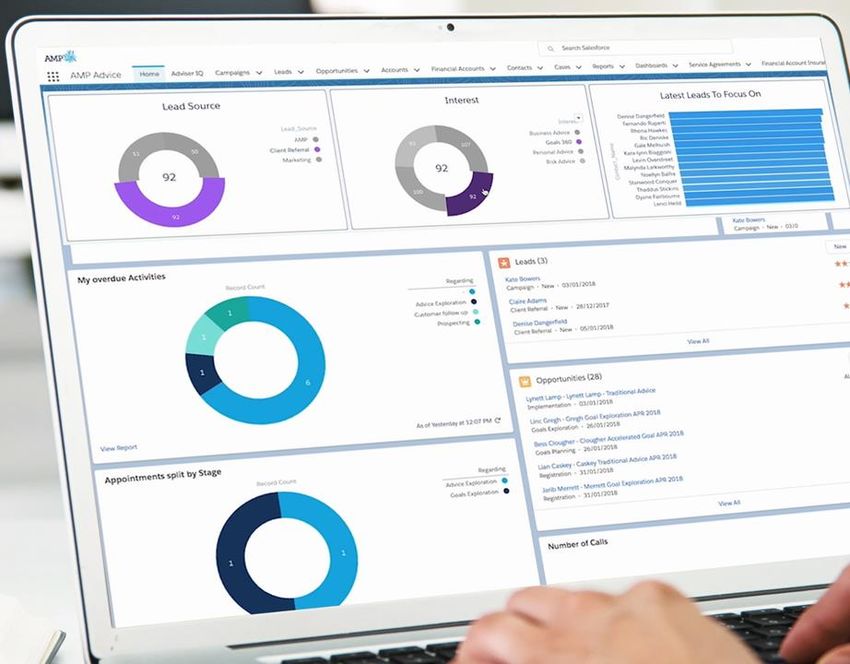
Delivering on strategy in 2017

      2017 objective                                    Delivered in 2017

      3% controllable cost reduction (ex AMP Capital)   – Group controllable costs ex AMP Capital reduced 3% in FY 17

      Grow new sources of revenue in Australian         – Other revenue grew 10% to A$108m
      wealth management via Advice and SMSF
                                                        – Invested A$40m in practice equity and client registers in 2H 17

      5% annualised margin compression over             – Margin guidance achieved with FY 17 margins of 101 bps
      18 months to FY 17

      Accelerate international expansion                – Expanded distribution footprint and significant raisings into global infrastructure platform
                                                        – 46% increase in direct international institutional clients to 291
                                                        – 24.9% stake in PCCP; immediately accretive
                                                        – Partnership with United Capital

      Stabilise Australian wealth protection business   – Implemented second tranche of reinsurance releasing A$548m
                                                          of capital to the group
                                                        – Performance in line with expectations

7 |
AMP – a balanced, diversified business
Contribution of business units
to FY 17 operating earnings
Risk
insurance AMP Bank
10% 13%
Mature
14%
AUM-driven businesses
represented 51% of total FY 17
New Zealand Wealth Mgt BU operating earnings
12% 36%
Asset Mgt
15%
8 |Australian superannuation & pension market (A$3.3 trillion)1
Projected superannuation assets (2014 – 2035)
– Australia is the 4th largest global pension
market2 with US$1.6 trillion in assets
– Australian wealth management sector
remains highly attractive with the size of the
superannuation market projected to double
by 20263
– Over the past decade, Australia’s pension
market increased at a CAGR of 7.1%
(global pension market CAGR of 5.6%)2
– Australia’s pension market is dominated by
defined contribution, accounting for
87% of total assets2
– Government mandated employer
contributions set to rise from 9.5% to 12% of
wages as a stepped increase by 2025
Source: APRA and Deloitte Actuaries and Consultants, 2015
Notes
1. ABS Managed Funds Industry – Sept 2017
2. Willis Towers Watson – Global Pension Assets Study 2018
3. Dynamics of the Australian Superannuation System - The next 20 years: 2015-2035, Deloitte Actuaries & Consultants, November 2015
9 |AMP – Ranked first or second in key market segments
Superannuation - Accumulation1 Superannuation - Pensions1 Retail life insurance1
AMP AMP
Other 18% 16%
25% AMP
25%
Other Other
36% 38%
NAB NAB
12% 14%
ANZ
7%
NAB
WBC 18% WBC
CBA
12% 19% 10%
CBA TAL
13% ANZ 12%
7% WBC ANZ
8% 10%
Notes
1. Strategic Insights – September 2017
10 |Australian financial planners1
– Of the Top 100 Dealer 2017 2016
Groups, AMP has the
largest overall planner
footprint representing 19%
AMP
of the total market AMP
19%
21%
– Ongoing planner
Other
consolidation across the 39%
Other
market expected to continue; 41%
driven by changing regulatory NAB NAB
landscape and scale 9% 10%
efficiencies
– Baby boomers nearing CBA CBA
retirement in increasing 10% IOOF 11%
IOOF
numbers driving increased WBC 5% WBC
6% ANZ ANZ
demand for advice 7% 7% 7%
7%
Notes
1. Money Market Dealer Group Survey – September 2017 and October 2016
11 |AMP’s advice network
– 99% retention of core Mortgage AUM per
As at December 2017 Target market Advisers Total AUM ($b)
licensee adviser practices consultants1 adviser ($m)
– 2.9% decline in core licensee AMP Advice Goals-based 221 24 10 44
advisers from 1H 17; largely
due to exits relating to change AMP Financial Planning2 1,442 445 64 45
in buyer of last resort terms;
Core
no material impact on
Charter Financial Planning licensee 712 40 23 32
productivity and profitability offer
– Focus on increased Hillross 317 23 15 46
productivity and profitability
across advice practices; Total (core licensees) – 2,692 532 112 41
average AUM per adviser in
core licensees up 8% to Self licensed
Jigsaw3 134 0 1 8
A$41m on FY 16
SMSF Advice Accountants 41 0 n/a n/a
Total (licensee services) – 175 0 1 6
Notes
1. Also includes 379 mortgage consultants included as advisers.
2. Includes AMP Direct and Horizons.
3. Jigsaw does not include AMP Authorised Representatives.
4. AMP adopts ASIC’s definition of an Authorised Representative.
12 |AMP’s growth businesses
AMP Australian Wealth Management AMP Capital AMP Bank
13 |AMP’s value businesses
Australian Wealth Protection Australian Mature New Zealand financial services
(Life Insurance)
14 |Section 2 Financial overview
Financial overview – disciplined cost management

   Sustained focus on tight cost management; 10 per cent nominal reduction in operating costs

       – Operating costs have reduced by 10%        A$m
         over the past five years, recycling most     983      984                                           981
                                                                                967                                                             949
         of these savings into project
         investments which have increased 67%
         over the same period
       – Delivered approximately A$300m of
         pre-tax run-rate cost savings over last
         five years through targeted efficiency
         programs whilst continuing disciplined                870              851                          858                                812
                                                      901
         investment for growth
       – Reaffirmed controllable cost guidance in
         FY18 at A$950m; maintaining
         investment across business lines
       – Objective to continue delivering flat
         costs over the medium term with cost
                                                               114              116                          123                                137
         efficiencies funding growth initiatives          82

                                                      2013     2014             2015                        2016                    2017
                                                                      Project costs, ex. AMP Capital           Operating costs, ex. AMP Capital

                                                                                            Notes
                                                                                            1. 2016 costs exclude the impact of restructure costs and variable remuneration.

16 |
Financial overview – capital position
Maintaining strong capital position
– Strongly capitalised with eligible capital above A$m
MRR of A$2.3b 1,040
– A$1bn capital released from reinsurance over
last 18 months, utilised for: 548
– A$200m share buyback
145 (118)
(75)
– A$120m of strategic M&A for AMP Capital (837) (112)
(200) (248)
– A$100m supporting strong growth in AMP
Bank
– A$90m investment in advice register and
practice equity
2,195 2,340 2,338
– The balance, after allowing for market impacts
and other, remains available as surplus
– Decision to retain surplus capital at this time
pending completion of portfolio review, whilst
maintaining the capacity to invest in growth
Market impacts
Other
FY16 proforma
AMP Capital M&A
FY16
FY17
Reinsurance
Business growth
Life company merger
Underlying profit
Dividends
Share buyback
businesses where opportunity arises
– Potential for capital management initiatives will
be considered at conclusion of portfolio review;
update to be provided at or before AGM
17 |Financial overview – Level 3 Eligible Capital above MRR 18 |
Financial overview – dividend

   Returning profits to shareholders - gross dividends up 34% over five years

       Final 2017 dividend of 14.5 cents                       Dividends (cents per share)*
       a share, franked to 90%                                   34% growth in dividends

       – Full year dividend of 29 cents
         a share, 3.6% up year on year, within
         target 70%-90% payout range
       – Since demutualisation in 1998,
         AMP has paid out over A$14.4b                                                                                                11.2
                                                                        10.5                          10.8
         to shareholders including:
                                                        8.4
          – over A$12.2b in dividends and over
            A$2.2b in capital returns            6.9

       – Ordinary share buy back of A$200m
         completed in 2017, ordinary shares
                                                                                                                                      29.0
         on issue now the lowest since 1H 13            26.0
                                                                        28.0                          28.0
                                                 23.0
       – Dividend Reinvestment Plan (DRP)
         remains in place for eligible
         shareholders. No discount will apply
         to the DRP allocation price             2013   2014            2015                          2016                            2017

       – Since 2014 AMP has neutralised the
         impact of the DRP by acquiring shares                                                                 Dividend           Franking credit
         on market to satisfy any entitlements
                                                                           Notes
         under the DRP
                                                                           * Grossed up value at respective franking %, assuming Australian tax resident.

19 |
Financial overview – Underlying EPS and RoE 20 |
Section 3
Strategy
AMP strategy

22 |
Delivering on strategy – key initiatives

       Strategic    Tilt investment to higher          Customer-centred                     Expand internationally              Manage costs across
       objectives   growth businesses                  transformation of core                                                   the group
                                                       Australian businesses

       Portfolio    – Manage for value and             – Invest to grow                     – Leverage strengths to drive new   – Tight focus on cost
       strategy       capital efficiency                                                      growth                              management

       Progress     – Portfolio review of              – Implementation of goals-based      – Strong growth in Chinese          – 3% controllable costs reduction
       in 2017        manage for value                   operating system                     joint ventures                      (ex AMP Capital)
                      businesses                       – Additional 10% revenue             – AMP Capital: 46%                  – AMP Capital cost to income
                    – Reinsurance program                growth in Advice and SMSF            increase in international           ratio 61.5 %; at lower end
                      releasing capital                – A$40 million investment in           institutional clients to 291        of range
                    – 14.3% underlying RoE               practice equity and client         – PCCP partnership
                                                         registers in 2H17
                                                                                            – United Capital partnership
                                                       – Combined NPS increased
                                                         by 11 points

       Growth       – 15% underlying RoE               – 5% revenue growth through the      – Double digit earnings             – Flat costs (ex AMP Capital)
       ambitions                                         cycle in wealth management           growth of AMP Capital             – AMP Capital: maintain cost
                                                         including new growth from            over medium term                    to income ratio of 60-65%
                                                         Advice and SMSF                    – China: A$50 million operating
                                                       – Double value of the Bank by          earnings contribution per
                                                         FY 21 via earnings and dividends     annum
                                                                                              by FY21

                                             Unrelenting focus on customer, cost, capital and culture

23 |
Driving new economics in wealth management
Targeting 5% revenue growth through the cycle from 2018 in normal markets
Growth as % of
average AUM
Investment markets +8%
Customer fees -1%
Margin compression -4%
Targeting growth in other revenue from Advice and SMSF
Net cashflow +2%
equivalent to 2% AUM fees to offset potential pressure on
margin compression and/or net cashflows in 2018
Other revenue 0%
Growth 5%
@ 45% cost to income1 x1.8
Annual operating earnings growth 9%
Notes
Figures reflect back-tested actuals 2012– 2017 (rounded)
1. Actual FY16 cost to income ratio: 45%
24 |Delivering on strategy – Goals-based advice
– Highly differentiated
goals-based advice
experience
– Places customer
in control
– Blends interactive
technology and
human coaching
– Tangibly demonstrates
value of advice
25 |Delivering on strategy – Goals-based advice
– Unique and elegant
client experience
– Real time probability-based
modelling demonstrates
goal achievability
– Material improvement
in SOA production time,
reduces cost to serve
– Compliance and record
keeping by design
– 30 AMP Advice locations;
over 200 advisers
– Further technology
releases in 2018
– Scale roll-out to aligned
advisers in 2019
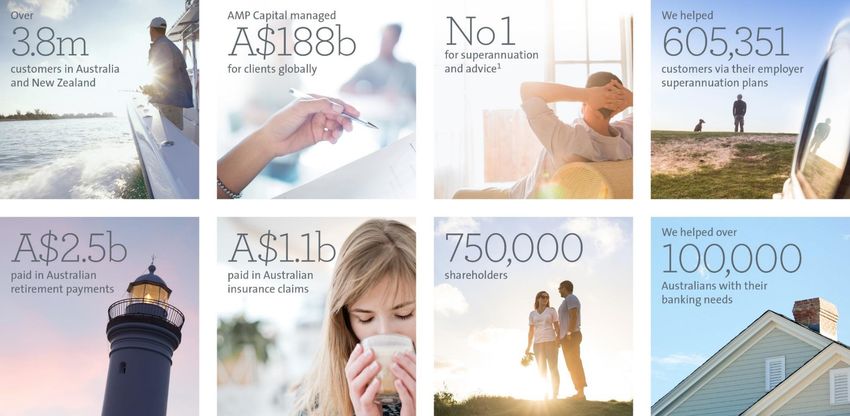
26 |Delivering on strategy – Goals-based advice
Salesforce solution
– Integration with Goals 360
and selected financial
planning tools to support
all aligned practices
– Leading edge CRM
capability
– Full practice management
automation significantly
improves practice efficiency
– Integrated to AMP’s
systems for seamless
data/process flow
– Delivers enhanced MIS
capability to advice
practices
– Compliance by design
– First phase of release
scheduled for 1H 18
27 |Driving revenue growth in wealth management – Advice
Delivering advice margin to wealth management and improving productivity
Client register purchases Equity investment in advice practices
Strategy Buy and retain client registers within AMP Strategy Strategic equity investments (typically 20-49%) in appropriately
identified advice practices
Rationale Expands AMP’s participation across the advice value chain,
Rationale Allows AMP to invest and participate alongside AMP aligned
delivering:
advice practices, delivering:
1. Advice margin to Australian wealth management
1. Advice margin to Australian wealth management
2. Ability to activate & engage inactive clients
2. Equity financing to advice practices with growth ambitions
3. Improved compliance controls
3. Improved practice efficiency by utilising AMP’s expertise
Acquisition 3-4x recurring practice revenues
multiple
Acquisition Around 5-6x practice EBITDA
multiple
Revenue Advice margin received on a fee for service basis or
grandfathered commission business Revenue Equity accounted share of profits
Targeted cost 15-20%
to income ratio Targeted RoE 12-14% excluding potential capital valuation uplift over time
(post tax)
Targeted RoE Approximately 15%
(post tax)
Client Existing aligned advice practice supported by AMP
Client servicing Face to face advice for clients with more complex needs; direct
servicing
servicing for customers requiring simple advice solutions
28 |AMP Capital – international growth
Global Partnerships China Life AMP Asset Management (CLAMP)¹
AUM grew 59% in local currency terms to RMB 183.3b (A$36.0b)
Launched 25 new products year-to-date including separately managed accounts, diversified, equity and fixed income funds
Fastest growing new funds management company in China – 1 million retail investors
Business profitable and continues to perform ahead of expectations
China Life Pension Company (CLPC)²
AUM grew 41% in local currency terms to RMB 531.0b (A$104.3b)
No.1 in trustee services (32% market share) and No.3 in investment management (11% market share) by AUM as at Q3 2017
Positioned well for launch of the Occupational Pensions tender for China’s 40 million civil servants; 12% salary contributions to lead to
eventual annual industry flows of up to A$40b
MUFG: Trust Bank and other distributors – Japan
Managing A$6.0b for clients in Japan
MUFG: Trust Bank business alliance offers 11 retail and three institutional funds, with A$1.2b in FUM. Raised commitments of A$1.5b
across a large number of Japanese institutional clients since the launch of AMP Capital’s Global Infrastructure Fund and Infrastructure
Debt series. This includes A$0.6b raised for IDF III in FY17
Global Investment Ongoing growth in infrastructure, with IDF III final close raising US$2.5b for the mezzanine debt strategy, an additional US$800m in co-
Management investment rights and securing a further US$800m from investors who want access to our deal origination capabilities
Managing A$22b for international investors; includes A$12b for 291 direct international institutional clients
Investment in US real estate investment manager PCCP in December 2017; complements Asian distribution strategy
A$5b Australian property development program attracting strong support from international and domestic investors
Development of Quay Quarter Tower is set to commence in 2018 subject to final conditions precedent being delivered; forecast
completion of Quay Quarter 2021
Owner approvals have now progressed well with major redevelopment at WA shopping centres Garden City, Booragoon and
Karrinyup; projects are on track for early 2018 commencement subject to final conditions precedent being delivered
29 |Appendix
AMP Group Leadership Team

31 |
Our history

       AMP and the National Mutual Life Association (which became AXA) were founded on similar principles, with financial advice at the heart
       of both businesses. While the two companies began their operations independently, they joined forces in 2011

         The Australian Mutual         The National Mutual Life       The iconic AMP                  AMP demutualises and         AMP and
         Provident Society             Association of Australasia     building in Circular            lists on the Australian      AXA Asia Pacific
         opens for business            opens for business             Quay is opened                  Stock Exchange               join forces

         1849                          1869                           1962                            1998                         2011

                         1860                          1899                            1995                           1995                        2013
                         Benjamin Short                James Tuscon                    National Mutual                National Mutual             AXA integration
                         joins AMP as its              Thompson joins National         demutualises and               is renamed                  completed, new
                         first agent                   Mutual as its first agent       lists on the Australian        AXA Asia Pacific            strategy launched
                                                                                       Stock Exchange

32 |
Sponsored ADR Program
AMP Limited maintains a sponsored Level 1 ADR program in the US
The ADRs trade on the over-the-counter market in the US (OTC Markets)
ADR program details are as follows:
Ticker symbol: AMLYY
CUSIP: 0017EP202
Ratio: 1 ADR: 4 Ordinary Shares
ADR depositary: Deutsche Bank
Share price information: www.otcmarkets.com or www.adr.db.com
Please contact the Deutsche Bank’s dedicated ADR broker desks:
Michael Tompkins (New York) Sven Haase (London) Xiaole Zhao (Hong Kong)
Tel: +1 212 250 1809 Tel: +44 20 754 58661 Tel: +852 22037854
Email: michael-p.tompkins@db.com Email: sven.haase@db.com Email: xiaole.zhao@db.com
33 |Important disclaimer Forward-looking statements in this presentation are based on AMP’s current views and assumptions and involve known and unknown risks and uncertainties, many of which are beyond AMP’s control and could cause actual results, performance or events to differ materially from those expressed or implied. These forward-looking statements are not guarantees or representations of future performance, and should not be relied upon as such. AMP undertakes no obligation to update any forward-looking statement to reflect events or circumstances after the date of this presentation, subject to disclosure requirements applicable to AMP. Information and statements in this presentation do not constitute investment advice or a recommendation in relation to AMP or any product or service offered by AMP or any of its subsidiaries and should not be relied upon for this purpose. Prior to making a decision in relation to AMP’s securities, products or services, investors or potential investors should consider their own investment objectives, financial situation and needs and obtain professional advice. 34 |
You can also read