Digital transformation - why do some significant banks fall behind? - why do some significant banks fall ...
←
→
Page content transcription
If your browser does not render page correctly, please read the page content below
IN-DEPTH ANALYSIS
Requested by the ECON committee

 Digital
 transformation - why
 do some significant
 banks fall behind?

 External authors:
 Ata Can BERTAY
 Harry HUIZINGA

 Economic Governance Support Unit (EGOV)
 Directorate-General for Internal Policies EN
 PE 689.440 - June 2021
IPOL | Economic Governance Support Unit

 2 PE 689.440
Digital transformation - why do some significant banks fall behind?

 Digital
 transformation - why
 do some significant
 banks fall behind?

 Abstract
 This paper shows that larger banks and better capitalised banks
 invest more in computer software. These findings could reflect
 that larger banks can attain greater benefits from computer
 software and that better capitalised banks have more resources
 to make larger software investments. All the same, smaller and
 less capitalised banks will also have to make substantial software
 investments to maintain sustainable businesses, something that
 supervisors will need to point that out to these banks.
 This document was provided by the Economic Governance
 Support Unit at the request of the ECON Committee.

PE 689.440 3
IPOL | Economic Governance Support Unit

This document was requested by the European Parliament's Committee on Economic and Monetary
Affairs.

AUTHORS
Ata Can BERTAY, Sabanci University
Harry HUIZINGA, Tilburg University

ADMINISTRATOR RESPONSIBLE
Marcel MAGNUS
Rebecca SEGALL

EDITORIAL ASSISTANT
Donella BOLDI

LINGUISTIC VERSIONS
Original: EN

ABOUT THE EDITOR
The Economic Governance Support Unit provides in-house and external expertise to support EP
committees and other parliamentary bodies in shaping legislation and exercising democratic scrutiny
over EU internal policies.

To contact Economic Governance Support Unit or to subscribe to its newsletter please write to:
Economic Governance Support Unit
European Parliament
B-1047 Brussels
E-mail: egov@ep.europa.eu

Manuscript completed in June 2021
© European Union, 2021

This document and other supporting analyses are available on the internet at:
http://www.europarl.europa.eu/supporting-analyses

DISCLAIMER AND COPYRIGHT
The opinions expressed in this document are the sole responsibility of the authors and do not
necessarily represent the official position of the European Parliament.
Reproduction and translation for non-commercial purposes are authorised, provided the source is
acknowledged and the European Parliament is given prior notice and sent a copy.

 4 PE 689.440
Digital transformation - why do some significant banks fall behind?

CONTENTS
LIST OF ABBREVIATIONS 6
LIST OF FIGURES 7
LIST OF TABLES 7
EXECUTIVE SUMMARY 8
1. INTRODUCTION 9
2. DATA ON IT SPENDING AND CYBERATTACKS FROM THE ECB 11
3. AN ANALYSIS OF THE OWNERSHIP OF COMPUTER SOFTWARE BY SSM BANKS 13
4. CYBER RISK AS A SOURCE OF SYSTEMIC RISK AND THE NEED FOR MACROPRUDENTIAL
 SUPERVISION 19
5. CONCLUSION 20
REFERENCES 21
ANNEX 22

PE 689.440 5
IPOL | Economic Governance Support Unit

LIST OF ABBREVIATIONS
 BHC Bank Holding Company

 EBA European Banking Authority

 ECB European Central Bank

 ESRB European Systemic Risk Board

 IAS International Accounting Standard

 ICT Information and Communication Technology

 IFRS International Financial Reporting Standards

 IT Information Technology

 ROA Return on assets

 SREP Supervisory Review and Evaluation Process

 SSM Single Supervisory Mechanism

 6 PE 689.440
Digital transformation - why do some significant banks fall behind?

LIST OF FIGURES
Figure 1: Split of cyber incidents in 2019 and 2020 by type 11
Figure 2: Successful cyberattacks by institution versus ratios of IT expenses 12
Figure 3: Distribution of IT costs as a share of total operating income 12
Figure 4: Histogram of computer software over assets 14
Figure 5: Trend in computer software over assets of SSM banks 14
Figure 6: Bank types and computer software over assets 15
Figure 7: Scatterplots of computer software over assets with selected bank variables 15

LIST OF TABLES
Table 1: Computer software over assets at SSM banks and COVID-19 18

PE 689.440 7
IPOL | Economic Governance Support Unit

EXECUTIVE SUMMARY
In recent years, banks have become increasingly digitalised, as they rely on information technology (IT)
to deliver financial services to their customers and to automate internal processes. The digital
transformation poses two main risks to the banking sector. First, banks that transform too slowly may
be unable to compete effectively with more digitalised competitors, which implies that their business
models are ultimately unsustainable. Second, a heavy reliance on IT introduces the risk of IT
malfunctions, which can occur accidentally or as a result of malicious intent.
In its presentation of the Supervisory Review and Evaluation Process results for 2020, the European
Central Bank notes that IT costs appear to be on the low side, with approximately one in five banks
spending less than 3% of their total operating income on IT costs in the first three quarters of 2020.
Furthermore, the lowest share is recorded by diversified lenders, universal and investment banks.
To shed more light on which banks fall behind in the digital transformation, this paper examines banks’
ownership of computer software assets, which are recorded as an intangible asset on banks’ balance
sheets. Computer software assets include purchased software and internally developed software, thus
measuring a bank’s digital technology adoption and production. Our sample consists of 75 significant
institutions during the period 2005-2020. Average computer software over assets increased from
around 0.08% at the time of the Global Financial Crisis to a much higher level of around 0.2% during
2018-2020.
Empirically, we find that larger banks and better capitalised banks invest more in computer software
after controlling for variation in bank business models and bank specialisation indices. These findings
could reflect that larger banks can attain greater benefits from computer software and that better
capitalised banks have more resources to make larger software investments. All the same, smaller and
less capitalised banks will also have to make substantial software investments to maintain sustainable
businesses, and supervisors need to point that out to these banks. If in the end smaller and less
capitalised banks cannot make sufficient software investments, then they could consider merging with
larger and better capitalised rivals in order to advance in the digital transformation.

 8 PE 689.440
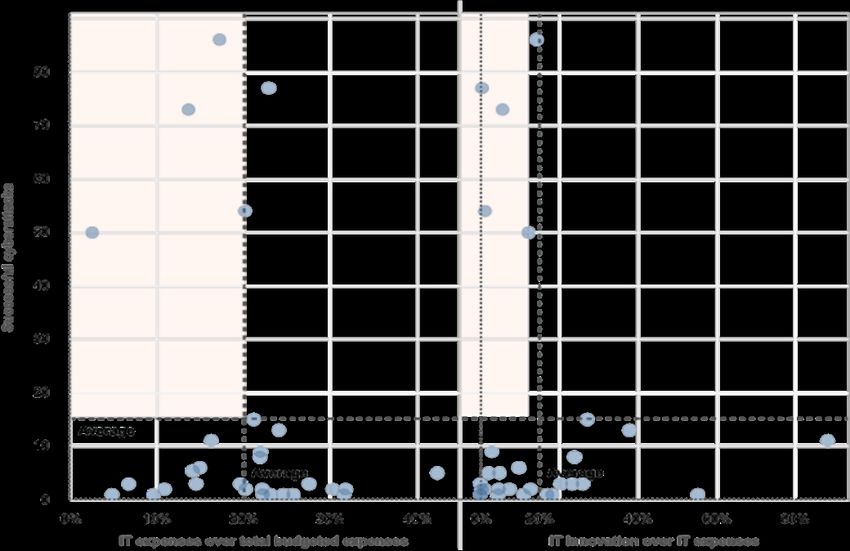
Digital transformation - why do some significant banks fall behind?

1. INTRODUCTION
In recent years, banks have become increasingly digitalised, as they rely on information technology (IT)
to deliver financial services to their customers and to automate internal processes. The digital
transformation poses two main risks to the banking sector. First, banks that transform too slowly may
be unable to compete effectively with more digitalised competitors, which implies that their business
models are ultimately unsustainable. Second, a heavy reliance on IT introduces the risk of some IT
malfunction, which can occur accidentally or because of malicious intent. In particular, cyberattacks
can generate operational losses for the directly affected financial institutions. In addition, they can
potentially trigger a systemic financial crisis if the effects of the cyberattack reverberate through the
financial system (see European Systemic Risk Board (ESRB), 2020).
In its presentation of the Supervisory Review and Evaluation Process (SREP) results for 2020, the
European Central Bank (ECB, 2021a, Chart 16) notes that IT costs appear to be on the low side, with
approximately one in five banks spending less than 3% of their total operating income on IT costs in
the first three quarters of 2020. Furthermore, the lowest share is recorded by diversified lenders,
universal and investment banks. 1
To shed more light on which banks fall behind in the digital transformation, we examine banks’
ownership of computer software assets, which are recorded as an intangible asset on banks’ balance
sheets. Computer software assets include purchased software and internally developed software, and
thus measure a bank’s digital technology adoption as well as production. Our sample consists of 75
Single Supervisory Mechanism (SSM) banks during the period 2005-2020. Average computer software
over assets increased from around 0.08% at the time of the Global Financial Crisis to a much higher
level of around 0.2% during 2018-2020.
Empirically, we find that larger banks and better capitalised banks invest more in computer software
after controlling for variation in bank business models and bank specialisation indices. These findings
could reflect that larger banks can attain greater benefits from computer software and that better
capitalised banks have more resources to make larger software investments. All the same, also smaller
and less capitalised banks will have to make substantial software investments to maintain sustainable
businesses, and supervisors need to point that out to these banks. If in the end smaller and less
capitalised banks cannot make sufficient software investments, then they could consider merging with
larger and better capitalised rivals in order to advance in the digital transformation.
In 2017, the European Banking Authority (EBA, 2017) issued its ‘Guidelines on the assessment of
Information and Communication Technology (ICT) risk under the SREP’, which provides a framework
for assessing ICT risks at individual banks. Following these guidelines, the ECB together with National
Competent Authorities developed an IT risk questionnaire to be completed by banks on an annual
basis. Last year the ECB (2020a) published the results of a horizontal analysis of the answers to this
questionnaire provided by significant institutions in the first quarter of 2019. This analysis reveals that
the number of successful cyberattacks at the bank level is negatively correlated with the ratio of IT
expenses to total budgeted expenses and with the ratio of IT innovation to IT expenses. 2 Thus, banks
with low IT expenses, and especially IT innovation expenses, appear to be more vulnerable to successful

1
 In the pragmatic 2020 SREP, the ECB maintained the same SREP scores as in the previous year, and hence this observation did not affect
2020 SREP scores. The data provided on qualitative SREP recommendations (ECB, 2021a, Chart 10) is not granular enough to see whether
the ECB issued any qualitative recommendations related to IT costs as part of the 2020 SREP.
2
 The definition of the ratio of IT innovation to IT expenses is not publicly available.

PE 689.440 9
IPOL | Economic Governance Support Unit

cyberattacks. For the current year, the ECB (2021b, Figure 1) identifies cybercrime and IT disruption as
a significant risk and IT deficiencies as a vulnerability requiring supervisory attention.
Several recent studies have considered how IT investments affect banks’ performance in a crisis
setting. 3 Using US data, Pierri and Timmer (2020) find that commercial banks with greater IT adoption,
measured as more personal computers per employee, before the Great Financial Crisis experienced
significantly lower non-performing loans when the crisis hit. Considering US banks at the time of the
COVID-19 pandemic, Dadoukis, Fiaschetti and Fusi (2021) show that banks that are high IT adopters,
indicated by a relatively high ratio of tech and communication expenses to total operating expenses,
performed better in terms of market returns and lending during the early phase of the pandemic. Along
similar lines, Kwan, Lin, Pursiainen and Tai (2021) demonstrate that US banks with a high IT capability,
proxied by the adoption of technologies useful for remote or virtual work or other online
communication, were better able to serve their customers during the pandemic, as indicated by larger
increases in website traffic and greater volumes of lending and deposit taking. Together, these studies
suggest that banks with higher IT investments can better weather a major economic shock, which
provides a rationale for relatively high IT investments by banks.
In the remainder, section 2 discusses some data on the prevalence of cyberattacks and the correlation
between IT spending and cyberattacks for significant institutions available from ECB publications.
Section 3 provides evidence on the determinants of investments in computer software by significant
institutions. Section 4 discusses cyber risk as a source of potential systemic risk and the need for
macroprudential supervision to mitigate this risk. Section 5 concludes.

3
 Beccalli (2007) finds that there is little relationship between banks’ overall IT investments and improved profitability or efficiency for a
sample of European banks over the period 1995-2000.

 10 PE 689.440
Digital transformation - why do some significant banks fall behind?

2. DATA ON IT SPENDING AND CYBERATTACKS FROM THE ECB
This section reviews some data on the prevalence of cyberattacks and the potential link between
successful cyberattacks and IT spending available from ECB publications.
In 2017, the ECB adopted a cyber incident reporting framework that requires all banks that are
supervised by the ECB to report significant cyber incidents on a confidential basis immediately after
they have been detected. Figure 1 provides data on the types and numbers of cyber incidents reported
by significant institutions in 2019 and 2020, showing an overall increase in 2020. The main types of
cyber incident are denial of service attacks (many service requests directed at a financial institution to
overwhelm its interface with customers), unauthorised access, and phishing (emails to bank employees
or customers soliciting confidential access information).
Figure 1: Split of cyber incidents in 2019 and 2020 by type

Reproduced from ECB (2021c, Chart 3.8). Insider misuse is international misuse of access rights by an insider.

Based on answers to the ECB’s IT risk questionnaire, Figure 2 shows negative relationships between the
number of successful cyberattacks at the bank level and a bank’s ratio of IT expenses to total budgeted
expenses as well as its ratio of IT innovation over IT expenses. Thus, higher IT expenses, and especially
IT innovation expenses, appear to be useful to protect against cyberattacks.4

4
 Note that the negative relationships are only apparent if we consider the full sample of banks, but not if we consider the subsamples
where either IT expense ratio is below its average. This suggests IT spending needs to be above average to have a negative effect on the
occurrence of successful cyberattacks.

PE 689.440 11
IPOL | Economic Governance Support Unit

Figure 2: Successful cyberattacks by institution versus ratios of IT expenses
(reference year 2018; excluding banks with no successful cyberattacks)

Reproduced from ECB (2020a, Chart 12).

Banks tend to spend on IT rather unevenly. This is shown by Figure 3, which provides information on
the distribution of IT costs as a share of total operating income for significant institutions, collected by
the ECB in the course of the 2020 SREP. IT costs as a share of income are seen to be below 3% for the
bottom quintile of significant institutions, while they are equal to or above 15% for the top decile. The
revealed dispersion of IT costs potentially reflects that banks tend to implement different business
models that require varying IT intensifies. Thus, a wide variation in banks’ IT costs by itself does not
imply that some banks spend too little on IT. To inform on this issue, one needs to analyse the
determinants of banks’ digitalisation efforts, including variation in their business models. We do this in
the next section.

Figure 3: Distribution of IT costs as a share of total operating income

Reproduced from ECB (2021a, Chart 16) as based on supervisory data with reference date Q3 2020.
Y-axis indicates the % of significant institutions out of the full sample, which is made up of 105 significant institutions for
which an SREP 2020 assessment was conducted and data are available.

 12 PE 689.440
Digital transformation - why do some significant banks fall behind?

3. AN ANALYSIS OF THE OWNERSHIP OF COMPUTER SOFTWARE
 BY SSM BANKS
The academic literature on IT adoption by banks tends to use technology expenses (and possibly
communication expenses) to capture banks’ reliance on IT. 5 In this section, we instead focus on an
alternative measure of IT adoption by banks: banks’ ownership of computer software assets (relative to
total assets). 6 This measure captures banks’ cumulative investment in computer software, which brings
identifiable economic benefits. Empirically, we relate this measure of IT adoption to indices of a bank’s
size, its business model, and its capitalisation in order to see which banks appear to lag behind. Our
sample consists of 75 SSM banks during the period 2005-2020. The data are taken from Moody's
Analytics BankFocus.
European banks’ accounting recognition of computer software assets should be a good measure of
banks’ digital technology adoption and production. 7 According to International Accounting Standard
(IAS) 38 as part of the International Financial Reporting Standards (IFRS), banks are required to
recognise an intangible asset if it meets specific criteria. In particular, an intangible asset should be
identifiable (i.e., it should be separable and transferable, and its costs should be measurable), and the
bank should have control over the intangible asset so that it can create future economic benefits by
increasing revenues or reducing costs.8 Intangible assets mostly have finite lives, and they generally
are amortised over their lifetime. Computer software assets, recognised as intangible assets, include
purchased software and internally developed software. Thus, computer software assets measure a
bank’s digital technology adoption and production, representing software used explicitly by banks to
generate economic benefits.9
Computer software constitutes more than 60% of intangible assets for the group of SSM banks. The
average value of computer software over total assets in the sample is 0.14%, whereas its median is
0.08%. In absolute terms, the value of computer software varies considerably, from 3.5 million euros at
the 10th percentile of the distribution to 682 million euros at the 90th percentile. Figure 4 shows a
histogram of computer software over assets for the SSM banks that shows a considerable dispersion.

5
 See, for example, Dadoukis, Fiaschetti and Fusi (2021). Pierri and Timmer (2020) instead use a hardware measure of IT adoption (personal
computers per employee), showing that this measure is correlated with the IT budget per employee and the adoption of cloud computing.
6
 Data on computer software can be a complement to data on technology expenses. Data on technology expenses are not available from
BankFocus for a sufficient number of banks. Hence, we are not able to compare these measures of IT adoption.
7
 Sahut et al. (2011) show that IFRS provide better information regarding intangible assets for European listed companies in comparison to
local GAAP.
8
 See https://www.iasplus.com/en/standards/ias/ias38 for details.
9
 In contrast, operating systems as part of hardware are included in hardware costs.

PE 689.440 13
IPOL | Economic Governance Support Unit

Figure 4: Histogram of computer software over assets
 150 250
 200
 Frequency
 100 50
 0

 0 .2 .4 .6 .8 1
 Computer software over assets (%)

Figure 5 shows the time trend of software assets over total assets during the last 15 years. Average
computer software over assets increased from around 0.08% during the Global Financial Crisis to a
much higher level of around 0.2% during 2018-2020. In 2020, the average software assets over total
assets declined slightly, probably on account of the pandemic.

Figure 5: Trend in computer software over assets of SSM banks
 .25
 Computer software over assets (%)
 .1 .15.05 .2

 11
 06

 07

 08

 09

 10

 12

 13

 14

 15

 16

 17

 18

 19

 20
 20
 20

 20

 20

 20

 20

 20

 20

 20

 20

 20

 20

 20

 20

 20

 Year

The figure shows average computer software over assets for banks with available data over time. The trend is similar in the
case of asset-weighted averages or a balanced sample.

Using the information on bank specialisations from BankFocus, Figure 6 shows how computer software
over assets varies for different types of bank. Bank holding companies, in particular, have average
computer software over assets of 0.186%, whereas commercial banks and cooperative banks have
averages of around 0.15%. 10 Computer software over assets for the remainder category (including, for
example, real estate and mortgage banks and savings banks) is 0.085%.

10
 Similarly, financial holdings and credit institutions following the SSM definition have average computer software over assets of 0.24% and
0.12%, respectively.

 14 PE 689.440
Digital transformation - why do some significant banks fall behind?

Figure 6: Bank types and computer software over assets
 .2
 Computer software over assets (%)
 .05 .1 0 .15

 BHC Commercial bank Cooperative bank Other

BHC is a bank holding company. The other category includes financial institutions such as real estate and mortgage banks,
savings banks and specialised governmental credit institutions.

Before turning to the regression analysis, we present three simple scatterplots that relate values of
computer software to assets to the ratios of equity to assets, loans to assets and customer deposits to
assets, respectively (Figures 7A,B,C). The ratio of equity to asset is a measure of bank capitalisation,
while the ratios of loans to asset and customer deposits to assets are indices of a bank’s business
orientation. Computer software over assets is shown to be positively associated with equity over asset
(Figure 7A). This association is potentially worrying, as it suggests that weakly capitalised banks are
lagging behind in their IT adoption. Computer software over assets is further positively associated with
loans over assets and customer deposits over assets (Figures 7B and 7C). Thus, banks with a greater
focus on serving loan and deposit customers are shown to have progressed farther in their IT adoption
as measured by computer software ownership, which probably reflects that these customers are
increasingly served through digital platforms.
Figure 7: Scatterplots of computer software over assets with selected bank variables
A: Equity over assets
 .8
 Computer software over assets (%)
 .2 .4 0 .6

 0 .05 .1 .15
 Equity over assets

PE 689.440 15
IPOL | Economic Governance Support Unit

B: Loans over assets
 .8
 Computer software over assets (%)
 .2 .4 0 .6

 0 .2 .4 .6 .8
 Loans over assets

C: Customer deposits over assets
 .8
 Computer software over assets (%)
 .2 .40 .6

 0 .2 .4 .6 .8
 Customer deposits over assets

All variables in these scatterplots are trimmed at 1% and 99% to exclude outliers. Relationships without trimming are similar.
A similar relationship also arises if equity over assets is replaced by tangible equity over tangible assets.

Next, we estimate the relationship between computer software over assets with various indices of bank
size, business model and capitalisation.11 We use the following specification:
 ,
 = ∗ + + 1 ln( ) , −1 + 2 , −1
 + 3 , −1 + 4 , −1 + 5 , −1
 + ,

11
 See the Annex for variable definitions and summary statistics.

 16 PE 689.440
Digital transformation - why do some significant banks fall behind?

The dependent variable is Computer software over assetsi,t for bank i in year t. Among the explanatory
variables, ln(Total assets)i,t-1 is the natural logarithm of total assets, which proxies for bank size. Bank
capitalisationi,t-1 is a bank capitalisation variable (either equity over assets, tangible equity over tangible
assets, or the regulatory total capital ratio). Loans over assetsi,t-1 and Customer deposits over assetsi,t-1
capture a bank’s orientation towards the traditional banking activities of lending and deposit taking.
ROAi,t-1 is a bank’s return on assets, calculated as pre-tax profits divided by total assets.12 We include
bank specialisation fixed effects, , that correspond to the banking categories represented in Figure
6. 13 Finally, the econometric specification includes country-year fixed effects, ∗ , capturing time
varying differences at the country level, which could be significant as our sample period includes the
Global Financial Crisis, the European sovereign debt crisis, and the COVID-19 pandemic.
Regression 1 in Table 1 includes equity over assets to capture bank capitalisation. In this regression,
computer software over assets varies positively with the bank size variable, which implies that
computer software rises more than proportionately with total assets as bank size increases. While this
makes sense as larger banks can benefit more from any software purchase or development, this result
potentially also spells trouble for smaller banks that apparently do not keep up in the digital
transformation. Customer deposits over assets enters the regression positively, as taking deposits
nowadays is an IT-intensive activity. Equity over assets is also positive in the regression. The estimated
relation between software over assets and equity over assets is economically meaningful. Specifcally,
a one standard deviation increase in equity over assets (3.3%) implies an increase in software over
assets of 0.05%, which is 34% of its standard deviation. From a supervisory perspective, it could be
problematic that weakly capitalised banks invest less in computer software, as underinvestment in
computer software by weakly capitalised banks could make their business models unsustainable.
In regression 2, we replace equity over assets with tangible equity over tangible assets (excluding
intangible assets from both equity and assets) to prevent any mechanical relationship between
computer software valuation and reported bank equity. The estimated coefficient for tangible equity
over tangible assets is smaller than the coefficient for equity over assets in regression 1, but it is
statistically significant. In regression 3, we replace equity over assets with the regulatory total capital
ratio, which is not significantly correlated with computer software.
We also explore if any of the documented relationships changed during the COVID-19 period. In
particular, we include interaction terms of all the explanatory variables with a dummy variable for the
year 2020 in regressions 1-3, with the results reported as regressions 4-6. We find a stronger relationship
between software over assets and bank size in 2020 than before. Furthermore, there was a more
positive relationship between software over assets and loan over assets in 2020, perhaps because the
pandemic forced additional lending activity to be conducted digitally.
In summary, we find that larger banks and better capitalised banks invest more in computer software
after controlling for variation in bank business models and bank specialisation indices. These findings
could reflect that (1) larger banks can attain greater benefits from computer software as any additional
software can be applied to more voluminous banking activities for a given cost of the additional
software and that (2) better capitalised banks have more resources to make larger software
investments. All the same, also smaller and less capitalised banks will have to make substantial software
investments to maintain sustainable businesses, and supervisors need to point that out to these banks.
If, in the end, smaller and less capitalised banks cannot make sufficient software investments, then
merging with larger and better capitalised rivals could offer a good way forward.

12
 The dependent variable is in percentages whereas all explanatory variables are in ratios. All explanatory variables are lagged by one year.
13
 Bank specialisation fixed effects are not reported in Table 1, as they are not significant.

PE 689.440 17
IPOL | Economic Governance Support Unit

Table 1: Computer software over assets at SSM banks and COVID-19
 (1) (2) (3) (4) (5) (6)
VARIABLES Computer software over assets (%)

ln(Total assets) 0.041*** 0.039*** 0.038*** 0.039*** 0.037*** 0.035***
 (0.013) (0.014) (0.014) (0.013) (0.013) (0.013)
Loans over assets 0.073 0.064 0.110 0.056 0.046 0.084
 (0.064) (0.064) (0.073) (0.060) (0.061) (0.067)
Customer deposits over
assets 0.096** 0.100** 0.132** 0.091** 0.095** 0.115**
 (0.043) (0.043) (0.054) (0.042) (0.041) (0.053)
Equity over assets 1.513*** 1.400***
 (0.529) (0.480)
Tangible equity over tangible
assets 1.357** 1.268**
 (0.543) (0.495)
Total capital ratio 0.110 0.091
 (0.081) (0.078)
ROA -1.008 -0.728 0.479 -0.859 -0.617 0.520
 (0.941) (0.918) (0.898) (0.885) (0.860) (0.818)
ln(Total assets)*Year2020 0.042** 0.045** 0.040*
 (0.018) (0.020) (0.024)
Loans over assets*Year2020 0.339** 0.393** 0.413**
 (0.159) (0.161) (0.197)
Customer deposits over
assets*Year2020 -0.110 -0.100 0.054
 (0.101) (0.105) (0.154)
Equity over assets*Year2020 1.331
 (1.469)
Tangible equity over tangible 0.978
assets*Year2020 (1.479)
Total capital ratio*Year2020 0.202
 (0.404)
ROA*Year2020 -12.951 -12.400 -7.697
 (8.933) (8.840) (8.077)

Observations 655 655 596 655 655 596
R-squared 0.625 0.616 0.621 0.634 0.625 0.629
Country*Year FE Yes Yes Yes Yes Yes Yes
Bank type FE Yes Yes Yes Yes Yes Yes
*, **, and *** denote significance at the 10%, 5%, and 1%.

 18 PE 689.440
Digital transformation - why do some significant banks fall behind?

4. CYBER RISK AS A SOURCE OF SYSTEMIC RISK AND THE NEED
 FOR MACROPRUDENTIAL SUPERVISION
According to the ESRB (2020, p. 2), cyber risk is characterised by three features that set it apart from
other sources of operational risk: the speed of its propagation, the scale of its propagation, and the
potential intent of threat actors. These cyber risk characteristics give rise to the possibility that a cyber
incident, caused by, say, insufficient IT investment, evolves into a systemic financial crisis. The ESRB
offers a conceptual model of how this can happen. For a system crisis to happen, there needs to be an
amplification of the impact on the directly affected institutions towards the broader financial system.
The initial shock, for instance, could be amplified, if it leads to a dysfunctional interbank money market
or a bank run by depositors. In addition, amplification is more likely if the cyber incident erodes wider
trust in the financial system. With sufficient amplification, banks can no longer provide credit, and a
systemic financial crisis has materialised. The ESRB sketches the example of how a systemic financial
crisis could evolve after the malicious destruction of account balance data at a large bank.14
As pointed out by Kashyap and Wetherit (2019), the appropriate regulatory and supervisory response
to cyber risk needs to consider that cyber risk, unlike most other forms of operational risk, can entail
strong negative externalities, potentially triggering a systemic crisis. These authors, in particular,
identify the need for a macroprudential approach to cyber risk, recognising that similar cyber risks at
individual banks can jointly create systemic risk. To identify potential common vulnerabilities, the
authors recommend carrying out cyber stress tests. As a follow-up to such stress testing, supervisors
could encourage firms to avoid common vulnerabilities, for instance by diversifying financial
infrastructure or software choices.
The EBA (2019) has issued ‘Guidelines on ICT security and risk management’, which establish
requirements for financial institutions regarding the management of ICT security and the mitigation of
related risks. These guidelines are pertinent to individual banks, and thus microprudential rather than
macroprudential. 15 By default, the development of macroprudential policy to deal with cyber risk is left
to the supervisor, or potentially to a consortium of internationally collaborating supervisors. In
particular, the ECB could develop a macroprudential policy to deal with cyber risk at significant
institutions and clarify to what extent it is at present implementing such a policy. 16

14
 Danielsson, Fouché, and Macrae (2016) are sceptical whether cyber risk can generate a systemic financial crisis. In particular, they argue
that a cyberattack is unlikely to lead to a fall of confidence that is systemic and that only the largest sovereign states have sufficient
resources to maliciously cause a systemic crisis.
15
 Similarly, the approach to defining and assessing IT risks in ECB (2020a) is microprudential.
16
 In recent articles on cyber risk in its supervision newsletter, the ECB (2019a, 2019b, 2020b) did not address the possibility of taking a
macroprudential approach to cyber risk.

PE 689.440 19
IPOL | Economic Governance Support Unit

5. CONCLUSION
In its presentation of the Supervisory Review and Evaluation Process (SREP) results for 2020, the
European Central Bank (ECB, 2021a, Chart 16) notes that IT costs appear to be on the low side, with
approximately one in five banks spending less than 3% of their total operating income on IT costs in
the first three quarters of 2020.
To shed light on which banks fall behind in the digital transformation, this paper examines banks’
ownership of computer software assets, which are recorded as an intangible asset on banks’ balance
sheets. Computer software assets include purchased software and internally developed software, and
thus measure a bank’s digital technology adoption as well as production. Our sample consists of 75
Single Supervisory Mechanism (SSM) banks during the period 2005-2020.
Empirically, we find that larger banks and better capitalised banks invest more in computer software
after controlling for variation in bank business models and bank specialisation indices. These findings
could reflect that larger banks can attain greater benefits from computer software and that better
capitalised banks have more resources to make larger software investments. All the same, also smaller
and less capitalised banks will have to make substantial software investments to maintain sustainable
businesses, and supervisors need to point that out to these banks. If, in the end, smaller and less
capitalised banks cannot make sufficient software investments, then they could consider merging with
larger and better capitalised rivals in order to advance in the digital transformation.
A macroprudential approach to cyber risk recognises that similar cyber risks at individual banks can
jointly create systemic risk, for instance, if many banks are dependent on the same software. The
development of macroprudential policy to deal with cyber risk appears to be the domain of the
supervisor. Given this circumstance, the ECB could enunciate a macroprudential policy to deal with
cyber risk at significant institutions and clarify to what extent it is currently implementing such a policy.

Potential questions:
Q1: Do you think that small banks are more at risk from cyber attacks (given they tend to invest less)?
Q2: When assessing cyber risk at significant institutions, does the ECB only take a microprudential
approach or also a macroprudential approach?

 20 PE 689.440
Digital transformation - why do some significant banks fall behind?

REFERENCES
• Beccalli, E., 2007, Does IT investment improve bank performance? Evidence from Europe, Journal
 of Banking and Finance 31, 2205-2230.
• Dadoukis, A., M. Fiaschetti, and G. Fusi, 2021, IT adoption and bank performance during the COVID-
 19 pandemic, forthcoming in Economics Letters.
• Danielsson, J., M. Fouché, and R. Macrae, 2016, Cyber risk as systemic risk, VoxEU column.
• European Banking Authority, 2017 , Guidelines on ICT risk assessment under the Supervisory
 Review and Evaluation Process (SREP).
• European Banking Authority, 2019, Guidelines on ICT and security risk management.
• European Central Bank, 2019a, IT and cyber risk – the SSM perspective, Supervision Newsletter,
 February.
• European Central Bank, 2019b, The need for improved cyber resilience in euro area banks,
 Supervision Newsletter, May.
• European Central Bank, 2020a, Annual report on the outcome of the SREP IT Risk Questionnaire –
 Feedback to the industry.
• European Central Bank, 2020b, Guarding against IT and cyber risk, Supervision Newsletter, May.
• European Central Bank, 2021a, 2020 SREP aggregate results.
• European Central Bank, 2021b, ECB Banking Supervision: Assessments of risks and vulnerabilities
 for 2021.
• European Central Bank, 2021c, Financial stability review, May.
• European Systemic Risk Board, 2020, Systemic cyber risk.
• Kashyap, A., and A. Wetherilt, 2019, Some principles for regulating cyber risk, AEA Papers and
 Proceedings 109, 482-87.
• Kwan, A., C. Lin, V. Pursiainen, and M. Tai, 2021, Stress testing banks’ digital capabilities: Evidence
 from the COVID-19 pandemic, working paper, University of Hong Kong.
• Pierri, N., and Y. Timmer, 2020, Tech in Fin before FinTech: Blessing or curse for financial stability?,
 IMF WP/20/14.
• Sahut, J., S. Boulerne, and F. Teulon, 2011, Do IFRS provide better information about intangibles in
 Europe?, Review of Accounting and Finance 10.

PE 689.440 21
IPOL | Economic Governance Support Unit

ANNEX
Table A1: Variable descriptions

 Variable Description
 Computer software over assets (%) Computer software net of accumulated amortisation and
 impairment divided by total assets in percentages
 ln(Total assets) Natural logarithm of total assets in thousands of euros
 Loans over assets Gross loans divided by total assets
 Customer deposits over assets Customer deposits divided by total assets
 Equity over assets Equity over total assets
 Tangible equity over tangible assets Equity minus intangible assets (including goodwill) divided
 by assets minus intangible assets
 Total capital ratio Regulatory capital divided by risk-weighted assets
 ROA Return on assets calculated as pre-tax profits divided by total
 assets

Table A2. Summary statistics
 Variable Obs Mean Std. dev. Min Max
 Computer software over assets (%) 655 0.137 0.149 0 0.950
 ln(Total assets) 655 18.185 1.665 13.583 21.635
 Loans over assets 655 0.530 0.195 0.000 0.931
 Customer deposits over assets 655 0.491 0.235 0.000 0.912
 Equity over assets 655 0.064 0.033 -0.039 0.292
 Tangible equity over tangible assets 655 0.060 0.032 -0.046 0.279
 Total capital ratio 621 0.181 0.104 -0.050 1.112
 ROA 655 0.003 0.014 -0.152 0.037
 Negative values of bank capitalisation variables occurred for some banks during the European sovereign debt crisis. The
 regression results are not sensitive to excluding capitalizations below 0 or above 1.

 22 PE 689.440
This paper shows that larger banks and better capitalised banks invest more in computer software.
 These findings could reflect that larger banks can attain greater benefits from computer software
 and that better capitalised banks have more resources to make larger software investments. All the
 same, smaller and less capitalised banks will also have to make substantial software investments to
 maintain sustainable businesses, something that supervisors will need to point that out to these
 banks.
 This document was provided by the Economic Governance Support Unit at the request of the ECON
 Committee.

PE 689.440
IP/A/ECON-BU/FWC/2020-003
Print ISBN 978-92-846-8316-1 | doi: 10.2861/82482 | QA-02-21-829-EN-C
PDF ISBN 978-92-846-8317-8| doi: 10.2861/65571 | QA-02-21-829-EN-N
You can also read