Student Investigations of Forces in a Roller Coaster Loop.
←
→
Page content transcription
If your browser does not render page correctly, please read the page content below
Student Investigations of Forces in a Roller Coaster
Loop.
              Ann-Marie Pendrill1,2
              1) Department of Physics, University of Gothenburg, SE 412 96 Göteborg, Sweden
              2) National Resource Centre for Physics Education, Lund University, Box 118, SE
              221 00 LUND, Sweden
              E-mail: Ann-Marie.Pendrill@fysik.lu.se

              Abstract. How does the experience of a riding in a roller coaster loop depend on
              your position in the train? This question has been investigated by first year engineering
              physics students, using multiple representations of force and motion. Theoretical
              considerations for a circular loop show that the differences between the forces on a rider
              in the front, middle or back of the train depend on the ratio between train length and
              radius of the loop, which can be estimated from a photograph. Numerical computations
              complement the analysis of a video clip, accelerometer data and measurements of time
              needed for the train to move over the highest point. A roller coaster ride gives striking
              examples of Newton’s laws applied to your own body, and demonstrates that the
              experience depends on the vector character of velocity and acceleration.

              PACS numbers: 01.40.gb, 45.20.D-

European Journal of Physics, 34 1379-1389 (2013)
http://iopscience.iop.org/0143-0807/34/6/1379/, doi:10.1088/0143-0807/34/6/1379

1. Introduction

Roller coaster queues are often longer for the front or back seat. How do the forces on
your body depend on your position in the train? This is one of the questions investigated
by students in an amusement park project during an introductory physics course. In
this paper, a train’s motion over the top (T) of a vertical roller coaster loop is analysed,
with examples of challenges taken on by students as extensions of the basic assignments.
     A vertical loop (figure 1) is the most basic of roller coaster inversions. The train
moves essentially in a vertical plane, upwards, over the top and down again, completing
a 360o rotation. At the top, the rider is upside down. Modern roller coaster loops are not
circles: Clothoids (Cornu spirals) and other mathematical curves have been introduced
to obtain a smaller radius of curvature at the top and to avoid the sudden onset of
large forces on the rider [1, 2, 3, 4]. In this paper, the word ”loop” will be used as a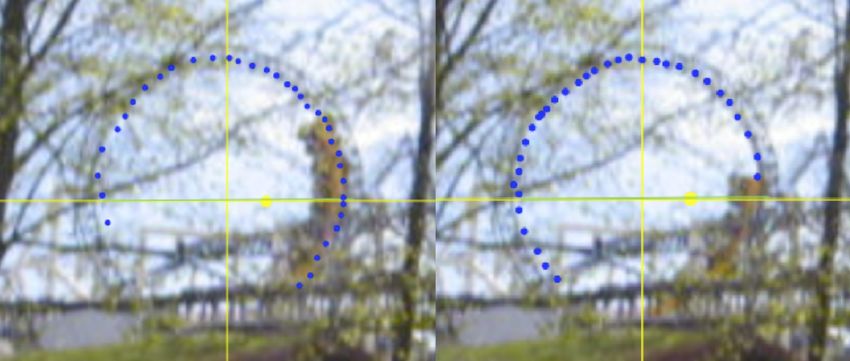
Student Investigations of Forces in a Roller Coaster Loop.                                          2

              Figure 1. A photo of the vertical loop in the Kanonen roller coaster at Liseberg,
              where the front of the train of length L has just reached the top at T. Also shown is an
              approximating circle with origin at O and radius R, and the angle α relating the train
              length, L, to the radius: L = 2Rα. The angle θ is introduced to describe the location
              of the middle of the train in relation to the highest point. The drawings represent the
              situation in the photo and also a later time when the train has passed the highest point
              and is moving with increasing speed and angular velocity. G marks the approximate
              location of the centre of mass of the train.

shorthand for a vertical roller coaster loop. The focus is on the upper part of the loop,
approximated by a circular arc.
      The examples are presented in some detail and are intended as inspiration and
support for teachers who want to use amusement park applications in their teaching.
The examples in this paper go beyond the initial observation that the speed will be
lowest as the middle of the train reaches T, since the centre of mass is highest at that
moment, whereas both the front and the end of the train will move faster at T, and thus
have a larger centripetal acceleration. Most results are presented in a form applicable
for any train length and radius of curvature of the track.
      Studying forces on riders in roller coasters and other amusement rides has been
part of an introductory course for engineering physics students at Chalmers during the
period 2005-2012. Typically 120 students started every year and were divided in groups
of about 6 students who were assigned parts of a roller coaster and one other ride.
Preparation and presentations were done in smaller segments of 30 students, where
the five groups had different assignments, including forces in a roller coaster loop. For
preparation the students were given the photo of the Kanonen roller coaster loop, shown
in figure 1, (although without annotations) and a few questions about forces in circular
loops together with some data from the technical drawing. As background material
they were also provided with a copy of an article about different shapes of roller coaster
loops [2] and more details about the ride [5, 6, 7] which opened in 2005. The students
were encouraged to suggest additional investigations. The amusement park visit took
place at the end of the third week of term. After the visit, students used the data and
assignments to practice newly acquired Matlab skills and to write a group report using
LATEX, to be read by an opposition group and presented 2-3 weeks after the visit.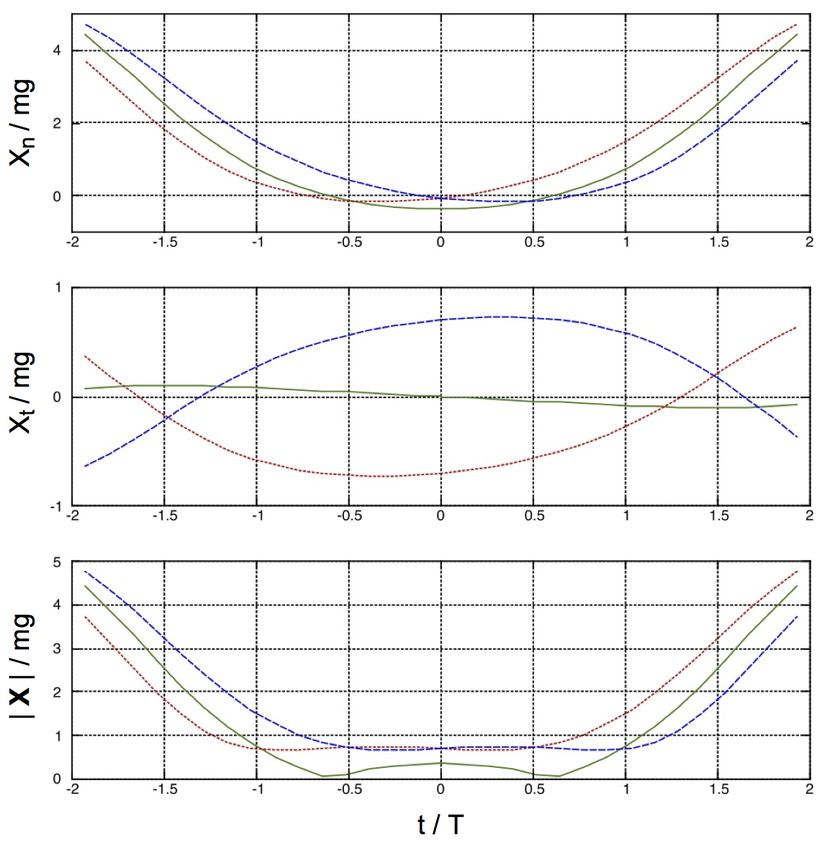
Student Investigations of Forces in a Roller Coaster Loop.                             3

     During the visit, students could used their phones to measure the time needed for
the train to pass the highest point, T. They could also take photos or video clips for
presentation and analysis. Of course, they had an opportunity to ride and experience
the forces. WDSS accelerometers [8] were available, including data vests to bring them
safely on the rides. (SmartPhone accelerometers and rotation sensors are useful for
smaller rides [9], but do not yet have sufficient range for large roller coasters.) A
couple of times, three students managed to bring three accelerometers simultaneously
in the front, middle and back of the same train. Data were then shared with all groups
studying the same roller coaster. In the case of a launched roller coaster, such as the
Kanonen [7, 10], the launch provides a well-defined time stamp to bring data from all
accelerometers into a single graph, enabling comparisons between the forces experienced
by riders in different positions ([10, 11]).
     Accelerometer data, time measurements and analyses of photos and videos obtained
during the visit, as well as the authentic experiences of the body, can be complemented
with the results from a theoretical analysis of the motion represented in a number of
different ways, as discussed below. For the analyses in this paper, sideways motions and
energy losses have been neglected.

2. Energy conservation and forces on a train in a vertical roller coaster loop

2.1. Short train on a circular track
As an introduction, it is useful to approximate the train with a point particle, moving
without energy losses on a circular track with radius R and passing the top at elevation
R with speed v0 . Conversion between potential and kinetic energy gives
              vθ2 = v0 2 + 2gR(1 − cos θ)                                             (1)
where vθ is the speed at elevation R cos θ. Students may need some prompting to see
that the mass is not needed for this analysis: When only gravity changes the speed of
the train, the mass does not affect the motion, according to the principle of equivalence
between gravitational and inertial mass.
     After the train has reached the highest point, the speed increases again. For a very
short train, the tangential acceleration is given by
              aθ = Rθ̈ = g sin θ
giving
                   g
              θ̈ =   sin θ                                                            (2)
                   R
The force from the track on a short roller coaster train, and the force from the train on
the rider, can be approximated by normal forces alone (except in lift hills, launches or
brakes). As we shall see below, this is not a good approximation of forces on a rider in
the back or front of a longer train.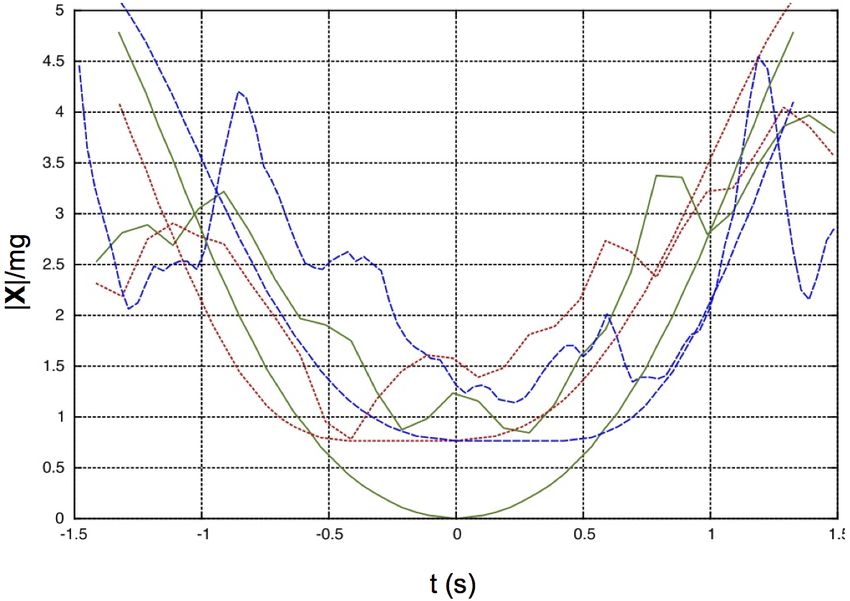
Student Investigations of Forces in a Roller Coaster Loop. 4
2.2. Energy considerations and centre of mass for an extended train
Consider a train of length L, approximated by a circular arc with radius R and angle
2α, where L = 2Rα (Figure 1). The centre of mass is located a distance
RZα sin α
dcm = cos φdφ = R
2α −α α
from the centre of the circle. This is the also elevation of the centre of mass when the
train is in the highest position. In the position in the photo where the front has just
reached the top, the centre of mass is lower, at
sin 2α
hcm = R
2α
Thus, the centre of mass rises a distance
sin α sin 2α
∆h = dcm − hcm = R ( − ). (3)
α 2α
This leads to a difference in centripetal acceleration at the top between a rider in the
middle and a rider in the front or back of the train.
v2 ∆h sin 2α sin α
∆( ) = −2g = 2g( − ). (4)
R R 2α α
(Students can be encouraged to try a series expansion for small angles, and also to
discover how a graph of this function can be obtained in Wolfram Alpha [12], by typing
e.g. ”2sina/a-sin(2a)/a, a from -pi/2 to pi/2” into the search window.) In the case of
Kanonen, α ≈ π/4, giving ∆(v 2 /R) ≈ 0.5g. From this analysis we conclude that the
normal force on the rider at the top differs by about 0.5mg at the top, depending on
position in the train. E.g., if a rider in the front or back of the train is pushed downward
at the top of the loop by a force of 0.3mg from the seat, a rider in the middle will instead
be pushed upwards with a force of 0.2mg from the shoulder restraints (”negative g”).
Longer trains (larger α) of course lead to even larger differences. For long trains the
rider also experiences forces in the direction of the track, as discussed in section 3.2.
3. A long train passing the top of a circular roller coaster loop
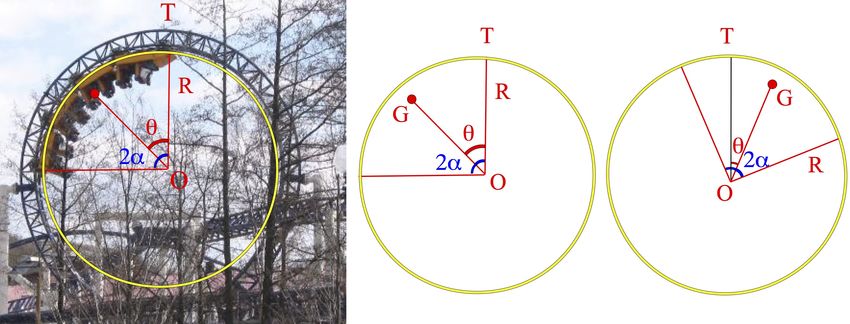
How fast does the train move during different parts of the ride? Figure 2 shows an
analysis of the motion of the train from a short video clip, used in combination with
the Logger Pro software [13]. Below, we consider the equation of motion for the train,
analysing the forces on the rider in different situations. A numerical solution of the
equation of motion gives the time dependence of the location of the train, which is
compared to results from video analysis, accelerometers and time measurements.
3.1. Equations of motion for a roller coasters train on a circular track
After the middle of the train has passed the top, the tangential component of gravity
causes an increase of train speed. The tangential acceleration of the train can be
obtained by considering the time derivative of the angular momentum, L = mRv,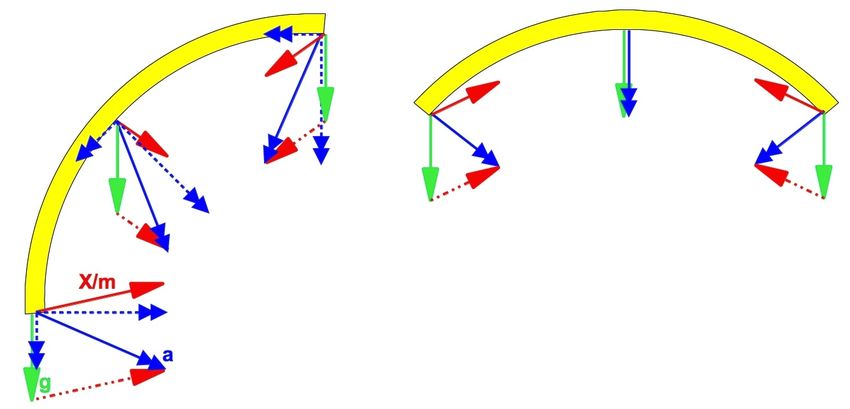
Student Investigations of Forces in a Roller Coaster Loop.                                        5

              Figure 2. Frame by frame video analysis of the motion of the front (left) and back
              (right) of the train. Dots were inserted manually for each frame by identifying the
              front or back of the train in the video clip, using the LoggerPro3 software [13]. Note
              how the sequence of dots finish at the front or back end of the train.

where m is the mass of the train. Since all parts of the train are moving along the
circle, orthogonal to the radius, the magnitude of the angular momentum can simply
be written as
              L = mR2 θ̇                                                                        (5)
The rate of change in angular momentum can be obtained as L̇ = τ , where, τ is the
torque exerted by gravity, giving
                        2     mR Z θ+α
               L̇ = mR θ̈ =            g sin φdφ                                      (6)
                              2α θ−α
This gives
                    g cos(θ − α) − cos(θ + α)     g      sin α
               θ̈ =                            = sin θ                                (7)
                    R            2α               R        α
which is a modification of the equation (2) for short trains, with an additional factor
sin α/α.
     From these expressions we can also express the force, X, from the train on the rider
in different parts of the train. Applying Newton’s second law gives mg + X = ma, i.e.
X/m = a − g. Figure 3 shows free-body diagrams for a rider in the front, middle and
back of the train and for two different train positions.
     Eq. (7) can be solved numerically to obtain a description of the motion. In figure 4,
the position has been marked with crosses for positions at constant time intervals. (We
                                                                     √
chose the speed for the middle of the train at the top to be v0 = gR, corresponding
to a centripetal acceleration of g, making the rider weightless at the top.) These can be
compared to the frame by frame video analysis shown in figure 2.
     The numerical solution can also be used to compare the time development of the
components of the motion for the different positions, as shown in figure 5.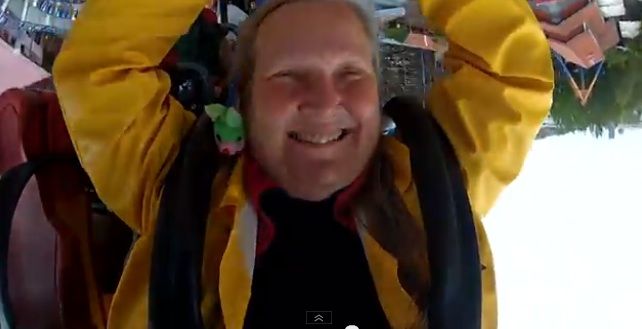
Student Investigations of Forces in a Roller Coaster Loop.                                            6

              Figure 3. Free-body diagrams of the forces on a rider in the front, middle and back of
              a roller coaster train. The picture to the left shows the situation where the front of the
              train is just reaching the top. The picture to the right shows the middle of the train
              at the highest point. Single arrows mark forces, with gravity always downwards. The
              acceleration is marked with lines with double arrows and the tangential and normal
              components of the acceleration are indicated with dashed lines. The force from the
              train on the rider, expressed as X/m = (a − g), is constructed (dashed line) to satisfy
              Newton’s second law: mg + X = ma. The speed is chosen to make a rider in the
              middle of the train weightless at the top.

              Figure 4. The position of the front, middle and back of the train with marks at
              equal time intervals. The motion of the middle of the train was obtained by numerical
              integration of equation (7), giving the angle as a function of time. The corresponding
              positions for the front and back were obtained by adding or subtracting the angle
              α = L/2R. The sequence of dots finish at at the same time, but at different positions
              in the train for the three graphs, for comparison with the results from the frame by
              frame analysis shown in figure 2.

     The time dependence of angle for the middle of the train makes it possible to work
out how the speed as well as centripetal and tangential accelerations vary with time.
At any given time, these are the same for the whole train, but the different angular
positions for the different parts of the train leads to differences when combined with the
gravitational force, as shown in figure 3. Below, we discuss the resulting accelerometer
graphs for long trains.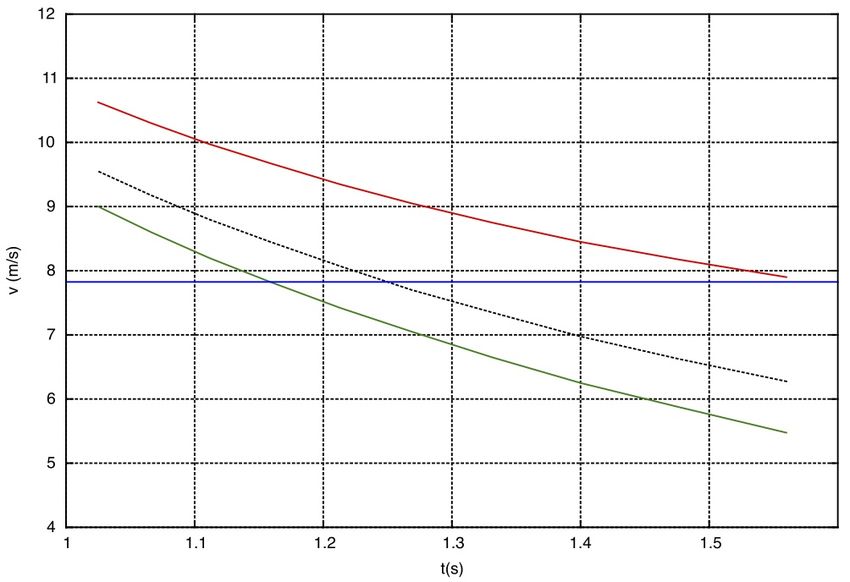
Student Investigations of Forces in a Roller Coaster Loop.                                          7

              Figure 5. Time dependence of the horizontal (x) and vertical (y) positions for the
              front, middle and back of the train (the dotted, solid and dashed curves, respectively).
              The positions are expressed in dimensionless quantitiesp x/R and y/R and the time in
              terms of the dimensionless quantity t/T where T = R/g and t = 0 corresponds to
              the time when the middle of the train passes the highest point.

3.2. Accelerometer graphs for different positions in the train
In spite of their name, accelerometers do not measure acceleration, but the ”g force”, or
more precisely, components of the vector (a − g), often presented in the unit g. If the
accelerometer is aligned according to conventions for amusement rides, the z component
is directed up from the seat, along the spine of the rider, measuring the normal force
Xn /m. The x component should be in the direction of motion, measuring the tangential
force, Xt /m. For a short train, the tangential acceleration is equal to the tangential
component of the acceleration of gravity, and only the normal component of X will be
non-zero. For a longer train, there will be a small upwards tangential component even
for the middle of the train: Xt = mg sin θ(1 − sin α/α), in the direction of motion as
the train moves upwards, and opposing the motion on the way down. For the front and
back of the train, the differences will be larger, Xt = mg(sin(θ ± α) − sin α/α). The
normal force on a rider in the middle of the train is given by
                       v02                 sin α
              Xn = m(      + 2g(1 − cos θ)       ).
                       R                     α
For the front and back, we get instead
                         v02                 sin α
              Xn = m(        + 2g(1 − cos θ)       + g cos(θ ± α)).
                         R                     α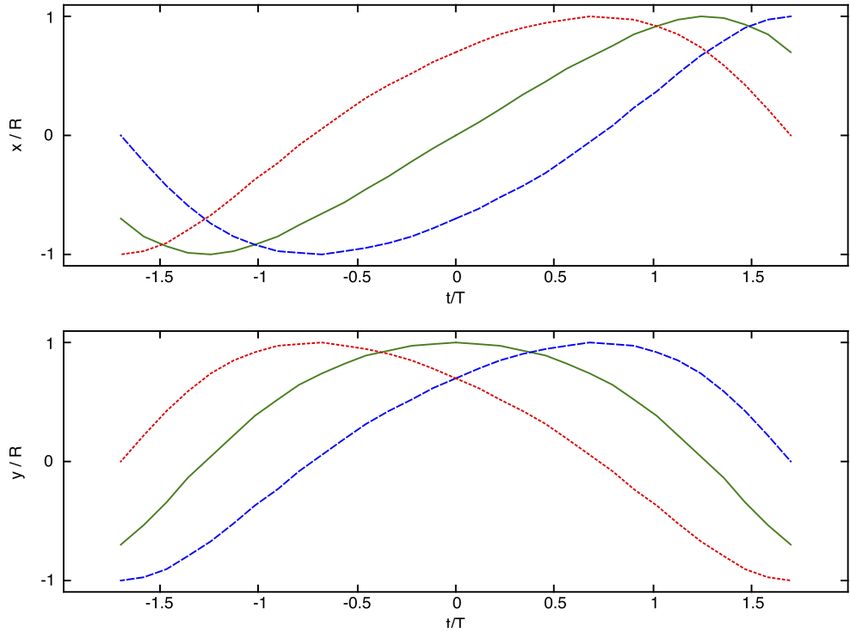
Student Investigations of Forces in a Roller Coaster Loop.                                           8

              Figure 6. Time dependence of the force X from the train on the rider, divided by the
              force of gravity, mg. The normal component Xn is defined as positive in the direction
              from the seat towards the head of the rider and the tangential force, Xt , is positive in
              the direction of motion. The third graph shows the absolute value, |X|/mg.
                                                                                   p         The time
              has been expressed in terms of the dimensionless quantity T = t/ R/g. The solid
              curve corresponds to the middle of the train, whereas the dotted and dashed curves
              give the forces for riders in the front and back of the train. The speed at the top for
                                                                   √
              the middle of the train was chosen to be v0 = 0.8 gR, resulting in ”negative g” on
              the top.

as shown in figure 3 for two different positions.
     Perfect alignment of accelerometers taken on a ride is not easily accomplished.
Sometimes, the dominating z component from a reasonably aligned accelerometer
includes most of the interesting information. Alternatively, the absolute value |X|/m
can be evaluated, although this obviously hides any ”negative g”, that may be visible in
the z component. Figure 6 shows the theoretical values for the tangential and normal
forces for a rider in different part of a train passing over the top of the loop, as well as
the absolute value.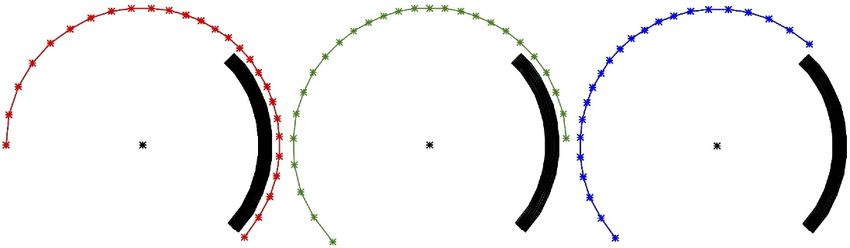
Student Investigations of Forces in a Roller Coaster Loop.                                        9

              Figure 7. The relation between the speed and the time, t, taken for the Kanonen
              train to move over the top of the loop. The lowest curve shows the speed in the middle
              of the train. The upper curve shows the speed when the front or back of the train
              passes the highest point. The dotted curve in the middle shows the average speed,
              L/t, during the passage. The horizontal line marks the speed which gives a centripetal
              acceleration equal to g, taking the radius to be 2L/π, where L = 9.784m.

     The results above are presented in a form that could be used with any loop, where
the train covers about 90o of a circular arc. The equations are, of course, valid for any
train length.
     In the next section we compare theoretical results with observations and data for
the Kanonen roller coaster.

3.3. On the top of the Kanonen loop
By measuring the time, t, needed for the train to move over the top, an estimate
of the speed can be obtained if the train length, L, is known or measured. For the
Kanonen train, L = 9.784m. All students in a group have been asked to bring out their
mobile phones and measure t. Working out averages and standard deviations, they may
also consider if they can detect any possible difference between the trains, within their
measurement uncertainty. The groups typically get average times, t, between 1.1s and
1.2s, giving speeds, L/t ≈ 8.5m/s = 31km/h, consistent with data from the technical
                                                           √
drawing. The speed required for weightlessness, v0 = gR can be estimated using
R ≈ L/π/2 = 6.2m, giving v0 ≈ 7.8m/s.
     Apart from uncertainties in the timing, the resulting speed will be an average,
overestimating the speed for the middle of the train and an underestimating the speed
Student Investigations of Forces in a Roller Coaster Loop. 10
Figure 8. Experimental and theoretical data for the total force on the rider from
the train passing the loop in Kanonen, in the front (dotted), middle (solid) or back
(dashed) of the train. Vibrations in the roller coaster train leads to considerable noise
in the experimental data.
for the front and back. A few of the student groups who were assigned the Kanonen
ride took on the additional challenge of working out how the measured time, t, can be
converted to a value for the speed of the middle of the train at the highest point. Figure
7 shows the relation between the time, t, and the actual speed of a rider in the middle
of a train. For comparison, we have also included the average speed L/t, as well as the
speed for the front or back of the train, obtained by inserting the expression (3) for ∆h
giving
s
2 sin α 2 sin α
vend = vmiddle + 2gR( − ).
α 2α
From the graph in figure 7 we note that a time of 1.2s to move over the top corresponds
to a speed too low for weightlessness in the middle of the train, leading to ”negative g”,
whereas 1.1s gives a centripetal acceleration larger than g at all times.
Forces on the rider can be measured with accelerometers taken on the ride. Figure
8 shows accelerometer data taken by three students in September 2012, riding front,
middle back on the same Kanonen train. The launch at the start provides a well
defined time for synchronization. Theoretical accelerometer values have been included
for comparison. The rapidly varying motions in roller coasters cause measured data to
be quite noisy, as can be seen from the graphs. Discerning the relevant differences is
not always easy. To know the feeling as your body experiences the near-weightlessness
at the top of the loop you have to go on the ride and compare the different positions.Student Investigations of Forces in a Roller Coaster Loop. 11
4. Results and Discussion
A photo of a roller coaster loop combined with a knowledge of the length of the train
offers many possibilities for investigations of forces, even before riding. The mass of
the train is not needed for the equations of motion in the loop, as long as energy losses
are neglected. The analysis of forces on a rider shows that weightlessness can only
be obtained in the middle of the train. Although loops offer particular simplification
through the approximate circular shape, similar investigations can be extended to other
roller coaster elements. Different ways to investigate the motion offer a number of
qualitatively different representations. Marton and Booth [14] emphasize the importance
of this variation for the development of deeper understanding, transferrable to other
situations. Airey and Linder [15] have studied how students acquire a disciplinary
discourse involving a complex of representations, tools and activities of the discipline.
The engineering physics programme at Chalmers is highly competitive, and attracts
some of the best students leaving high school. The Force Concept Inventory [16, 17] has
been administered before the start of the course, and the cohorts then consistently score
around 80%. Post tests scores have been around 90%, corresponding to a normalized
gain of 50% [17, 18]. Other tests for this student group, administered in connection with
project presentations, have included comparisons between forces in a roller coaster loop
and in the classical Rainbow ride (with nearly uniform circular motion and weightless
riders on top) [19], requiring students to discern similarities and differences between the
two types of circular motion in a vertical plane. The follow-up of these questions leads
to many clarifying discussions and to new insights for many students.
Using roller coasters and other amusement rides in physics teaching brings an
enjoyable connection between the experiences of your own body, Newton’s laws and
motion in two and three dimensions, and contributes to a deeper student understanding
of the vector character of force, velocity and acceleration.
Acknowledgments
I gratefully acknowledge the continued support by Liseberg, including park access for
student projects. Special thanks go to Ulf Johansson, who also provided relevant data
from drawings and technical specifications. I would also like to thank the engineering
physics students and their supervisors at Chalmers, who have brought their enthusiasm,
curiosity and skills to the amusement park physics project.
References
[1] Schützmannsky K 2001, Roller Coaster - Der Achterbahn-Designer Werner Stengel, Kehrer-Verlag
Heidelberg
[2] Pendrill A-M 2005, Roller coaster loop shapes, Physics Education 43 517
[3] Nordmark A B and Essen H 2010, The comfortable roller coaster - on the shape of tracks with a
constant normal force, European Journal of Physics 31 1307Student Investigations of Forces in a Roller Coaster Loop. 12
[4] Fox News 2010, On Paper, the World’s Smoothest Roller Coaster Ride Inside Science
News 17 July 2010, http://www.foxnews.com/scitech/2010/07/17/paper-worlds-smoothest-
roller-coaster-ride/
[5] Marden D, Roller doaster data base, http://www.rcdb.com
[6] Peschel J, 2005, Kanonen - Great Firepower at Liseberg, Coasters and More,
http://www.coastersandmore.de/rides/kanonen/kanonen.shtml
[7] Pendrill A-M 2008, Acceleration in 1, 2, and 3 dimensions in launched roller coasters, Physics
Education 43 483-491
[8] Vernier, Wireless Dynamic Sensor System, http://www.vernier.com/products/sensors/wdss/
[9] Pendrill A-M and Rohlén J 2011, Acceleration and rotation in a pendulum ride, measured using
an iPhone 4, Physics Education 46 676
[10] Heintz V, Mårtensson Pendrill A-M, Schmitt A and Wendt K 2009, Achterbahn fahren im
Physikunterricht, Physik in unserer Zeit, 40:2 90-95
[11] Alberghi S, Foschi A, Pezzi G, and Ortolani F 2007, Is it more thrilling to ride at the front or the
back of a roller coaster?, The Physics Teacher 45 536-541.
[12] Wolfram Alpha, http://www.wolframalpha.com/
[13] Vernier, Logger Pro, http://www.vernier.com/products/software/lp/
[14] Marton F and Booth S 1997, Learning and awareness, Mahwah, New Jersey: Lawrence Erlbaum
Associates, Inc.
[15] Airey J and Linder C 2009, A disciplinary discourse perspective on university science learning:
Achieving fluency in a critical constellation of modes J. Res. Science Teaching, 46, 2749
[16] Hestenes D, Wells M and Swackhamer G 1992, Force Concept Inventory, Physics Teacher 30,
141-158.
[17] Hake R R 1998, Interactive-engagement vs traditional methods: A six-thousand-student survey of
mechanics test data for introductory physics courses, Am. J. Phys. 66, 64-74
[18] Pendrill A-M 2005, University and Engineering Physics Students’ Understanding of Force and
Acceleration - Can Amusement Park Physics Help?, Proc. 8th Nordic research symposium on
science education (Nordisk forskarsymposium om undervisning i naturfag), Aalborg, Maj 2005,
[19] Pendrill A-M 2008, Acceleration in school, in everyday life and in amusement parks, p 183-204, in
Science Education in the 21st Century, Hauppauge NY, Nova Science Publishers, Ed. Ingrid V.
Eriksson
Author
Ann-Marie Pendrill is professor of physics at University of Gothenburg with a
research background in computational atomic physics. Since 2009, she is also the
director of the Swedish National Resource Centre for Physics Education, hosted by Lund
university. She has arranged amusement park science days, and used examples from
playgrounds and amusement rides in the education of physics, teaching and engineering
students. She likes being upside down in roller coaster loops, rain or shine.Student Investigations of Forces in a Roller Coaster Loop. 13
This is an author-created uncopyedited version of an article accepted for publication
in Physics Education. IOP Publishing Ltd is not responsible for any errors or omissions
in this version of the manuscript or any version derived from it.You can also read