Simulations of a flexible 100 kWel PEM Fuel Cell power plant for the provision of grid balancing services
←
→
Page content transcription
If your browser does not render page correctly, please read the page content below
E3S Web of Conferences 238, 04003 (2021) https://doi.org/10.1051/e3sconf/202123804003
100RES 2020
Simulations of a flexible 100 kWel PEM Fuel Cell power plant for
the provision of grid balancing services
Elena Crespi1*, Giulio Guandalini1, and Stefano Campanari1
1Department of Energy, Politecnico di Milano, Via Lambruschini 4A, 20156 Milano, Italy
Abstract. The continuous growth of non-programmable renewable energy resources penetration leads to
unpredictable oscillations of the net load faced by dispatchable power plants, hindering the reliability and
stability of the electric grid and requiring additional flexible resources. The EU project GRASSHOPPER
focuses on MW-scale Fuel Cell Power Plant (FCPP) based on low temperature PEM technology. The project
aims to setup and demonstrate a 100 kWel PEM FCPP, flexible in power output and designed to provide grid
support. This work presents a dynamic simulation model of the FCPP, developed to simulate plant flexible
operation and identify the best management strategy, aiming at optimizing the efficiency while reducing the
degradation rate. Cold start up simulations, according to a warm-up procedure limiting stack degradation,
result in a time to operation equal to 26 minutes. A sensitivity analysis is performed to determine which
parameters mostly influence the warm-up duration, showing that it is possible to reduce start-up time
substantially (e.g. down to 3 minutes with component preheating). On the other hand, simulations at variable
load along the entire range of operation (20-100 kWel), according to grid balancing requirements, show that
the plant is able to ramp up and down between the minimum to the maximum load in about 40 seconds.
1 Introduction aims at demonstrating the dynamic operation capability,
realizing the next-generation modular FC Power Plant
Power generation has experienced in the last years a (FCPP) unit targeting stationary application in the MW
continuous growth of renewable energy sources (RES) scale grid stabilization. The project is setting up a 100
penetration, as required to meet the greenhouse gas kWel PEM FC pilot unit, demonstrating flexibility in
emissions reduction targets set by most industrialized power output to provide grid support. The FCPP design
countries [1]. New installations have been mainly based will be cost-effective, targeting an estimated CAPEX
on non-programmable resources (wind and solar below 1500 €/kWel (at a yearly production rate of 25
photovoltaics) whose discontinuous and uncertain MWel), as required to enter the markets as a competitive
generation profile leads to unpredictable oscillations of player. Joint development of MEA, stack and system
the net load faced by the other dispatchable power design is thus a primary focus. The flexible demand-
plants, hindering the reliability and stability of the driven operation will be demonstrated with a gross
electric grid. Additional flexible resources are therefore power set point range between 20 kWel and 100 kWel
necessary in the power system, able to rapidly face the and a ramp-up rate delivering 50 kWel within 20 seconds
unbalances. and 100 kWel within 60 seconds.
In this framework, the EU project GRASSHOPPER In this work, a dynamic simulation model of the
[1] investigates the use of MW-scale Fuel Cell (FC) GRASSHOPPER pilot plant is presented. The model
power plants based on low temperature Polymer allows to simulate plant warm-up and variable load
Electrolyte Membrane (PEM) technology for the operation to identify the best management strategy,
provision of balancing services to the electric grid. optimizing the efficiency while reducing the expected
Indeed, the fast ramp rate and the load following FC degradation rate.
capability characterising this kind of systems make them
a possible source of flexibility for the provision of grid
ancillary services. The technical feasibility of large 2 FC power plant layout
MW-size PEM FC power plants has already been well
demonstrated, for example in the DEMCOPEM-2MW The layout of GRASSHOPPER 100 kWel FC pilot
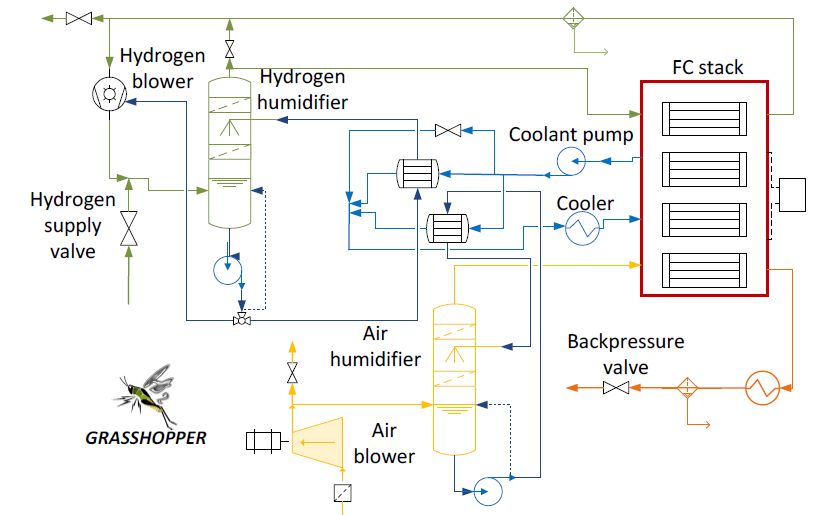
project (FCH-JU 2015) [3]. GRASSHOPPER project power plant is shown in Fig. 1.
* Corresponding author: elena.crespi@polimi.it
© The Authors, published by EDP Sciences. This is an open access article distributed under the terms of the Creative Commons Attribution License 4.0
(http://creativecommons.org/licenses/by/4.0/).E3S Web of Conferences 238, 04003 (2021) https://doi.org/10.1051/e3sconf/202123804003
100RES 2020
The model receives as input reactants and coolant
flow rate, composition, temperature and pressure at FC
inlet, and the set-point current density. The model then
solves mass and energy balances to determine flow rate,
composition, temperature and pressure of reactants and
coolant fluid leaving the FC stack. Gas build-up effects
in cells channels are neglected, both by a fluid-dynamic
and mass inertia point of view, since the volume of the
channels is negligible with respect to the volume of
other system components (i.e. humidifiers), where mass
accumulation is allocated. Temperature dynamic is
taken into account through the heat capacity of the stack,
Fig. 1 - Grasshopper 100 kWel FC power plant layout.
that is lumped in the bipolar plates. Constant heat
The stack is supplied with humidified pure hydrogen transfer coefficients and no heat losses to the
and air. Humidification is obtained through packed-bed environment are assumed. Pressure drops in the cells
shower-type humidifiers, that act also as scrubbers channels are linearly dependent on the reactants and
removing the impurities from the gas. The stack coolant fluid volumetric flow rate at stack inlet,
operating temperature, relevant for degradation and assuming laminar flow conditions.
efficiency, is controlled by the flow rate of coolant, a FC voltage and gross electrical power are calculated
glycol-water mixture flowing through a dedicated loop. on the basis of semi-empirical current-voltage
The thermal power is partially recovered to heat up the polarization curves. These curves are obtained from a
water used for hydrogen and air humidification and simplification of the theoretical polarization curve
partially dissipated by a dedicated cooler. A valve, equations, where the V(i) equation coefficients are
located at cathode outlet, allows to control air regressed on detailed datasets as reported in [4]. The
backpressure. Air ratio to stoichiometry is controlled by resulting curves take into account voltage dependence
regulating the rotational speed of the compressor. on backpressure, air ratio to stoichiometry, air relative
Excess hydrogen is recirculated through a liquid ring humidity and temperature. Voltage dynamic due to the
compressor and hydrogen ratio to stoichiometry is charge and discharge of the cell double layer are
controlled with a bypass system. Fresh hydrogen is included in the model. However, being typical values
supposed to be available at sufficiently high pressure found in literature for the double layer capacitance
(above 4 bar), thus it can be simply injected into the between 0.01 and 0.05 F/cm2 [5], the settling time
system through a controlled valve. associated to this phenomenon results lower than 1
The simultaneous control of backpressure, stack second, much faster than other important dynamic
temperature, air and hydrogen ratio to stoichiometry and effects such as those associated to the thermal inertia.
relative humidity will allow to optimize the system
performance and limit FC stack degradation. 3.2 Air compressor model
The air blower is modelled through the machine
3 FC plant dynamic model performance maps, allowing to compute the volumetric
flow rate of processed air, its temperature gain and the
A dynamic model of the 100 kWel FC power plant is compressor electric consumption, given the required
developed with the software Simulink. For each plant pressure gain and the rotational speed. The model
component, a model able to solve mass and energy neglects mass accumulation and temperature dynamics
balances during variable load operation is built, as of the working fluid and of the machine. Since this
described in the following paragraphs. Fluid properties would affect the start-up time, it is assumed that the
are calculated for gases with the hypothesis of ideal gas compressor is switch on in advance and it reaches
and ideal gas mixture, for water and water-coolant thermal equilibrium before the simulation starts.
mixtures considering ideal liquids with constant specific Dynamic effects connected to the mechanical inertia of
heat. Component models are then combined together to the machine, that slow down the rotational speed
build the entire system model and PI-type controllers are variation, are instead included with the same approach
implemented for the control of system operation. proposed in [6]: compressor rotational speed is
determined by a balance between the torque generated
3.1 FC stack model by the electric motor and the torque required by the
compressor.
The single cell model is developed with a lumped-
volume approach, based on performance data available
from detailed simulations. Since the FC model has a 3.3 Air supply manifold
modular structure, the stack lumped model considers The air supply manifold model gathers the volumes
several identical cells, electrically connected in series to of all the supply line components, allowing to simulate
form a fuel cell stack. This approach allows to reproduce air build-up in the supply line. The resulting lumped
large scale effects, as required by system simulation, volume is located between the air compressor and the air
without a detailed description of the internal phenomena humidifier.
in a single cell.
2E3S Web of Conferences 238, 04003 (2021) https://doi.org/10.1051/e3sconf/202123804003
100RES 2020
Assuming constant temperature in the manifold rotational speed. The compression process is divided
itself and ideal gas behaviour, the manifold model into two sequential steps: compression of the hydrogen
solves mass balances to compute how the pressure of the stream and mixing with the water stream. Constant
air in the supply line varies over time. The air flow rate isentropic and mechanical efficiencies are assumed to
entering the manifold volume is imposed by the air compute the electrical power consumption. Mixing of
compressor while the air flow rate leaving the manifold compressed hydrogen and liquid water in the liquid ring
volume is set by the pressure drops in the components compressor is modelled as an adiabatic process.
located downstream and, mainly, by the backpressure
valve located at cathode outlet.
3.6 Heat exchangers
Air flow through the valve is modelled as a
compressible-fluid one-dimensional isentropic flow All the heat exchangers in the plant are counter-current
through an orifice, with the assumption of subcritical plate-type heat exchangers. Since the plate heat
pressure ratio. An empirical discharged coefficient takes exchanger has a modular structure and the hot and cold
into account deviation from one-dimensional flow [7]. fluids are assumed to be equally distributed among the
channels, it is modelled as a sequence of identical sub-
3.4 Humidifier model units. This sub-unit includes a single plate and half of
the adjacent cold and hot channels. The heat transferred,
In the packed-bed shower-type humidifier, the gas the temperature of the plate itself and the temperature of
(air or hydrogen) is introduced at the bottom of the the outlet streams are calculated, discretizing the unit
packed-bed column and flows upwards, increasing its along the direction of the channels (1D-model). For each
humidity thanks to the evaporation of the water that control volume resulting from the discretization
flows downwards. Residual liquid water accumulates in procedure, mass and energy balances are solved
the tank at column bottom; it is then heated up and assuming a uniform temperature for the plate, neglecting
pumped back to the humidifier column top. heat transfer by conduction along the flow direction (due
The model considers two sections: the packed-bed to the relatively small thermal gradients and the
column and the water tank. For each part, a lumped necessity to avoid more complex iterations which would
volume approach is considered. impact the simulation speed) and heat losses to the
The packed bed column model determines flow environment. Temperature dynamic is related to the heat
rates, composition, temperature and pressure of gas and capacity of the heat exchanger materials, while fluid
water leaving the column by solving mass and energy mass accumulation in the channels is neglected.
balances, given the inlet streams properties. According Constant values for water and coolant heat capacities as
to industrial experience, it is assumed that the gas well as for the heat transfer coefficients are assumed.
always leaves the column in thermal equilibrium with The thermal resistance of the plate is neglected. Pressure
the sprayed water and fully saturated (humidifier is assumed to vary linearly with the volumetric flow
effectiveness 100%). No water drops are entrained by rates.
the gas stream leaving the humidifier thanks to a
demister installed at the top of the column. Temperature
3.7 Pumps
dynamic in the humidifier column is not included in the
model, being negligible with respect to temperature A steady state model is realised also for the pumps. The
dynamic in the humidifier tank. The packed-bed has a model computes the electric consumption of the pump,
void fraction equal to 90% of its volume. However, the as well as pressure and temperature of the outlet fluid
air humidifier model does not consider gas build-up in assuming constant isentropic and mechanical efficiency.
the packed-bed column, since the volume of all the
components of the air supply line are gathered in the air
manifold. On the contrary, the H2 humidifier model 3.8 Pipelines
includes gas build-up possibility in the packed-bed
The model of pipelines, connecting the plant
column. In this case, the flow rate of moist hydrogen
components, includes calculation of pressure drops and
leaving the humidifier is imposed by the liquid ring transport delay. Pressure drops in the pipes are
compressor which recycles the stack anode exhaust and computed as a function of the volumetric flow rate.
the inlet flow rate of fresh hydrogen is regulated in order
Transport delay, representing the time that the fluid
to control the pressure in the humidifier, and
takes to go from one component to the next one, is
consequently the FC anode backpressure.
simulated through a time delay that depends on pipe
The bottom water tank model solves mass and
length, diameter and volumetric flow rate. The
energy balances, considering water accumulation and assumption of incompressible fluids is introduced (air
temperature dynamic. The thermal inertia is associated
accumulation, as already mentioned, is concentrated in
to the heat capacity of the accumulated water, being the
the air supply manifold volume, while hydrogen
heat capacity of the tank walls negligible (< 5%). Perfect
accumulation is concentrated in the hydrogen humidifier
mixing in the water tank is assumed.
volume). The heat capacity of the pipeline system is not
included in the model since it results negligible with
3.5 Liquid ring compressor model respect to the heat capacity of the other plant
A stationary model is set up for the liquid ring components.
compressor, since it works within a narrow range of
3E3S Web of Conferences 238, 04003 (2021) https://doi.org/10.1051/e3sconf/202123804003
100RES 2020
4 Dynamic simulations The current density remains at the minimum value
for about 450 seconds (> 7 minutes), when the average
Preliminary simulations are performed to investigate the coolant temperature reaches the minimum value that
system performance during cold start up and variable allows the current to increase. The system reaches the
load operation, in order to simulate the provision of grid nominal current in 1560 seconds (26 minutes). It takes
ancillary services. another 15 minutes for all parameters to reach the
nominal point, as shown in Fig. 3, being hydrogen ratio
4.1 Cold start up to stoichiometry and hydrogen relative humidity the last
parameters to reach the nominal point.
Cold start up is simulated to understand how long does 1200 70
it take the plant to reach nominal operating conditions
when started after a long shut-down period.
60
1000
]
2
It is assumed that the plant is off and all the 50
components and the cooling fluid are at ambient
800
temperature (20°C). The FC plant is switched on and the
40
600
power demand is increased according to a warm up
Temperature [°C]
Current density [mA/cm
30
procedure, defined to allow the plant itself to reach the 400
nominal point (detailed in Table 1) as fast as possible
20
2
Current density [mA/cm ]
while maintaining all the operating parameters within a 200
T coolant average [°C] 10
range of values defined to limit cells degradation. T air FC inlet [°C]
0 0
0 500 1000 1500 2000 2500
Table 1. Plant nominal operating point time [s]
Fig. 2 – Current density, average coolant temperature and air
Parameter Nominal value temperature at FC inlet over time in cold start up.
Current density 1 A/cm2
Stack temperature 65°C 200
Coolant temperature gain over the 10 °C Air RH [%]
H2 RH [%]
stack
150
RH setpoint [%]
Air ratio to stoichiometry 2 100
Hydrogen ratio to stoichiometry 1.5
Relative humidity [%]
Air backpressure 1.35 bar 50
Average air relative humidity 100% 0
Average hydrogen relative 100% 0 500 1000 1500 2000 2500
humidity
70 15
Warm up initial state considers that the air 60
compressor is switched on at its nominal power (giving
T coolant avg [°C]
50 T coolant avg setpoint [°C] 10
the nominal air ratio to stoichiometry at nominal 40
Air stoichiometry
operating conditions) and the backpressure valve is
Air stoichiometry setpoint
Temperature [°C]
Ratio to stoichiomentry
Fuel stoichiometry
30 5
regulated to obtain the nominal air backpressure. The Fuel stoichiometry setpoint
coolant flow rate is set at the nominal value aiming at
20
fast heating of humidifiers. The liquid ring compressor
10 0
0 500 1000 1500 2000 2500
is also operated at its nominal point.
The FC is switched on at its minimum load, with a
Fig. 3 – Relative humidity, ratios to stoichiometry and
current density of 200 mA/cm2, equal to 20% of the average coolant temperature profile over time during cold
nominal value. The current density is then increased up start up vs. setpoints.
to the nominal value, with a rate of increase limited by
two temperature constrains (defined to limit cell Air and fuel ratio to stoichiometry have their
degradation): for each average temperature of the maximum at start up, when the current density is at the
coolant along the stack and for each temperature of the minimum. Then, they decrease when the current density
air at stack inlet, a maximum current density is allowed increases.
to keep the membrane correctly humidified. Immediately after start up, when the stack is cold,
When current density, reactants humidify and stack air relative humidity is above 100% while hydrogen
temperature reach their setpoint, controls are activated relative humidity is about 100%. Then, while increasing
to keep, respectively, reactants ratio to stoichiometry, the current density, both air and hydrogen average
reactants humidity and coolant temperature at the relative humidity decrease because the stack
desired values. The external cooler is activated to temperature increases faster with respect to the
remove the excess heat. humidifiers temperature, influencing the gas water
Fig. 2 shows how the current density varies over content at stack inlet (air and hydrogen leave the
time during plant warm up. The average temperature of humidifiers at the same temperature of the sprayed
the coolant over the stack and the temperature of the air water, saturated with water). Finally, the humidifiers
at stack inlet are shown in the same figure.
4E3S Web of Conferences 238, 04003 (2021) https://doi.org/10.1051/e3sconf/202123804003
100RES 2020
temperature increases and the average relative humidity On a system level, impact of the length of the pipes
reaches the 100% setpoint. connecting the plan components is quite limited. On the
contrary, a reduction of 50% in the amount of water in
A sensitivity analysis has been performed to the humidifier tanks have an important impact on the
determine which parameters mostly influence the warm- start-up time, with a reduction slightly below
up duration. Firstly, a sensitivity analysis on the initial 10 minutes. Indeed, in this case a lower amount of heat
temperature is performed: it is indeed possible that would be transferred from the coolant fluid to the
ambient temperature is higher in summer or that the humidifiers water tanks in order to reach the target air
warmup procedure starts from a higher temperature temperature. Thus, the current density could increase
because the plant remained off only for a short period. faster because both coolant and humidifiers
Then, by the FC point of view, an analysis is performed temperature, and consequently the air temperature at
to assess the impact of the cells overall heat transfer stack inlet, also increase faster. The strong impact of the
capacity and of the cells heat capacity. Finally, at a heat duty required by the water in the humidifiers tanks
system level, the analysis focuses on the impact of (i) on the start-up time is confirmed by the 11 minutes start-
the length of the pipes connecting the components, (ii) up time reduction in the case where the humidifier water
the amount and initial temperature of the water in the temperature at the beginning of the warm up procedure
humidifiers (mainly in the air humidifier, since the is 30°C, i.e. 10°C higher with respect to the reference
current ramp up depends on the air temperature at stack case. This time reduction is only 2.2 minutes less with
inlet) and (iii) the overall heat transfer capacity in the respect to the time reduction obtained by increasing the
heat exchangers used to heat up the humidifier water. temperature of all the system components to 30°C,
The cases under investigation and the associated showing the effectiveness of heating up only the water
time required for the current density to reach in the humidifier tank to speed up the warm up process.
1000 mA/cm2 are reported in Table 2, in comparison Finally, a change in the overall heat transfer
with the reference case. coefficients in humidifiers heat exchangers does not
affect significantly the warm up time. It has to be
Table 2 - Sensitivity analyses: warm up duration and highlighted that, in this case, the current increase rate is
percentage reduction with respect to the reference case. always limited by the coolant temperature rise, since
more heat is transferred to the water in the humidifiers
Case t [min] Δt [%] tanks and the air temperature increases faster at the
Reference case 26.0 - expense of the average coolant temperature. For the
Initial temperature 30 °C 12.8 -50.8% same reason, the current density remains constant at the
Initial temperature 40 °C 3.2 -87.7% initial 200 mA/cm2 for a longer time with respect to the
Doubled cells overall heat 25.5 -1.9% reference case (660 seconds instead of 450 seconds).
transfer coefficient
Halved cells heat capacity 24.8 -4.6% 4.2 Load following operation
Halved pipes length 23.8 -8.5%
Halved amount of water in the 16.9 -35.0% In order to provide ancillary services, the FC power
humidifiers tanks plant must operate dynamically, following the load
Initial temperature of water in 15.0 -42.3% request within few minutes. Thus, the plant will operate
humidifiers tanks 30°C most of the time at partial load and the plant
Initial temperature of water in 6.6 -74.6% optimization has to consider operation at any current
humidifiers tanks 40°C density.
Doubled overall heat transfer 25.3 -2.7% Simulation following a hypothetic fluctuation of the
coefficients in heat exchangers load are performed. The gross power generated by the
for humidifier water FC power plant is varied every 15 minutes, analysing
the entire range of operation for the stack, from 20 kWel
Results show that, when the system is kept at higher to 100 kWel, as depicted in Fig. 4.
temperature, the start-up time significantly reduces, 100
reaching the nominal current density in 12.8 and 3.2
minutes when started from 30°C and 40°C respectively. 50
demand [kW]
Gross power
Indeed, the current density remains constant at 200 0
mA/cm2 for 7.5 minutes in the reference case, for 1.3 0 15 30 45 60 75 90 105
minutes when the system starts from 30°C while it can
time [min]
increase immediately when it starts from 40°C. The Fig. 4 – FC gross power demand profile
reason is the thermal inertia of the water in the
Fig. 5 shows how the stack gross power, the current
humidifier tanks, that takes about 4 minutes to heat up
density and the voltage vary over time, proving that the
from 20°C to 30°C, subtracting heat from the coolant
fluid and delaying the current increase. system is able to follow the load demand. In Fig. 6,
Looking at the FC stack parameters, the impact on details on performance at stepwise power changes from
the start-up time of the cells overall heat transfer 20 kWel to 100 kWel and from 100 kWel to 20 kWel are
capacity and of the cells heat capacity are not presented. The rate of change of the FC gross power is
significant. limited at 2 kWel/s, to limit stack degradation while
5E3S Web of Conferences 238, 04003 (2021) https://doi.org/10.1051/e3sconf/202123804003
100RES 2020
respecting the desired ramp target (ramp-up rate 5 Conclusions and future work
delivering 50 kWel within 20 seconds and 100 kWel
within 60 seconds). To avoid air and fuel starvation, A dynamic model of a 100 kWel PEM FC power
flow rates of air and fuel at FC stack inlet are increased plant has been developed, including sub-models of the
few seconds before current ramp-up and only at the end main plant components. Simulations of plant cold start-
of current ramp-down. Both in ramp-up and ramp-down up and load following operation have been performed.
the system takes about 40 seconds to reach the power Preliminary cold start-up simulations show that the
setpoint. system reaches the nominal current density in 26
minutes when started from 20°C. However, when the
system is kept at higher temperature, the start-up time
significantly reduces, being 12.8 and 3.2 minutes when
1200 120
1000 100 started from 30°C and 40°C respectively. A sensitivity
800 80
analysis shows that the components which more
significantly limit the plant dynamic are the humidifiers.
] - V [V]
600 60
Thus, possible options to reduce the start-up time are
2
Gross power [kW]
400 40 decreasing the amount of the water in the humidifier
i [mA/cm
200 20
tanks, decreasing the humidifiers size or preheating the
water.
0
0 15 30 45 60 75 90 105
0
Simulations of plant variable load operation show
time [min]
that the system is able to follow the power demand and
is able to ramp up and down between the minimum and
Fig. 5 – FC current density, voltage and gross power profile
during variable load operation.
the maximum load in 40 seconds, fully reaching the
target set by the project.
1200
1000 These simulations results contribute to determine the
800
plant preliminary operating strategy and allows to
identify the more critical aspects and investigate
] - V [V]
600
possible evolutions of the design.
2
400 During the first period of operation of the 100 kWel
i [mA/cm
200
GRASSHOPPER pilot plant, experimental operational
data will be collected and used to validate the model,
aiming at gaining further insight on the plant dynamics
0
74 75 76 77 78
and also at optimizing the system for MW-scale.
Fig. 6 - FC gross power profile for step-wise changes from
nominal to minimum load (left side) and from minimum to This work was developed within the project GRASSHOPPER,
nominal load (right side). which has received funding from the Fuel Cells and Hydrogen
2 Joint Undertaking under grant agreement No 779430. This
Preliminary design evaluations provide gross and net Joint Undertaking receives support from the European Union’s
plant efficiency up to 64% and 49% respectively (see Horizon 2020 research and innovation programme, Hydrogen
Fig. 7). The net efficiency at minimum load operation Europe and Hydrogen Europe research.
(~ 42%) is negatively influenced by the air compressor
baseload; indeed the air ratio to stoichiometry is
controlled through the compressor rotational speed only
References
when the plant operates close to the nominal load, while 1. European Commission, “A Clean Planet for all. A
moving to lower load the compressor reaches its European long-term strategic vision for a prosperous,
minimum power and air purge is required. The adoption modern, competitive and climate neutral economy,”
of a compressor controllable over the entire range of Com(2018) 773, p. 114, 2018.
plant operation would increase the plant net efficiency. 2. Grasshopper project website: www.grasshopper.eu
Further improvements will come from design
3. S. Campanari, G. Guandalini, J. Coolegem, J. ten Have,
optimization and experience from the pilot unit. P. Hayes, A. H. Pichel, JEECS, doi 10.1115/1.4042923
0.7
(2019)
0.6 4. E. Crespi, G. Guandalini, J. Coolegem, M. Martín, S.
Gössling, P. Beckhaus, S. Campanari, Modelling and
optimization of a flexible PEMFC power plant for grid
balancing purposes, A1302, in Proceedings of
0.5
Efficiency [%]
European Fuel Cell Forum (EFCF) 2019, 2-5 July,
0.4 Lucerne, Switzerland (2019)
5. M. J. Khan, M. T. Iqbal, Fuel Cell, 4, 463-475 (2005)
Gross efficiency
Net efficiency
6. M. R. Malekbala, Thermal Science, 9, 6 (2015)
0.3
0 15 30 45 60 75 90 105
time [min]
7. M. Cary, Proceedings of the Institution of Mechanical
Fig. 7 – FC gross efficiency and plant net efficiency profile Engineers, Part D, 215, 813-825(2001)
during variable load operation.
6You can also read