An Optimized Technique for Sharing Air Quality Index Using Cloud Technology - IJITEE
←
→
Page content transcription
If your browser does not render page correctly, please read the page content below
International Journal of Innovative Technology and Exploring Engineering (IJITEE)
ISSN: 2278-3075, Volume-9 Issue-3S, January 2020
An Optimized Technique for Sharing Air Quality
Index Using Cloud Technology
N. Vallileka, S.Jai Ganesh, Nimmathi Satheesh, R.SivaKumar, N.Muthu Lakshmi
Abstract: This paper studies the sharing the messages of this paper proposed an IoT based cloud application like
Air Quality Index (AQI) in Metropolitan areas. AQI specifies the android application. When the pollutant level increases then
percentage of pollutants mixed in air which creates problem in an alarm is generated in the android mobiles connected in
health. The pollutants level in the AQI values is between 0 to 500.
the cloud network (within the application). Hence based on
Air pollution sensors are used to monitor the air pollution for
outdoor environments and the cloud technology is used to display the pollution the public informed by alarm to get remedy to
to public via private cloud. Prototype was developed with the aim avoid health issues. The proposed system identifies the level
to create awareness and public engagement in restoring the of N2, NO2, SO2, and P.M10 using various kinds of sensors
environment back to its healthy state. Using the prototype, the installed in the network. It also identifies temperature and
users can interact with the environment sensors in the field of humidity by relevant sensors connected in wireless
view to access and visualize latest and historic environment
communication medium. The android application is
measurements.
designed and installed in the particular place where it is
Keywords : AQI, Air Quality index, mobile Communication, required really. Each user needs to register in the application
cloud with AQI, air pollution sensors. using their mobile device. The sensors observe the data
along with the AQI and transmit to the application server
I. INTRODUCTION and the intimation to the mobile.
There has been a drastic change in air pollution since the
start of industrial revolution. Though industries are seen as II. AIR POLLUTION INDEX BACKGROUND
growth propellers the impact it creates in the environment is The air pollution is calculated in terms of AQI, where its
not healthy. To add to the woes, vehicles used for range of values is considered from 0 to 500 and it is given in
transportation and fertilizers used in agriculture contribute to detail in Table-2.1.
pollution too. People are aware of the ill-effects of pollution. One of the main forms of air-pollution is created by
However, people do not monitor or track it every day. Air transportation and fuel usage applications. High level of
pollution can be due to natural cause or due to abnormal. pollution makes acid rain which affects the drinking water,
The highest pollutants level makes pollution in the natural soil, buildings, vegetation and destroy the aquatic life [17].
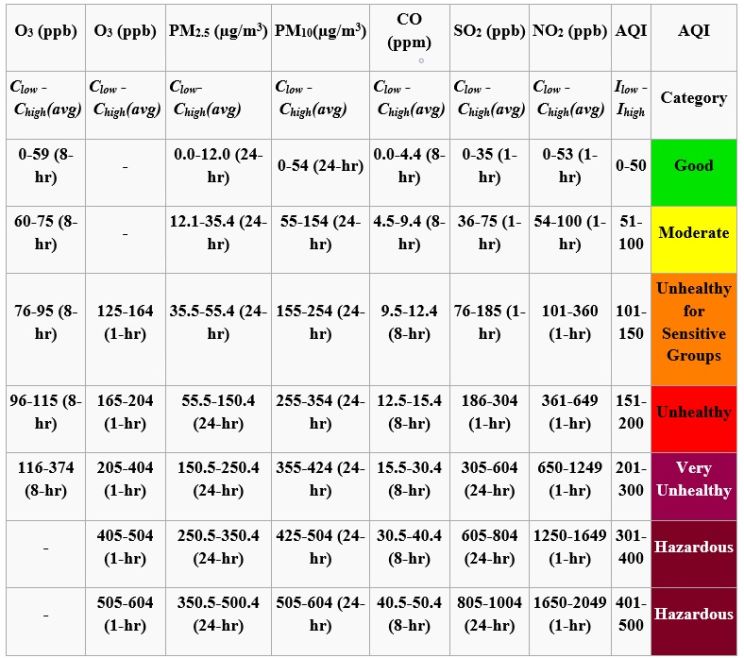
air creates fire accidents in the forest, dust-storms, pollution, Table 2.1 Air quality Index
and etc. Some of the human-made pollution are wood
cutting, coal mining and fuels-based pollution. In order to
measure the pollution level AQI is used where it displays
the information about the major pollutants mixed in the air.
It can be measured at particular geo-location without any
infrastructure development.
Monitoring the air quality helps to obtain the purity of the
air based on the mixed content’s information. It helps to
inform the public about the air pollution since they can take
action for breathing air. Because polluted air makes lot of
serious health issues to the human. It creates lung, brain and
breathing issues to the public and put them in critical
situation. Identifying the air quality helps to save people
from the health issues and make the people reduce their
III. PROPOSED TECHNIQUES
activities related to pollutants. Once people reduce the
pollutants-based activities it decreases the pollutants level 3.1 Air Pollution Sensors
mixed in the air. To do that, an alarm is installed/deployed Some kind of sensors are used as devices for monitoring
in the target geo-location where it makes an alarm whenever and calculating air pollution. They may be used for indoor
the pollutants level exceeds their limit. In order to do that, and outdoor environments. Even though there are different
types of sensors for air pollution, the main are five
Revised Manuscript Received on January 2, 2020. components:
N. Vallileka, Dept. of computer Applications, PSNACET, Dindigul,
Tamilnadu, India
S.Jai Ganesh, Dept. of computer Applications, PSNACET, Dindigul,
Tamilnadu, India
Nimmathi Satheesh, Dept. of computer Applications, PSNACET,
Dindigul, Tamilnadu, India
R.SivaKumar, Dept. of Chemistry, PSNACET, Dindigul, Tamilndau,
India
N.Muthu Lakshmi, TCS, Bangalore, Karnataka, India
Retrieval Number: C10850193S20/2020©BEIESP Published By:
DOI: 10.35940/ijitee.C1085.0193S20
398 Blue Eyes Intelligence Engineering
& Sciences Publication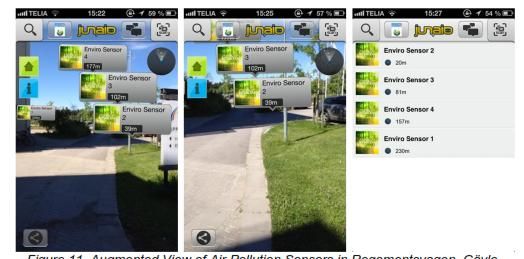
An Optimized Technique for Sharing Air Quality Index Using Cloud Technology

                                                                         4.2 Cloud Provider and services
                                                                     Cloud computing manage the sensors where it will
                                                                  coordinate between the Sensor owner , the cloud provider
                                                                  and the end user i.e public. The sensor owners develop the
                                                                  system and develop functionality to publish the data on the
                                                                  cloud. The cloud providers then provide the cloud services
                                                                  and may charge the end user with some fee for the access.
                                                                  We utilize the PaaS (Platform As A Service). PaaS provides
    Initially the cost of the sensors is high, now with           a platform for software creation. Another important factor of
technological advancements these sensors cost is low and          PaaS is that it allows business to design and create
widespread throughout the population. By this project the         applications that are built into the PaaS with special
sensors are fitted in the main areas for Metropolitan cities to   software components. The ―Breathe-safe‖ application that
maintain storage pool to store the monitored data using the       we developed on PaaS platform utilizes various computation
air quality system. It stores all the monitored data gathered     algorithms and AQI calculation based on current sensors
from the particular geolocation where the system installed.       values and showing it to user on GUI using JavaScript based
This application is used in top most metropolitan cities.         charts & Graph API.
   By using these kinds of sensor, all the possible measures         This supports server less computing so virtual machines
related pollutants are collected as a spatiotemporal data         are needed to service the request based on hour basis. There
where it lists out all the chemical information which affects     are three types of deployment model private cloud, public
the human in and around a specific location. Also, it mainly      cloud and hybrid cloud. In this paper we are using private
says about the air pollution [4]. The evidence of the air         cloud to share AQI.
pollution happened in the metropolitan and industrial cities
are increased by scientific reports. The amount of death due        V.      DESIGN CONSIDERATION AND WORKING
to air pollution is increasing up to 7 million child death                              PRINCIPLE
throughout the world in each year[8]. The pollutants are
inhaled by the human and it is deposited in various parts of         Measurements of air pollutants such as Carbon monoxide
the body like lung, stomach and etc., which creates serious       (CO), Nitric Oxide (NO), Nitrogen dioxide (NO2) have
diseases like cancer and heart attacks. It can be measured by     been recorded since the installation[17]. Also,
the body mass index values and blood tests. The pollutants        measurements of temperature, humidity and sound level is
are travelling throughout the human body and affects the          also made to get more information about the environment.
                                                                  Once the database server was set up, the content necessary
vital organs of the body [9].
                                                                  for visualization was created. The contents were converted
3.2 Cloud Computing Techniques                                    into file formats and sizes supported by SDK rendering
   One of the highly demanding environments used to share         engine and stored in the database of the server in cloud.
the computer resources is cloud computing. Those devices          Media content such as voice alerts or audio messages were
are used to do various tasks especially data storage and          created for real time response to the users and stored in web
computing devices. some of the famous cloud providers are         server in cloud Images and icons to be displayed were also
Google cloud platform, iCloud, cloud foundry, Microsoft           created and stored.
Azure, Amazon etc. The cloud clients are web browser,
mobile app and terminal emulator. Three standard models
are IaaS, SasS and platform as a service PasS. Here we are
going to use SasS to see the AQI from cloud to mobile. Now
Mobile backend as a service (BaaS) is there where web
application developers and mobile application designers are
link applications with cloud storage and cloud computing
services with their mobile application. In cloud, users are
managed. It also supports server less computing.

               IV.      METHODLOGY
  4.1 Selection of Sensors
                                                                                 Fig5.1. Modules in Junaio App
  The Pollution Sensors and their usages are:                        The above figure 5.1 explains the development of such a
                                                                  transparent platform will act as a basis for actions towards
                                                                  environment protection. The structure of the methodology is
                                                                  as follows, Design and develop a prototype to display air
                                                                  pollution in the environment in the city. Evaluate mobile
 Two eco-friendly Sensors are used for temperature –              app prototype developed for displaying air pollution.
DHT 11 and for humidity – DHT 11

       Retrieval Number: C10850193S20/2020©BEIESP                    Published By:
       DOI: 10.35940/ijitee.C1085.0193S20
                                                              399    Blue Eyes Intelligence Engineering
                                                                     & Sciences Publication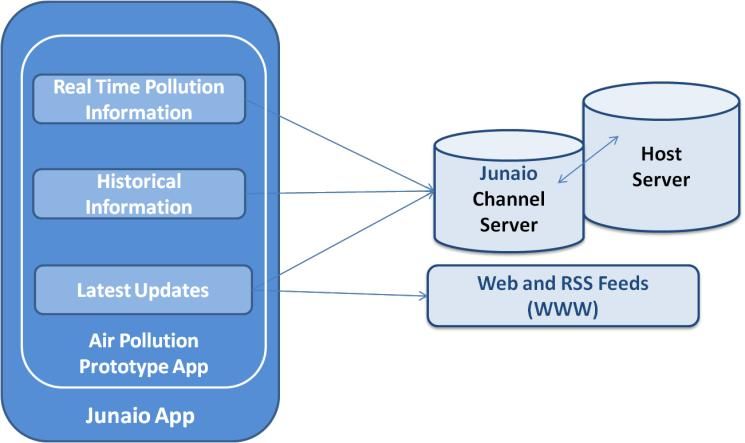
International Journal of Innovative Technology and Exploring Engineering (IJITEE)
                                                                     ISSN: 2278-3075, Volume-9 Issue-3S, January 2020

   In order to understand about the practical applicability of            VI.       PROBLEM FORMULATION
the prototype application and user perception, user
                                                                    6.1 Computing the AQI
evaluation of the system was conducted in comparison with
an existing web application tool for monitoring air pollution       The air quality index for pollutant concentration.
in the environment. Factors of context immersion are                The equation used to convert from concentration to AQI
considered for user evaluation to evaluate the immersion         is :
experience created by mobile application. A mobile
application (in short mobile app) is a customized application                                               ------ (1)
developed using the native programming language Android             where:
that supports the platform of the smart phone device or
tablet. The advantage and disadvantage of AQI displaying
systems was studied using human understanding and
response to the features of the application for monitoring
pollution in the environment.
   Taking this as the context and interest of the users, two
modules were designed based on the timeline the
information belongs to real-time visualization and historical
data visualization. Third module is to get latest information
from the research community which can be latest discovery
or results from forecast modeling of environment research.
The third module serves as the information portal which
shares and showcases the status and results of environment       EPA's table of breakpoints is:
researches. Three modules were designed to provide user
with option to select the data they would like to visualize.
These three modules constitute the layout of the prototype of
air pollution visualization. The operations that should be
performed on loading each module will be explained in the
prototype development section. During the design of the
prototype, it is important to consider some best practice
design considerations such as performance, modularity,
robustness, security and scalability. A well designed module
should take less time to load and perform its desired action
showing reliable performance during usage. It should be
able to work independently with modularity and should
respond in stress conditions with prompt user response. The
modules should allow easy extendibility. Prototype design
should accommodate the user interaction through the touch
inputs and visualization of data should be designed to fit
small screen of mobile phones. The visualization in the
design includes text annotations, charts, and map of the
location. Junaio is an Augmented Reality browser designed          Suppose a monitor records a 24-hour average fine particle
for 3G and 4G mobile.                                            (PM2.5) concentration of 12.0 micrograms per cubic meter.
                                                                 The equation above results in an AQI of:

                                                                     Corresponding to air quality in the "Good" range. To
                                                                 convert an air pollutant concentration to an AQI, EPA has
                                                                 developed a calculator.
                                                                    If multiple pollutants are measured at a monitoring site,
                                                                 then the largest or "dominant" AQI value is reported for the
                                                                 location. The ozone AQI between 100 and 300 is computed
                                                                 by selecting the larger of the AQI calculated with a 1-hour
                                                                 ozone value and the AQI computed with the 8-hour ozone
                                                                 value.

        Fig:5.1 Product Architecture of Mobile App
   The above figure Fig 5.1 describes the protocol
architecture of Mobile App which is used for displaying the
AQI.

       Retrieval Number: C10850193S20/2020©BEIESP                  Published By:
       DOI: 10.35940/ijitee.C1085.0193S20
                                                             400   Blue Eyes Intelligence Engineering
                                                                   & Sciences Publication
An Optimized Technique for Sharing Air Quality Index Using Cloud Technology

   8-hour ozone averages do not define AQI values greater           REFERENCES
than 300; AQI values of 301 or greater are calculated with         1.    Bernstein JA, Alexis N, Barnes C, Bernstein IL, Bernstein JA, Nel
1-hour ozone concentrations. 1-hour SO2 values do not                    A, Peden D, Diaz-Sanchez D, Tarlo SM, Williams PB: Health
define higher AQI values greater than 200. AQI values of                 Effects of Air Pollution. Journal of Allergy and Clinical
                                                                         Immunology 2004, 114(5):1116-1123.
201 or greater are calculated with 24-hour SO2                     2.    Asaad M. J. Al-Hindawi, Ibraheem Talib, ―Experimentally
concentrations.                                                          Evaluation of GPS/GSM Based System Design‖, Journal of
                                                                         Electronic Systems Volume 2 Number 2 June 2012
6.2 Prototype Testing and Publishing                               3.    B.Abinayaa, G.Kiruthikamani, B.Saranya, R.Gayathri, ―An
                                                                         Intelligent Monitoring Device for sthmatics using Arduino‖,
Prototype testing was carried out in the target platforms of             International Journal of Advanced Research in Electrical,
mobile devices. Prototype was                                            Electronics and Instrumentation Engineering, ISSN (Print): 2320 –
Published in Junaio channel server as non-public for testing.            3765, ISSN (Online): 2278 – 8875 Vol. 5, Issue 7, July 2016.
Prototype validation was performed by Junaio server and the        4.    Saranya.B, Sasikala.N, Sharmila.K, Nandini.S, ―An Embedded
                                                                         based Robotic Arm to Find Unauthenticated Code,‖ International
response from the server was verified. After publishing, the             Journal of Engineering and Management Research Page Number:
prototype was tested in Android and iOS platforms using                  185-190 ISSN (ONLINE): 2250-0758, ISSN (PRINT): 2394-6962,
mobile devices built with those platforms. iPhone 4S and                 Volume-5, Issue-1, February-2015.
                                                                   5.    K., Thurston, G.D., Silverman, R.A., 2007. Characterization of
iPad 2 with iOS version 6.1.2 was used for testing in iOS                PM2.5, gaseous pollutants, and meteorological interactions in the
environment. Any defects found during the testing was                    context of time-series health effects models. J. Expo. Sci. Environ.
corrected and tested again in both operating systems. Once               Epidemiol. 17 (Suppl. 2), S45eS60
                                                                   6.    State Environmental Protection Agency of China, ―China National
there were no defects detected, the prototype was published              Ambient Air Quality Standard (in Chinese),‖ GB3095-2012, State
as public channel. The channel can                                       Environmental Protection Agency of China, Beijing, 2012.
then be viewed by anyone who has Junaio application                7.    CPCB, ―National Ambient Air Quality Standards,‖ 2009.
                                                                         http://www.cpcb.nic.in/National_Ambient_Air_Quality_S
installed. Once the channel is published to                              tandards.php
public, the channel can be found using the channel name or         8.    BIS, ―Indian Standard Methods for Measurement of Air Pollution:
associated keywords of the channel in the Junaio directory.              Part IV—Suspended Matter,‖ Bureau of Indian Standards, New
                                                                         Delhi, 1974, 11 p.
                                                                   9.    BIS, ―Indian Standard Methods for Measurement of Air Pollution:
                  VII.     RESULTS                                       Part VI—Nitrogen Oxides,‖ Bureau of Indian Standards, New Delhi,
                                                                         1975, 6 p.
7.1 Air Pollution Visualization                                    10.   BIS, ―Indian Standard Methods for Measurement of Air Pollution:
   The channel for air pollution visualization was published             Part II—Sulphur Dioxide,‖ Bureau of Indian Standards, New Delhi,
                                                                         1969, 11 p.
as non public channel during development and testing. The          11.   Venkatesh, Indra. A and Murali. R, ―Vehicular Ad hoc Networks
quality of air in the location of metropolitan area was                  (VANETs): Issues and
visualized. Figure 5.1shows augmented view of the                  12.   Applications‖, Journal of Analysis and computation, Vol. 8, No. 1,
                                                                         2012, pp.31-46.
environment sensors which measures air quality in the study        13.   Andrei Furda et al, ―Enabling Safe autonomous driving in real-world
area.                                                                    city traffic using multiple criteria decision making‖, IEEE Intelligent
   The distance to the each sensor and the sensor number is              Transportation System Magazine, SPRING 2011, pp. 4-17.
                                                                   14.   S S Manvi and M S Kakkasageri, ―Issues in Mobile Ad hoc
shown in the label of the sensors. On                                    Networks for Vehicular Communication‖,IETE Technical Review,
   navigation towards the sensors, individual sensors were               Vol. 25, No 2 MarchApril 2008.
located.                                                           15.   Alexandru Dorin et al, ―MAC Protocols for VANETs - A Survey
                                                                         and Qualitative Analysis‖, Albert-Ludwigs-University Freiburg,
                                                                         seminar paper, February 2010.
                                                                   16.   V.Ramya, B. Palaniappan, K. Karthick, ―Embedded Controller for
                                                                         Vehicle In-Front Obstacle Detection and Cabin Safety Alert
                                                                         System‖, International Journal of Computer Science & Information
                                                                         Technrology (IJCSIT) Vol 4, April 2012
                                                                   17.   Mrs.N.Vallileka,Mrs.T.Kamalavalli,Dr.A.Vanitha
                                                                         katherine,Mrs.S.Vinothini,‖ An optimized technique for automobile
                                                                         data communication to share air qulaity index ―,International Journal
                                                                         of Mechanical Volume 9, Issue 11, November

                                                                                          AUTHORS PROFILE
                                                                   N. Vallileka, Dept. of computer Applications, PSNACET, Dindigul,
              Fig: 5.1 Displaying Sensor areas                   Tamilnadu, India.

              VIII.      CONCLUSION                                S.Jai Ganesh, Dept. of computer Applications, PSNACET, Dindigul,
                                                                 Tamilnadu, India.
   However, the proposed system work well in sharing of
AQI in metropolitan areas such as Delhi, as of now which is         Nimmathi Satheesh, Dept. of computer Applications, PSNACET,
the latest metropolitan city highly affected by air pollution.   Dindigul, Tamilnadu, India.
Methods like Air Quality Management Plan ,Development               R.SivaKumar, Dept. of Chemistry, PSNACET, Dindigul, Tamilndau,
of new technology- electric cars, cleaner fuels, low nitrogen    India.
oxide boilers and water healers, zero polluting paints, less
                                                                    N.Muthu Lakshmi, TCS, Bangalore, Karnataka, India.
polluting BBQ lighter fluids, Use natural gas, Carpooling
will reduce the air pollution. To provide value added
services like audio/video sharing etc., are also implemented
here.

       Retrieval Number: C10850193S20/2020©BEIESP                  Published By:
       DOI: 10.35940/ijitee.C1085.0193S20
                                                             401   Blue Eyes Intelligence Engineering
                                                                   & Sciences Publication
You can also read