A review: Partial discharge detection using acoustic sensor on high voltage transformer - IOPscience
←
→
Page content transcription
If your browser does not render page correctly, please read the page content below

Journal of Physics: Conference Series

PAPER • OPEN ACCESS

A review: Partial discharge detection using acoustic sensor on high
voltage transformer
To cite this article: N A Akashah et al 2020 J. Phys.: Conf. Ser. 1432 012004

View the article online for updates and enhancements.

                                This content was downloaded from IP address 176.9.8.24 on 28/03/2020 at 16:38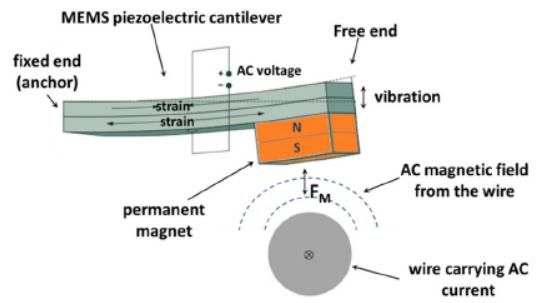
ICE4CT 2019                                                                                                     IOP Publishing
Journal of Physics: Conference Series                         1432 (2020) 012004          doi:10.1088/1742-6596/1432/1/012004

A review: Partial discharge detection using acoustic sensor on
high voltage transformer

           Akashah N A1, Rohani M N K H1, Rosmi A S2, Isa M1, Rosle N1, Ismail B1 and Wooi C L1
           1
             High Voltage Transient and Insulation Health (HVTrans) Group, Centre of Excellence for Renewable
           Energy (CERE), School of Electrical System Engineering, Pauh Putra Campus, University Malaysia,
           Perlis (UniMAP), 02600 Arau Perlis, Malaysia.
           2
             Department of Electronic Engineering Technology, Faculty of Engineering Technology, Unicity
           Campus, Sg. Chuchuh, 02100 Padang Besar, Perlis.

           Email: aziera@studentmail.unimap.edu.my

           Abstract: Partial discharge (PD) is an electrical discharge which is one of the most critical breakdown
           factor that is affecting the electrical equipment. The loss of the power will affect consumers and system
           operation. High voltage (HV) transformer is one of the equipment’s subjected to phenomena PD. In
           this paper reviews an application of acoustic methods in transformer and piezoelectric sensors
           application on PD detection in HV transformer. Based on this review, the new design in acoustic sensor
           is required in order to improve the sensitivity and bandwidth for PD detection at HV transformer. The
           valuable parameter such as materials, size, and PD frequency range were discussed in this paper and
           can be used for early stage on designing new acoustic sensor. This detection method given some
           benefits on preventing the power electrical system from breakdown.

           Keywords: Partial discharge (PD), high voltage transformer, piezoelectric, acoustic emission, PD
           detection.

1. Introduction

PD is an electrical discharge which is one of the most critical problem in electrical power equipment.
Identify the localization and type of detection is very important for equipment performance. By
definition, the PD is the conducting points with the instantaneous release of the energy that has been
affecting the electrical equipment[1]–[4]. Statistics result shows 85% of power failures happen at
medium and high voltage of power transformer [5], [6].

PD at high voltage transformer frequently occurs because of unscheduled maintenances, aging of
equipment, breakdown of insulation, gas bubbles in insulation liquid or others[7]–[10]. In order to
maintain constant performance of transformer, it is important to control, detect, and measure PD
phenomena.

There are many detection methods that have been presented and at the end, it can be categorized as
electrical, optical, chemical and acoustic detection[8], [9], [11]–[13]. Categorization of PD is based on
the types of emission happens at power equipment. PD frequency and occurrence will increase by the
time, leading to failure and can cause equipment damage by the absence of detection problems in
transformers. For instance, electrical detection is focusing on capturing electrical impulses from PD,
while optic detection is based on recording light as result of ionization, excitation and recombination
during partial discharge[9], [14], [15].Next, chemical follows changes in chemical structure of
materials causes by PD like presents in[16], [17] and lastly, during PD differentiation occurrences,
acoustic is recording mechanically and sense the acoustical signal produced [15], [18]. In [19]

              Content from this work may be used under the terms of the Creative Commons Attribution 3.0 licence. Any further distribution
              of this work must maintain attribution to the author(s) and the title of the work, journal citation and DOI.
Published under licence by IOP Publishing Ltd                          1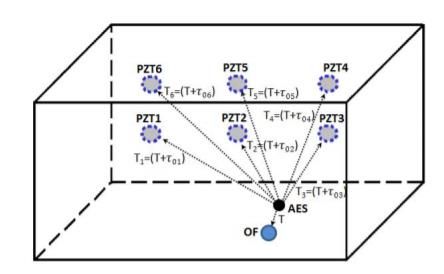
ICE4CT 2019                                                                                       IOP Publishing
Journal of Physics: Conference Series              1432 (2020) 012004       doi:10.1088/1742-6596/1432/1/012004

presenting an experiment and mention, the acoustic signal is produced from the vaporization of the
material around the hot steamer within the void and can cause an explosion which travels through the
transformers tank in form of pressure field.

However, there are on point of observations and each one has some disadvantages like presented
in[20]. For chemical, it is not suitable to apply online and on sight and for optical, it will be facing
problem with transparency of equipment and electrical will not be immune to electromagnetic
interference (EMI) compared to acoustic that is immune on EMI and it is possible to locate multiple
sources and location of PD in power equipment such as oil-insulated transformers. It is used in big
range as tool in reliability and the most applicable one in this method, which is very acceptable in
terms of economic value to industry[2], [5], [21].

PD can also be categorized in three types which are internal discharge, surface discharge and corona
discharge like mentioned in[22], [23]. Corona has highest intensity with high signal to noise ratio
while surface and internal PD is less intense and their detection is effected by noise[23]–[25]. The
phenomena of corona discharge generated in the high voltage electrical equipment outside surface
will increase the insulation aging, surface filth or atmospheric humidity[4], [23], [26].

Classification of PD existence in power high voltage transformer is based on consideration, location,
and some researches about the importance of an insulation system could occurs. However, in order to
analyse the internal components of the equipment such as transformers to become fabricated, some
techniques have been established in order to overcome the defect by other methods presenting in
[27]–[30].

Application of acoustic methods in transformers
Nowadays, acoustic is one of an importance of detection to avoid damage to equipment. The aim of
acoustic sensors is to sense and record the acoustic signal that have been successfully produced from
PD and used to monitor PD in power transformers like presents in[22], [27], [31].

In order to identify sources, it is necessary to capture signal that produced by PD that can varies from
10 kHz to 300 kHz as mentioned in [32]–[35]. Acoustic method has a time past in PD detection. As
regards on acoustic signal detection, comparative analysis has performed in focusing at impulse and
corona PD in acoustic detection method and two differences piezoelectric structure have produced [7],
[13], [15], [22]. Acoustic signal can be detected by setting the position sensor at the surface of the
tank or inside the tank while the output will be analyse by normal data. Figure 1 shows the experiment
on acoustic sensors on transformer. Figure 2 depicts the combination method of fibre optic and
piezoelectric sensors. There are many sensors that have be used such as microphones, piezoelectric,
fibre sensors, ultrasonic and etc. In some cases, combination of above is possible such as optical fibre
sensor that acts as detector and used as the reference point for piezoelectric sensor to recognize the
location detection[15], [22], [36], [37].

                            Figure 1. Experiment on acoustic sensors on transformer[19].

                                                          2
ICE4CT 2019 IOP Publishing
Journal of Physics: Conference Series 1432 (2020) 012004 doi:10.1088/1742-6596/1432/1/012004
Figure 2. Combination method of fibre optic and Piezoelectric sensors [15].
Piezoelectric sensor applications
Piezoelectric sensor is one of the popular techniques of acoustic detection for PD which is converting
vibration caused by acoustic signal into electrical signal like shown in[37]–[42]. There are several
types of piezoelectric material that are widely used for example lead zirconatetitanate (PZT), zinc
oxide (ZnO) and aluminium nitrate (AlN) which is mention in[36], [38], [43]. By different
piezoelectric materials will affect the performance of the energy harvester due to the different of
piezoelectric constant [43]. Piezoelectric also shows many benefits such as low electromagnetic
including noise, low profile, high power density, and it performs a very high resistive load [34].
In order to choose suitable piezoelectric sensor sensitivity, some parameters must consider in order to
match bandwidth of acoustic signal. In publications [44], [45] were conduct an experiment on
piezoelectric crystal and told that this sensors might be functioning at high temperatures without
failure. Thus, the PZT-on-silicon electromechanical resonators is depending on the odd harmonic of
the outline length-extensional methods to deliver a suitable result for voltage and current
transformations with a single layer of piezoelectric [45].
The alternating current (AC) sensors like in [38] uses a permanent magnet attached to the free end of
the piezoelectric cantilever beam which is combined with the magnetization direction associated with
the mechanical submission direction of the cantilever beam as shown in Figure 3.
Figure 3. Schematic diagram on microelectromechanical (MEMS) piezoelectric cantilever [38].
In[45] presents on experiment in order to prove the concept of test structure was fabricated from a
silicon on insulator (SOI) wafer which has been mentioned that the dimension of wafer by 25 µm
thick silicon device layer, 7 mm of width, 1.2 mm of anchor buried oxide layer and 500 µm thick
layer of handle silicon. However, piezoelectric silicon that is sensing the component is small and
generating the low output voltage, therefore this sensor technology might be mostly matched for
battery operation system [45], [46].
Piezoelectric sensor usually installs at the walls of the transformers tank. Piezoelectric sensors are
commonly used for acoustic detection but have some limitations due to oil-to-tank and tank-to-sensor
interference that making elimination of noise hard[7], [32], [35]. PD acoustic wave bandwidth can
reach 300 kHz with tendency to stay in range of 200 kHz to 300 kHz [22]. Moreover, other reasonable
3ICE4CT 2019 IOP Publishing
Journal of Physics: Conference Series 1432 (2020) 012004 doi:10.1088/1742-6596/1432/1/012004
condition that may impact the acknowledgment rate are concentrated. Publication[7], [31], [46]show
the AE of piezoelectric to get signal for rating the differences considering about various PD areas, oil
temperatures and having a limitation in the obvious pathway of the PD source and the AE sensor. In
publication [36] shows the AE sensor is used at medium voltage and bandwidth range between 100 -
300 kHz and the resonance frequency at 150 kHz.
Additionally, in papers[40], [47] it have been presented an experiment by using piezoelectric material
lead-zirconate-titanate (PZT). This experiment in [41] shows comparison between 2 µm,4 µm, and 10
µm of the model measurement of fabricated PZT-on-silicon piezoelectric. However, for this
experiment it was presented that high frequencies resonant with > 10 MHz for voltage and efficiency
characteristic and also largely focuses on the RF-filtering applications applied on the modelling.
Lastly, in publication [43] presents that the design of MEMs piezoelectric energy harvester has been
studied in order to understand the effect of piezoelectric material performance by using (ZnO), (PZT)
and (AlN). As shown in Figure 4 [37], the piezoelectric energy harvester is made of ZnO between Al
layers which serves as the top and bottom electrodes, respectively. The bottom of the layer is made of
Silicon (Si) substrate as the supporting layer. The dimension is 150 µm length, 50 µm width with 1
µm thickness for each layer.
Figure 4. Cantilever structure which contains of ZnO layer sandwiched between Al layers with bottom [37].
In this experiment result also shows that ZnO piezoelectric energy harvester is the best candidate in
generating maximum output power for the piezoelectric applications as shown in Table 1.
Table 1. The cantilever performance for different piezoelectric material [37].
Piezoelectric Material Displacement Resonance Frequency Electric Potential (V)
(MHz)
ZnO 5.85 x 10⁻⁹ 0.17 9.91
PZT 1.08 x 10⁻¹⁰ 0.15 9.01
AlN 8.66 x 10⁻¹¹ 0.20 9.62
However, piezoelectric devices might be separated into several general classes such as sensors,
actuators, generators, and transducers. Sensors and generator type always be used of the direct
piezoelectric effect, which means it can convert the mechanical energy into electrical signal while
effort of actuators is based on the reverse effect which is by transforming the electrical energy into
mechanical energy show in publication[7], [46], [48]and transducers, both effects are utilized within
the same device. In this publication are focusing on the specific applications and the related outcome.
2. Conclusion
Numerous detection methods on PD in high voltage (HV) like transformers have been covered in this
review paper. The benefits and drawback of each detection methods likes electrical, optical, chemical
and acoustic have been deliberate. Its shows that to monitor and control the high voltage equipment is
very significant for consistency and to get effective process. The example of piezoelectric material
also were discussed and studied on definitions and do some reviewed on other researchers’ projects.
In other ways, the combination of methods proposed in several works can also design a respectable
and appropriate result for on-site PD inspection such as acoustic technique and optical as planned. It is
4ICE4CT 2019 IOP Publishing
Journal of Physics: Conference Series 1432 (2020) 012004 doi:10.1088/1742-6596/1432/1/012004
general to develop ideal system for PD detection and will take time until each method comes to
faultlessness and by following trend of power equipment and devices. There are several types of the
piezoelectric materials, size, and PD frequency range also have been covered in this review. For
example ZnO, PZT and AlN. From the observation, it shows that ZnO material is the best material
because it is friendly to the environment. Lastly, PD also have challenges and one of the most
significant challenges in PD detection is the standardization of the detected signal to reflect the kind
of defection. Even though there are frequent discussions on the techniques by the researchers but there
is still no reliable standards to monitor this process.
Acknowledgments
The authors would like to thank the Ministry of Higher Education Malaysia for financially supported
under the Fundamental Research Grant Scheme (FRGS/1/2018/TK04/UNIMAP/02/14).
References
[1] Karmakar. S and Kalathiripi. H, 2017 Study of partial discharge activity in oil filled needle-plane
electrode using acoustic emission technique and its effect on dielectric liquid2017 IEEE 19th Int.
Conf. Dielectr. Liq. ICDL 2017, 1–4.
[2] Baug .A, Choudhury N. R, Ghosh R, Dalai S, andChatterjee B, 2017, Identification of single and
multiple partial discharge sources by optical method using mathematical morphology aided sparse
representation classifierIEEE Trans. Dielectr. Electr. Insul, 24, 3703–3712.
[3] Coenen S. and Tenbohlen S, 2012 Location of PD sources in power transformers by UHF and
acoustic measurements,IEEE Trans. Dielectr. Electr. Insul,19, 1934–1940.
[4] Sinaga H. H, Phung B. T, and Blackburn T. R, 2012 Partial discharge localization in transformers
using UHF detection method, IEEE Trans. Dielectr. Electr. Insul, 19,1891–1900.
[5] Zhao X, Yao X, Guo Z, Li J, Si W, and Li Y, 2011 Characteristics and development mechanisms
of partial discharge in SF6 gas under impulse voltages,IEEE Trans. Plasma Sci, 39, 668–674.
[6] Rohani M. N. K. H. et al., 2017 Evaluation of Rogowski coil sensor performance using EMTP-
ATP software, 3rd Int. Conf. Electron. Des. ICED, 446–451.
[7] Wang X. Y. et al., 2012 A model for the energy harvesting performance of shear mode
piezoelectric cantilever,Sensors Actuators A Phys., 179, 185–192.
[8] Wang C. C, M. Rohani N. K. H, Isa M, Hassan S. I. Ismail S, B, and Hussin N, 2015, Multi-end
partial discharge location algorithm based on trimmed mean data filtering technique for MV
underground cable, IEEE Student Conf. Res. Dev. SCOReD 2015,345–350.
[9] Búa-Núñez I, Posada-Román J. E, Rubio-Serrano J, and Garcia-Souto J. A, 2014 Instrumentation
system for location of partial discharges using acoustic detection with piezoelectric transducers
and optical fiber sensors, IEEE Trans. Instrum. Meas., 63, 1002–1013.
[10] Yusoff N. A. et al., 2017 Denoising technique for partial discharge signal : AAA comparison
performance between artificial neural network, fast fourier transform and discrete wavelet
transform,PECON 2016 - 2016 IEEE 6th Int. Conf. Power Energy, Conf. Proceeding, 311–316.
[11] Wang Y. B. et al., 2017 Acoustic localization of partial discharge sources in power transformers
using a particle-swarm-optimization-route-searching algorithm,IEEE Trans. Dielectr. Electr. Insul.,
5ICE4CT 2019 IOP Publishing
Journal of Physics: Conference Series 1432 (2020) 012004 doi:10.1088/1742-6596/1432/1/012004
24, 3647–3656.
[12] Antony D. and Punekar G. S, 2018 Noniterative Method for Combined Acoustic-Electrical Partial
Discharge Source Localization,IEEE Trans. Power Deliv.,33, 1679–1688.
[13] Hekmati A. and Hekmati R, 2017 Optimum acoustic sensor placement for partial discharge
allocation in transformers, IET Sci. Meas. Technol., 11, 581–589.
[14] Sikorski W, Siodla K, Moranda H, and Ziomek W, 2012 Location of partial discharge sources in
power transformers based on advanced auscultatory technique,IEEE Trans. Dielectr. Electr. Insul.,
19, 1948–1956.
[15] ZhangW.C, Chen Q. C and Zhao H, 2017 Numerical investigation of acoustic emissions
distribution from partial discharge in transformer,ICEMPE 2017 - 1st Int. Conf. Electr. Mater.
Power Equip., 498–501.
[16] Assagra Y. A. O, Gutnik Y, R. Altafim P, Cavalcanti A. Altafim A. C, 2013 Different piezoelectric
structures applied to acoustic detection of impulse and corona partial discharges,Annu. Rep. -
Conf. Electr. Insul. Dielectr. Phenomena, CEIDP, 18, 1242–1245.
[17] Xie Q, Cheng S, Lü F, and Li Y, 2013, Location of partial discharge in transformer oil using
circular array of ultrasonic sensors,IEEE Trans. Dielectr. Electr. Insul., 20, 1683–1690.
[18] De Castro B. Baptista G, Andreoli A. L, and Ulson J. A. C, 2017, Assessment of Macro Fiber
Composite Sensors for Measurement of Acoustic Partial Discharge Signals in Power
Transformers,IEEE Sens. J., 17, 6090–6099.
[19] Umemura T, Nakamura HikitaS, M, Maeda T, and Higashiyama M, 2013, Partial discharges of
small-air-gap in cast-resin insulation system,IEEE Trans. Dielectr. Electr. Insul., 20, 255–261.
[20] Kundu P, N. Kishore K, and A. Sinha K, 2012, Identification of two simultaneous partial discharge
sources in an oil-pressboard insulation system using acoustic emission techniques,Appl. Acoust.,
73, 395–401.
[21] Mukhtaruddin A, Isa M, Adzman M. R,Hasan S. I. S, M.Rohani N. K. H, and Yii C. C, 2016
Techniques on partial discharge detection and location determination in power transformer,2016
3rd Int. Conf. Electron. Des. ICED 2016, 16,537–542.
[22] Schwarz R. and Muhr M, Modern technologies in optical partial discharge detection, 2013,Annu.
Rep. - Conf. Electr. Insul. Dielectr. Phenomena, CEIDP.
[23] Hsieh J. C. et al., 2012, The application of partial discharge detector and electro-acoustic signals
analysis methods for power cables monitoring,Proc. 2012 IEEE Int. Conf. Cond. Monit. Diagnosis,
C. 2012, 157–160.
[24] Lin T. and Zhou Q, 218, Fault location of cable insulation based on acoustic - Magnetic
synchronization method, Proc. IEEE Int. Conf. Prop. Appl. Dielectr. Mater., 704–708.
[25] Hamadi S. H. K. et al., 2018, Evaluation of denoising performance indices for noisy partial
discharge signal based on DWT technique,IEEE Student Conf. Res. Dev. Inspiring Technol.
Humanit. SCOReD 2017 - Proc., 392–397.
6ICE4CT 2019 IOP Publishing
Journal of Physics: Conference Series 1432 (2020) 012004 doi:10.1088/1742-6596/1432/1/012004
[26] Harbaji M, Shaban K, and El-Hag A, 2015, Classification of common partial discharge types in
oil-paper insulation system using acoustic signals,IEEE Trans. Dielectr. Electr. Insul.,22, 1674–
1683.
[27] De Assumpção Ribeiro B, Werneck M, and Da Silva-Neto J. L, 2013 Novel optimization
algorithm to demodulate a PZT-FBG sensor in AC high voltage measurements,IEEE Sens. J., 13,
1259–1264.
[28] Wu M, Cao H, Cao J, Nguyen H. L,Gomes J. B, and Krishnaswamy S. P, 2015 An overview of
state-of-the-art partial discharge analysis techniques for condition monitoring,IEEE Electr. Insul.
Mag., 31, 22–35.
[29] Predl F, Guo W, Hoek S, and Krger M, 2015, Combining acoustic and electrical methods to locate
partial discharge in a power transformer,Proc. IEEE Int. Conf. Prop. Appl. Dielectr. Mater., 424–
427.
[30] Yii C. C, Rohani M. N. K. H, Isa M, and Hassan S. I. S, Multi-end PD location algorithm using
segmented correlation and trimmed mean data filtering techniques for MV Underground
Cable,IEEE Trans. Dielectr. Electr. Insul., 24, 92–98.
[31] Lima S. E. U. et al.,2010, Mandrel-based fiber-optic sensors for acoustic detection of partial
dischargesa proof of concept, IEEE Trans. Power Deliv.,25, 2526–2534.
[32] Fuangsoongnern U, Plueksawan W, and Tikakosol K, 2014, A measurement technique to identify
and locate partial discharge in transformer with AE and HFCT, IEEE Innov. Smart Grid Technol. -
Asia, ISGT ASIA 2014, 108–113.
[33] Yang B. et al., 2012, Piezoelectric MEMS low-level vibration energy harvester with PMN-PT
single crystal cantilever,Electron. Lett., 48, 784.
[34] Li H, Tian C, and Deng Z. D, 2014, Energy harvesting from low frequency applications using
piezoelectric materials,Appl. Phys. Rev., 1, 0–20.
[35] Bedair S. S, Pulskamp J. S, Polcawich R. G, Martin B. J. L, and Power B, 2013, Thin-film
piezoelectric-on-silicon resonant transformers,J. Microelectromechanical Syst., 22, 1383–1394
[36] Lee M, Kim C, Park W, Cho J, Paik J, and Jeong Y. H, 2019, Energy harvesting performance of
unimorph piezoelectric cantilever generator using interdigitated electrode lead zirconate titanate
laminate,Energy, 179, 373–382.
[37] Jamain U. M, Ibrahim N. H, and Rahim R. A, 2014, Performance analysis of zinc oxide
piezoelectric MEMS energy harvester,IEEE Int. Conf. Semicond. Electron. Proceedings, ICSE,
263–266.
[38] Zbigniew O. et al., 2014, A MEMS silicon-based piezoelectric AC current sensor, Procedia Eng.,
87, 1457–1460.
[39] Zu H, Wu H, and Wang Q. M, 2016, High-Temperature Piezoelectric Crystals for Acoustic Wave
Sensor Applications,IEEE Trans. Ultrason. Ferroelectr. Freq. Control, 63, 486–505.
7ICE4CT 2019 IOP Publishing
Journal of Physics: Conference Series 1432 (2020) 012004 doi:10.1088/1742-6596/1432/1/012004
[40] Jiang X, Kim K, Zhang S, J. Johnson, and G. Salazar, 2013, High-temperature piezoelectric
sensing,Sensors (Switzerland),14, 144–169.
[41] Tian Y, Li H, Ke Y, Yuan C, and He S, 2016, P-Matrix Analysis of Surface Acoustic Waves in
Piezoelectric Phononic Crystals,IEEE Trans. Ultrason. Ferroelectr. Freq. Control, 63, 757–763.
[42] Rosmi A. S, Isa M, Ismail B, Rohani M. N. K. H, and Wahab Y, 2018, An Optimization of
Electrical Output Power for Piezoelectric Energy Harvester using Different Micro-Cantilever
Beam Geometries, J. Phys. Conf. Ser.,1019.
[43] Tajitsu Y, 2014, Piezoelectric polymers, in Soft Actuators: Materials, Modeling, Applications,
and Future Perspectives.
[44] Krishnasamy M, Upadrashta D, Yang Y, and Lenka T. R, 2018, Distributed parameter modelling
of cutout 2-DOF cantilevered piezo-magneto-elastic energy harvesterJ.Microelectromechanical
Syst., 27,1160–1170.
[45] Kabir M, Kazari H, and Ozevin D, 2018, Piezoelectric MEMS acoustic emission sensors,Sensors
Actuators, A Phys., 279, 53–64.
[46] ZhaoQ, Liu Y, Wang L, Yang H, and Cao D, 2018, Design method for piezoelectric cantilever
beam structure under low frequency condition,Int. J. Pavement Res. Technol., 11, 153–159.
[47] Chopra , Nigam K, and Pandey S, 2016, Modelling and Simulation of Piezoelectric Cantilevers in
RF MEMS Devices for Energy Harvesting Applications,Proc. - UKSim-AMSS 17th Int. Conf.
Comput. Model. Simulation, UKSim 2015, 414–419.
[48] Sivakumar N, Kanagasabapathy H, and Srikanth H. P, 2018, Analysis of Perforated Piezoelectric
Sandwich Smart Structure Cantilever Beam Using COMSOL,Mater. Today Proc., 5, 12025–
12034.
8You can also read