AN APPLICATION METHOD OF LONG SHORT-TERM MEMORY NEURAL NETWORK IN CLASSIFYING ENGLISH AND TAGALOG-BASED CUSTOMER COMPLAINTS, FEEDBACKS, AND ...
←
→
Page content transcription
If your browser does not render page correctly, please read the page content below
International Journal on Information Technologies & Security, № 1 (vol. 13), 2021        89

 AN APPLICATION METHOD OF LONG SHORT-TERM
   MEMORY NEURAL NETWORK IN CLASSIFYING
    ENGLISH AND TAGALOG-BASED CUSTOMER
 COMPLAINTS, FEEDBACKS, AND COMMENDATIONS
                                 Ralph Sherwin A. Corpuz *
                       Technological University of the Philippines
                                      Philippines
         * Corresponding Author, e-mail: ralphsherwin_corpuz@tup.edu.ph

     Abstract: Classifying unstructured text data written in natural languages is a
     cumbersome task, and this is even worse in cases of vast datasets with multiple
     languages. In this paper, the author explored the utilization of Long Short-Term
     Neural Network (LSTM) in designing a classification model that can learn text
     patterns and classify English and Tagalog-based complaints, feedbacks and
     commendations of customers in the context of a state university in the
     Philippines. Results shown that the LSTM has its best training accuracy of
     91.67% and elapsed time of 34s when it is tuned with 50 word embedding size
     and 50 hidden units. The study found that the lesser the number of hidden units
     in the network correlates to a higher classification accuracy and faster training
     time, but word embedding size has no correlation to the classification
     performance. Furthermore, results of actual testing proven that the proposed
     text classification model was able to predict 19 out of 20 test data correctly,
     hence, 95% classification accuracy. This means that the method conducted was
     effective in realizing the primary outcome of the study. This paper is part of a
     series of studies that employs machine and deep learning techniques toward the
     improvement of data analytics in a Quality Management System (QMS).
     Key words: Long Short-Term Memory, Deep Learning, Neural Network,
     Text Classification, Natural Language Processing, Customer Satisfaction.

     1. INTRODUCTION
     In the era of the so-called Fourth Industrial Revolution (4IR), organizations are
constantly challenged to remain relevant with their visions and missions, particularly
in consistently delivering quality products and services. This challenge is likewise
evident in the case of state universities, wherein the satisfaction of students, parents,
research and industry partners, including the regulatory bodies are considered crucial
toward effective management of their core and support processes and toward the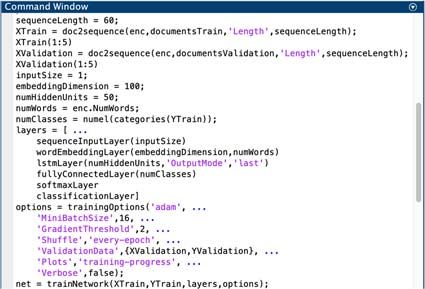
90             International Journal on Information Technologies & Security, № 1, (vol. 13), 2021

identification of areas for improvements [1]. For this purpose, state universities
deploy various methods to determine, monitor, and evaluate customer satisfaction
(CS), such as paper-based or online customer surveys, group discussions, and face-
to-face or telephone interviews [2]. Among these methods, the most-widely used are
the CS surveys, which usually have a Likert scale with set of questionnaires and a
section used to capture feedbacks, commendations, or complaints of customers.
While the numerical data are easily interpretable as measure of CS, the texts written
in natural languages by customers are meaningful since they give direct insights on
customer preferences, emotions or extent of satisfaction or dissatisfaction on the
quality of product of services they received or experienced [3].
      On the other hand, however, these text data are unstructured and highly
dimensional to be analyzed computationally. Hence, this is where natural language
processing (NLP) techniques, such as text classification, are explored in order to
automate text analysis and prediction [3, 4]. Text classification is a process of
labelling texts according to learned combination of feature sets (inputs) and their
corresponding classes (outputs) [5]. Initially, each input text is converted into
numerical vectors in order to extract only the meaningful features. Afterwards, a
feature engineering technique is used to manipulate the features while an algorithm
is used to design, train, and validate a proposed text classification model.
Consequently, the resulting model learns text patterns then classifies texts
automatically. Through effective text classification models, CS reports can now be
generated faster and more accurately due to lesser-to-no human errors. Hence, text
classification is considered an indispensable NLP application due to its capability to
optimize manpower efforts, time, costs, and operational resources, and it is even
more useful in cases of multiple datasets and languages. [6, 7]. For state universities,
these results equate to a timelier response to the needs and expectations of customers
and faster decision-making of the administrators toward the continual improvement
of its processes, services, and products – quality curricular programs, research and
extension projects.
      One of the most robust and popular algorithms used in multitude of
classification applications is the Long Short-Term Memory Neural Network
(LSTM), which is considered as the most popular type of Recurrent Neural Network
(RNN). LSTM is capable of addressing vanishing gradients, which is the main
problem of RNN and other neural networks. In this case, it works by learning long-
term dependencies between time steps of sequence data through the use of memory
cell that remembers certain information over random time intervals, and gates that
regulate the flow of information into and out of the memory cell [8]. Shown on Fig.
1 is a sample architecture of an LSTM layer. The direction of the arrows illustrates
how the time series “i” flow based on features “F” and length “S”. In every time step
“t”, the values of “ot” and “ct” denote the output or hidden state, and the cell state of
the LSTM layer, respectively.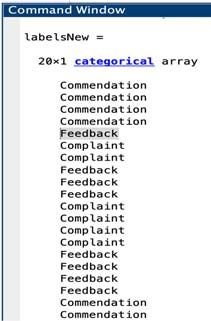
International Journal on Information Technologies & Security, № 1 (vol. 13), 2021     91

                            Figure 1. LSTM Layer Architecture
      The basic unit of an LSTM layer is called a memory cell or a block. In block 1,
for instance, the LSTM computes the first hidden state and updated cell state through
its initial state and the first time step of the sequence. The LSTM then utilizes the
current step of the network “ct-1 , ot-1” and the next time step of the sequence in order
to compute for the hidden state “ot” and the updated cell state “ct”. Both the hidden
state and cell state form-part of the LSTM layer state. The output of the LSTM layer
is made-up of the hidden state for every particular time step “t”. The information
learned from the previous time steps are stored in the cell state. The LSTM layer
then adds or removes information to and from the cell state in every time step, and
controls this information through its gates. Illustrated further on Fig. 2 are the
components of a sample LSTM block composed of 4 gates, namely: (1) input gate
“ig” that controls the updates; (2) forget gate “fg” that resets the cell state; (3) cell
candidate “cc” that adds information to the cell state; and (4) output gate “og” that
controls the level of cell state as added to the hidden state.

                            Figure 2. LSTM Block Components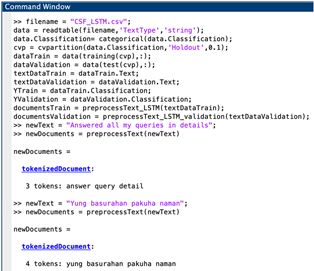
92             International Journal on Information Technologies & Security, № 1, (vol. 13), 2021

     Each gate of an LSTM layer learns information through its input weights “IW”,
recurrent weights “RW”, and bias “b”, as expressed further in the following
concatenated matrices:

                                   ,                    ,            ,                        1

    The cell state at time step “t” is expressed in the following formula. The
symbols “⊙” is equivalent to the Hadamard product of vectors:
                                        ⊙                   ⊙                                 2
    Meanwhile, the hidden state at time step “t” is determined by the following
formula:
                                               ⊙                                              3
where “σc” is the gate activation function computed by the sigmoid function:
                                              1                                               4
     The following formulas are used to further describe the components of the time
step “t” for each input gate, forget gate, cell candidate, and output gate, respectively:
                                                                                      5
                                                                                              6
                                                                                              7
                                                                                   8
     There is a wide-range of research papers related to the application of LSTM in
text classification. LSTM has shown satisfactory performance in classifying patent
documents [9], hotel sentiment analysis [10], settlement tweets [11], and healthcare
documents [12]. As compared with other algorithms, LSTM has been found to have
better accuracy than k-Nearest Neighbors (KNN), Naïve Bayes, Convolutional
Neural Network (CNN), and other traditional training algorithms [9], [13], [14], [15].
However, there is a dearth of research studies related to the implementation of LSTM
in classifying feedbacks, complaints, and commendations written in English and
Tagalog languages. Specifically, the motivation of this paper focused in
understanding the effects of manipulating hyper-parameters to enhance the
learnability of a proposed text classification model. This study is one of its kind in
the context of a state university in the Philippines. The resulting model is expected
to be of help in automating classification of massive CS datasets, hence, expediting
the generation of timely and accurate CS reports and related documents.
International Journal on Information Technologies & Security, № 1 (vol. 13), 2021 93
2. METHODOLOGY
2.1. Pre-processing
The author utilized the CS dataset from the Technological University of the
Philippines – Manila, Philippines as of May 30, 2020. Illustrated on Fig. 3 is a
screenshot of the 244 dataset composed of feedbacks (97), complaints (33), and
commendations (114) written in English and Tagalog languages. In the dataset, the
“text” were used as input and the “classification” as output. For the entire course of
the study, the author employed MATLAB R2020a application in a 2.5 GHz, Intel
Core i5 CPU with 8GB 1600 MHz DDR3 RAM.
Figure 3. Sample Dataset Written in English and Tagalog-English Languages
The author then partitioned 90% of the total dataset for training and 10% for
validation. Afterwards, the author pre-processed the dataset in order to extract only
the most useful features. At this phase, the author converted the unstructured, raw
texts into tokenized documents or string of words called tokens. The author then
normalized, lemmatized the tokenized documents into their root forms; removed the
stop words, punctuations, words with less than 2 or more than 15 characters, special
characters, and HTML and XML tags. A sample result of preprocessing is reflected
on Fig. 4a. As shown, an English commendation “The staff are very friendly and
approachable” is trimmed down into “staff friendly approachable” with a total of
3 tokens. Another is a Tagalog feedback “Yung basurahan pakuha naman” (“kindly
get the garbage”) which is trimmed into “yung basurahan pakuha naman” with a
total of 4 tokens. Meanwhile, Fig. 4b shows sample results of preprocessing of 5
English and 5 Tagalog datasets used during training and validation. It is noted that
Tagalog texts generally has more tokenized words due to translation constraints of
the function built-in the MATLAB.94 International Journal on Information Technologies & Security, № 1, (vol. 13), 2021
Figure 4a. Preprocessing function Figure 4b. Sample processing results
2.2. LSTM Text Classification Model Design
After pre-processing, the author then set the target length of each tokenized
document into “60” since majority of the tokenized documents have 60 tokens. The
author then left-padded those documents with lesser than 60 and truncated those with
greater than it. This technique was employed in both training and validation datasets.
Subsequently, the author utilized a feature engineering technique called
wordEncoding (WE) in order to convert the tokenized documents into sequences of
numeric indices. Shown on Fig. 5a is the WE function that generated a total of 1119
vocabularies called NumWords. In Fig. 5b, these NumWords are converted into their
equivalent numerical indices, for instance “answer”, “query”, and “detail” are
translated into 218, 199, and 219 indices; and then “yung (that)”, “basurahan (bin)”,
“pakuha (get)”, and “naman (please)” are converted into 147, 167, 168, and 169
indices, respectively. Lastly, Fig. 5c shows the mapping of sample NumWords with
sequence of indices from 147 to 169, and another from 199 to 220. These sequence
of indices facilitates in resolving the vanishing gradient problems of text data, hence,
they help improve the learning capabilities of the LSTM.
(a) 1119 NumWords (b) Numerical indices (c) Index sequences
Figure 5. Word Encoding function and results
Shown on Fig. 6a is the architecture of the proposed classification model
composed of (1) an input sequence which has 1119 numeric indices as results of
word encoding and preprocessing. Each input sequence has length size of 60 and
mini batch size of 16; (2) a WE layer which sets the dimension size “d” to either 25,
50, 100 or 200; (3) a LSTM layer which controls the number of hidden units “o” toInternational Journal on Information Technologies & Security, № 1 (vol. 13), 2021 95
either 25, 50, 100 or 200; (4) a fully connected layer, which multiplies the input by
a weight matrix and adds a bias vector; (5) a softmax layer, which uses the softmax
function; and lastly, (5) a classification output layer which predicts the correct class
of based in cross entropy loss for multi-classification. On the other hand, Fig. 6b
shows the actual function used to implement the LSTM architecture in the
MATLAB.
(a) Architecture
(b) Function
Figure 6. LSTM Text Classification Model Design
The softmax function of the classification model is expressed in the following
formula [16]:
, ,
, , (9)
∑ , ∑ ,
where 0 ≤ S (cp|x,θ) ≤ 1; ∑ S c | x, θ 1; ap = ln (S(x,θ|cp) S(cp); S(x,θ|cp) is
the conditional probability of the sample given class “p” and “S(cp)” is the class prior
probability. Meanwhile the cross-entropy loss function is expressed further as [16]:
∑ ∑ ln , (10)96 International Journal on Information Technologies & Security, № 1, (vol. 13), 2021
where “N” is the number of datasets, “K” is the number of classes, “tij” is the
indicator that the “ith” dataset belongs to the “jth” class, and “yij” is the output for
dataset “i" for class “j”, which in this case, the value from the softmax function.
After the design of the classification model, the author set the solver to Adaptive
Moment Estimation (Adam) [17] then trained the LSTM for 30 epochs with gradient
threshold of 1 and initial learning rate of 0.01.
2.3. Training and Testing
After the modelling, the author evaluated the performance of the text
classification model in terms of training accuracy using the following formula [18],
[19], [20]:
11
where “acc” is the classification accuracy rating; “TP” is the number of true positive;
“TN” is the number of true negative; “FP” is the number of false positive; and “FN”
is the number of false negative. Afterwards, the results were further mapped out
using confusion matrix through the MATLAB software. During training, the author
tuned various hyper-parameters such as word embedding dimension size and number
of hidden units in the LSTM layer in order to determine their correlations to the
proposed model. After the training, the author then tested the model by using 20
randomly-selected commendations, complaints, and feedbacks written in either
English or Tagalog. This was done to determine the level of effectiveness of the
model based on actual implementation.
3. RESULTS AND DISCUSSION
Shown on Table 1 is the summary of performance of the LSTM during training,
in consideration of the effects of the hyper-parameters manipulated. As such, the best
performance of the LSTM model was recorded at 91.67% training accuracy with
confusion error of 8.30% and elapsed time of 34s. This was made possible when the
neural network was set with 50 word embedding dimensions and 50 hidden units.
Table 1. LSTM Training Performance Summary
Embedding Hidden Accuracy (%) Confusion Error Elapsed
Dimension Units (%) Time (s)
25 25 70.83 29.17 28
25 50 75.00 25.00 22
25 100 79.20 20.80 39
25 200 66.67 33.30 60
50 25 70.83 29.17 19
50 50 91.67 8.30 34
50 100 66.67 33.30 37International Journal on Information Technologies & Security, № 1 (vol. 13), 2021 97
50 200 62.50 37.50 58
100 25 75.00 25.00 20
100 50 83.33 16.67 26
100 100 79.17 20.8 47
100 200 66.67 33.33 86
200 25 83.33 16.67 26
200 50 79.17 20.83 35
200 100 75.00 25.00 51
200 200 66.67 33.33 83
Fig. 7 and 8 elucidate the best training progress and confusion matrix of the text
classification model during training, respectively. As shown, it performed best with
390 iterations during training and 50 iterations during validation.
11 0 0 100%
Commendation
45.8% 0.0% 0.0% 0.0%
0 2 0 100%
Complaint
0.0% 8.3% 0.0% 0.0%
1 1 9 81.8%
Feedback
4.2% 4.2% 37.5% 18.2%
91.7% 66.7% 100% 91.7%
8.3% 33.3% 0.0% 8.3%
t
ck
n
in
tio
ba
p la
da
ed
m
en
Co
Fe
m
m
Co
Figure 7. Best Training Progress Figure 8. Best Confusion Matrix
Moreover, the results of statistical analysis shown that there is strong, negative
correlation between the number of hidden units and the classification accuracy,
which is statistically significant at r = -.642, n=16, p=.007. This means that the lesser
the number of hidden units are used, the higher is the training accuracy of the model.
On the other hand, however, there is a strong, positive correlation between the
number of hidden units and the elapsed time wherein r=.923, n=16, p=.000. This
means that while the number of hidden units is increased, the training elapsed time
is increased or the training time is slowed down. Interestingly, there is no significant
correlation between the word embedding dimension and training classification
accuracy or elapsed time.98 International Journal on Information Technologies & Security, № 1, (vol. 13), 2021
Table 2. Pearson R Correlation Results
Accuracy Elapsed Time
Word Embedding Pearson r .171 .236
Dimension Sig. (2-tailed) .526 .380
N 16 16
No. of Hidden Pearson r -.642** .923**
Units Sig. (2-tailed) .007 .000
N 16 16
Note: ** - correlation is significant at 0.01 level (2-tailed)
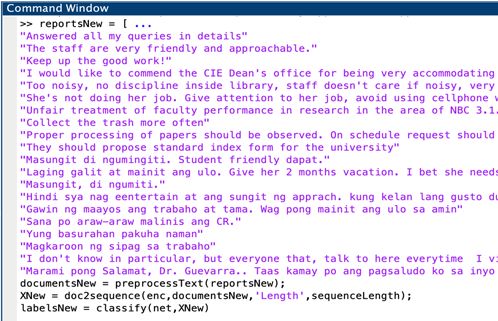
After training, the author then deployed the “best” LSTM text classification
model into an actual implementation in order to validate its performance.
Specifically, Fig. 9a shows the function used to classify the test dataset composed of
20-randomly selected commendations, feedbacks, and complaints written in English
and Tagalog languages. The results of testing are shown on Fig. 9b. Out of 20 test
data, the proposed model correctly classified 19/20 or equivalent to a 95% testing
classification accuracy. The incorrect classification of a “feedback”, which should
have been a “complaint”, is highlighted in gray. Nonetheless, all these results proved
that the use of LSTM in the design of a proposed text classification model is effective
in realizing the intended outcomes of the study.
(a) Function (b) Results
Figure 9. LSTM Text Classification Model Actual Testing
4. CONCLUSION
In the context of the study, LSTM was found to have its best training
classification accuracy of 91.67%, confusion error of 8.30% and elapsed time of 34s.
This was achieved when the hyper-parameters were tuned with 50 word embedding
dimensions and 50 hidden units of the LSTM layer. Based on the results of Pearson
r correlation, the study found that the number of hidden units has strong positiveInternational Journal on Information Technologies & Security, № 1 (vol. 13), 2021 99
correlation with accuracy, and at the same time negative correlation with elapsed
time during the training. This means that the lesser the hidden units are used in the
design, the higher is the training classification accuracy and the faster is the elapsed
time. On the other hand, the study found that tuning the word embedding size has no
significant correlation with training accuracy and elapsed time. The proposed text
classification model was found to be effective with 95% classification accuracy as
implemented during testing. Future research should focus in adding more datasets to
enhance its deep learning capabilities and to accurately determine the causal
relationship between hyper-parameters and training performance. Moreover, future
studies should compare the performance of the LSTM with other algorithms in the
same context of application. Hence, in a subsequent study, the author compared the
LSTM with another popular algorithm, the Support Vector Machine (SVM) [21].
REFERENCES
[1] International Organization for Standardization. ISO 9001:2015 - Quality management
systems – Requirements. 2015, Available: https://www.iso.org/standard/62085.html
[2] International Organization for Standardization. ISO 10004:2018 - Quality management
– Customer Satisfaction – Guidelines for monitoring and measuring. 2018, Available:
https://www.iso.org/standard/71582.html
[3] Zablith, F. and Osman, I. ReviewModus: Text classification and sentiment prediction of
unstructured reviews using a hybrid combination of machine learning and evaluation
models. Applied Mathematical Modelling, vol. 71, 2019, pp. 569-583.
[4] Al-Smadi, M., Qawasmeh, O., Al-Ayoyoub, M., Jararweh, Y. and Gupta, B. Deep
recurrent neural network vs. support vector machine for aspect-based sentiment analysis of
Arabic hotel’s reviews. Journal of Computational Science, vol. 27, 2018, pp. 386-393.
[5] Sebastiani, F. Machine learning in automated text categorization. ACM Computing
Surveys, 1 (vol. 34), 2002, pp. 1-47.
[6] Qing, L., Linhong, W. and Xuehai, D. A novel neural network-based method for
medical text classification, Future Internet, 255 (vol. 11), 2019, pp. 1-13.
[7] Gopalakrishnan, V. and Ramaswamy, C. Patient opinion mining to analyze drugs
satisfaction using supervised learning. Journal of Applied Research and Technology, 4 (vol.
15), 2017, pp. 311-319.
[8] Hochreiter, S. and Schmidhuber, J. Long short-term memory. Neural Computation, 8
(vol. 9), 1997, pp. 1735-1780.
[9] Xiao, L., Wang, G. and Zuo, Y. Research on patent text classification based on
word2vec and LSTM. Proc. of the 11th International Symposium on Computational
Intelligence and Design (ISCID), China, December 2018, pp. 71-74
[10] Khotimah, D.A.K. and Sarno, R. Sentiment analysis of hotel aspect using probabilistic
latent semantic analysis, word embedding and LSTM. International Journal of Intelligent
Engineering and Systems, 4 (vol. 12), 2019, pp. 275-290.100 International Journal on Information Technologies & Security, № 1, (vol. 13), 2021 [11] Huang, R., Taubenbock, H., Mou, L. and Zhu, X.X. Classification of settlement types from tweets using LDA and LSTM. in IEEE, editors. Proc. of the 2018 IEEE International Geoscience and Remote Sensing Symposium (IGARSS), Spain, July 2018, pp. 6408-6411. [12] Hu, Y., Wen, G., Ma, J., Wang, C., Lu, H. and Huan, E. Label-indicator morpheme growth on LSTM for Chinese healthcare question department classification. Journal of Biomedical Informatics, vol. 82, 2018, pp.154-168. [13] Luan, Y. and Lin, S. 2019. Research on Text Classification Based on CNN and LSTM. Proc. of the 2019 IEEE International Conference on Artificial Intelligence and Computer Applications (ICAICA), China, March 2019, 2019, pp. 352-354. [14] Gharibshah, Z., Zhu, X., Hainline, A. and Conway, M.. Deep learning for user interest and response prediction in online display advertising. Data Science and Engineering, 26 (vol. 5), 2020, pp. 12-26. [15] Wang, J., Liu, T-W., Luo, X. and Wang, L. 2018. An LSTM approach to short text sentiment classification with word embeddings. Prof. of the 30th Conference on Computational Linguistics and Speech Processing (ROCLING 2018), Taiwan, October 2018, pp. 214-223. [16] Bishop, C. M. Pattern Recognition and Machine Learning. Springer, New York, NY, USA, 2006. [17] Kingma, D. and Ba, J. (2015). Adam: A method for stochastic optimization. Available: https://arxiv.org/abs/1412.6980 [18] Sokolova, M., and Lapalme, G. A systematic analysis of performance measures for classification tasks. Information Processing & Management, 4 (vol. 45), 2009, pp. 427– 437, doi:10.1016/j.ipm.2009.03.002 [19] Corpuz, R.S.A. ISO 9001:2015 risk-based thinking. Makara Journal of Technology, 3 (vol. 24), 2020, article in press. Available: https://www.researchgate.net/publication/344179808 [20] Tharwat, A. Classification assessment methods. Applied Computing and Informatics, 2018, doi: 10.1016/j.aci.2018.08.003. [21] Corpuz, R.S.A. Categorizing natural language-based customer satisfaction: an implementation method using support vector machine and long short-term memory neural network. International Journal of Integrated Engineering, article in press. Available: https://www.researchgate.net/publication/346380361 Information about the author: Dr. Ralph Sherwin A. Corpuz currently serves as the Director of Quality Assurance and Associate Professor 3 of the Electronics Engineering Technology Department at the Technological University of the Philippines, Manila, Philippines. His research interests include applied artificial intelligence, robotics, embedded systems, technology management, and smart cities. Manuscript received on 26 October 2020
You can also read