Graph Self Supervised Learning: the BT, the HSIC, and the VICReg
←
→
Page content transcription
If your browser does not render page correctly, please read the page content below
Graph Self Supervised Learning: the BT, the HSIC, and the VICReg

                                                                                               Sayan Nag
                                                                                          University of Toronto
                                                                                       nagsayan112358@gmail.com

                                                                 Abstract                                 tasks, or as an auxiliary training task that enhances the per-
arXiv:2105.12247v3 [cs.LG] 1 Jul 2021

                                                                                                          formance of main tasks. SSL has shown promising results in
                                             Self-supervised learning and pre-training strategies         the field of computer visions using cnns [Chen and He, 2020;
                                             have developed over the last few years especially            Caron et al., 2020; Goyal et al., 2021; Caron et al., 2021;
                                             for Convolutional Neural Networks (CNNs). Re-                Grill et al., 2020; He et al., 2020; Chen et al., 2020;
                                             cently application of such methods can also be no-           Jaiswal et al., 2021] as well as with graph neural net-
                                             ticed for Graph Neural Networks (GNNs) . In this             works [Zhu et al., 2021; Hassani and Khasahmadi, 2020;
                                             paper, we have used a graph based self-supervised            Thakoor et al., 2021; Zhu et al., 2020; Velickovic et al., 2019;
                                             learning strategy with different loss functions (Bar-        Peng et al., 2020; Sun et al., 2019; Chen et al., 2020;
                                             low Twins[Zbontar et al., 2021], HSIC[Tsai et al.,           Xie et al., 2021].
                                             2021], VICReg[Bardes et al., 2021]) which have                  The primary contributions of this paper are:
                                             shown promising results when applied with CNNs
                                             previously. We have also proposed a hybrid loss                  1. We have used four different loss functions namely Bar-
                                             function combining the advantages of VICReg and                     low Twins Loss, HSIC Loss, VICReg Loss and pro-
                                             HSIC and called it as VICRegHSIC. The perfor-                       posed hybrid VICRegHSIC Loss in the Graph based
                                             mance of these aforementioned methods have been                     SSL paradigm and have compared their perfomances on
                                             compared when applied to different datasets such                    node classification tasks. To the best of our knowledge
                                             as MUTAG, PROTEINS and IMDB-Binary. More-                           it is the first work where Graph SSL has been used with
                                             over, the impact of different batch sizes, projector                such loss functions.
                                             dimensions and data augmentation strategies have                 2. We have also demonstrated the impacts of different
                                             also been explored.                                                 batch sizes, data augmentations and projector dimen-
                                                                                                                 sions on the aforementioned losses.
                                        1   Introduction                                                     This work shows some preliminary analyses and results
                                                                                                          and more experiments will be done in the future for different
                                        A mainstream way of training a deep neural network is to feed     datasets and tasks to provide a better understanding of GNNs
                                        some input in order to get certain desirable outputs. Such a      for SSL.
                                        training is better known as supervised learning in which a
                                        sufficient amount of input data and label pairs are fed to the
                                        model depending on its complexity. However, such a method
                                                                                                          2     Related Work
                                        calls for a large number of labels thereby rendering the super-   Self-supervised learning has gained a lot of momentum nowa-
                                        vised learning scheme practically inapplicable in many appli-     days. It is being applied more in computer vision tasks
                                        cations because of the unavailability of such large annotated     [Jaiswal et al., 2021]. Barlow Twins is one such self-
                                        datasets. Dataset labeling not only comes with huge over-         supervised learning framework which tries to maximize the
                                        head costs, but also can be biased depending on certain cir-      agreement between two learned representations of a pair of
                                        cumstances. Thus a need for a better learning strategy led        distorted inputs with a novel Barlow Twins loss function
                                        to the advent and thereby adoption of self-supervised learn-      having an invariance term and a redundancy reduction term
                                        ing (SSL) which enables the training of models on unlabeled       [Zbontar et al., 2021]. Using Hilbert-Schmidt Independence
                                        data. This removes the burden of labeling and therefore it        Criterion, the authors in [Tsai et al., 2021] introduced a mod-
                                        is an efficient and lucrative approach. In the presence of a      ification to Barlow Twins Loss by altering the off-diagonal
                                        handful of labeled data, using SSL strategy representations       component of the empirical cross-correlation matrix. Using
                                        from the remaining unlabeled data can be learnt. Now, the         such a negative-sample-free contrastive approach, the authors
                                        same can be used as a pre-training procedure after which          claimed that the representations learnt will be superior. VI-
                                        labeled data are used to fine-tune the pre-trained models.        CReg [Bardes et al., 2021] uses the Barlow Twins’ mecha-
                                        These fine-tuned models can either be used for downstream         nism of decorrelation without any normalization in its loss
function. Furthermore, it can prevent dimension collapse 4. Attribute Masking: In this case, vertex attributes are
with the variance regularization term. masked to ensure that the model recovers those masked
On the other hand contrastive methods like SIMCLR [Chen vertex attributes using the neighbouring structure assum-
et al., 2020] use positive and negative sample pairs in their ing that there exists a certain extent of semantic robust-
frameworks. More can be found in the survey paper [Jaiswal ness against losing partial attributes.
et al., 2021]. Self-supervised learning has also been imple-
The influences of the node-dropping, subgraph, edge-
mented for graph neural netorks. Methods like [Velickovic
perturbation and attribute-masking factors on the perfor-
et al., 2019; Peng et al., 2020; Sun et al., 2019] use con-
mance of the algorithm will be shown in the results section.
trasting views between nodes and graph whereas [Zhu et al.,
2021; Hassani and Khasahmadi, 2020; Thakoor et al., 2021; 3.2 Framework
Zhu et al., 2020] use contrasting views between nodes and
subgraphs and structurally transformed graphs. [Qiu et al., In this section a graph self-supervised learning framework is
2020] uses contrasting views among subgraphs whilst [You porposed for self-supervised pre-training of GNNs. In such a
et al., 2020] used such contrasting views between subgraphs paradigm, the agreement between an augmented pair of repre-
and transformed graphs via random augmentations. [Xie et sentations of the same graph is maximized using a loss func-
al., 2021] provides an excellent review of such state-of-the- tion as illustrated in the Figure 1. The entire paradigm is com-
art methods. The field is rapidly advancing with promising posed of four parts as follows:
results and we hope to witness more such advancements in 1. Data Augmentation: For a certain graph, two aug-
the future. mented versions are obtained as a pair after applying
transformations on the actual graph.
3 Methods
2. Encoder: A graph encoder is used to extract a pair of
A standard procedure for self-supervised learning for graphs graph-level representations for the corresponding pair of
includes graph data augmentation in order to create a pair of augmented graphs.
graphs, then finding the representations using a graph encoder
followed by a projection head and finally using a loss func- 3. Projection Head: A non-linear projection head (a two-
tion to maximize agreement between the pair of representa- layer perceptron in this case) is used to map the pair of
tions. The aforesaid paradigm has been represented in the augmented graph-level representations to a latent space
Figure 1 where the projection head is not shown separately for applying the loss function.
and can be considered to be existing in tandem with the en- 4. Loss Function: A self-supervised loss function is used
coder. The method sections comprises of two primary sub- to maximize the agreement between the pair of latent
sections, namely, the data augmentation strategies as well as representations obtained as outputs from the projection
the Self-Supervised Learning framework. head.
3.1 Data Augmentation Methods for Graphs In our work we have used four different self-supervised
loss functions which include the Barlow-Twin (BT) loss
In data analysis studies, data augmentation is a well- function as mentioned in [Zbontar et al., 2021] (given
established technique which aims at increasing the amount by LBT ), the 2 Hilbert-Schmidt Independence Crite-
of data by applying certain transformation strategies on the rion (HSIC) loss function mentioned in [Tsai et al.,
already existing data without modifying the semantics label. 2021] (given by HSICSSL ), the Variance-Invariance-
In standard machine learning practices, it is used to reduce CovarianceRegularization (VICReg) loss function men-
over-fitting of the model, thus enhancing the generalizability tioned in [Bardes et al., 2021], and finally a hybrid of the
of the model during predictions. For, graphs, the authors in aforementioned VICReg loss and HSIC loss. In the hy-
[You et al., 2020] have explored certain graph-level augmen- brid loss we have just modifed the on- and off-diagonal
tations which are summarized in the table 1. For fair compar- terms of the covariance component of the VICReg as
isons, in our work we have followed the augmentations used explained in [Tsai et al., 2021] For the algorithm for the
by the authors which are explained as follows: proposed VICRegHSIC loss, please refer to Algorithm
1. Node Dropping: For a certain graph, certain portion of 1.
vertices can be randomly dropped along with their asso-
ciated connections. The missing part of vertices, how-
ever, does not alter the semantics of the graph. Augmentation Methods Type
2. Subgraph: A subgraph is sampled from the main graph Node Dropping (ND) Nodes
using a random walk algorithm [You et al., 2020] with
Subgraph (SG) Nodes, Edges
the underlying assumption that the local structure is able
to hint the full semantics. Edge Perturbation (EP) Edges
3. Edge Perturbation: The connectivities of edges are Attribute Masking (AM) Edges
perturbed by randomly introducing or discarding a cer-
tain proportion of them. The underlying prior in this
case is that the graph has a certain degree of semantic Table 1: Data Augmentation methods for graphs.
robustness to the connectivity variations.Figure 1: A standard paradigm of graph based self-supervised learning. Graph augmentations on input graph GI resulted in two trans-
formed graphs GA (via node-dropping augmentation) and GB (via attribute-masking augmentation) following each transformation T . A
self-supervised loss is then computed between the encoded representations zA and zB in order to maximize the agreement.
4 Experiments and Analysis
For our work we have considered different datasets such
as MUTAG, PROTEINS and IMDB-Binary for node-
classification tasks. In this section we will showcase the im-
pacts of various augmentations, batch sizes as well as dimen-
sions of the projection head.
4.1 Impact of Data Augmentations on Graph SSL
Figure 3: Impact of different graph data augmentations on linear
evaluation test accuracy
on PROTEINS
Figure 2: Impact of different graph data augmentations on linear
evaluation test accuracy on MUTAG
The Figure 2 shows that for MUTAG dataset the perfor-
mance of all the the methods drop (except for VICregHSIC)
when edge peturbation was added to node drop and subgraph.
However, the performance increased again with addition of
attribute masking to the previous subset. For VICregHSIC
the performance kept on increasing with the addition of aug-
mentations.
The Figure 3 shows that for PROTEINS dataset the per-
formance of all the the methods drop when edge peturbation Figure 4: Impact of different graph data augmentations on linear
was added to node drop and subgraph. However, the perfor- evaluation test accuracy on PROTEINS
mance increased again with addition of attribute masking to
the previous subset.The Figure 4 shows that for PROTEINS dataset, removing
the data augmentations reduces the performance, i.e., with
all the four augmentations the performance is the maximum.
This means that once all the aforesaid augmentations are ap-
plied, it enforces the model to learn representations invariant
to the desired perturbations in a better way through minimiz-
ing the self-supervised loss among the augmented pairs.
It may be worth noting that edge perturbation leads to
a decrease in performance overall for both PROTEINS and
MUTAG. This because for biomolecules datasets, the seman-
tics are less robust against connectivity variations [You et al.,
2020]. Edge perturbations in such biomolecule datasets cre-
ate modifications (addition or removal) of intermediate cova- Figure 7: Impact of attribute masking augmentations on linear eval-
uation test accuracy on PROTEINS
lent bonds leading to radical alterations in the identities, com-
position and properties of chemical compounds. This affects
the down-stream performance which is reflected in the above compound. On the other hand, increasing the masking fac-
figures. tor for attribute masking augmentation leads to an increase
in performance confirming the fact that the semantic robust-
ness against losing partial attributes due to masking has been
preserved (Figure 7).
Figure 5: Impact of node dropping augmentations on linear evalua-
tion test accuracy on PROTEINS
Node dropping augmentation have been seen to be useful
in the biomolecule dataset like PROTEINS (Figure 5). This
indicates that missing vertices, for example, certain atoms in
the chemical compounds (graphs) does not alter the seman-
tics.
Figure 8: Impact of batch sizes on linear evaluation test accuracy on
MUTAG
The Figure 8 shows that for MUTAG dataset increase in
batch size for a projector dimension of 80 leads to a decrease
in performance. However, increasing the projector dimension
from 80 to 160 reverses the effect of increasing batch size and
all except HSIC gives better performance. This is consistent
Figure 6: Impact of subgraph augmentations on linear evaluation with the performance of HSIC as demonstrated in [Tsai et al.,
test accuracy on PROTEINS 2021]. For this analysis, we have considered data augmenta-
tions Node Drop and Subgraph together in the augmentation
Unlike what has been claimed in [You et al., 2020] sub- pool.
graph augmentation has reduced the performance of the al- The Figure 9 shows that for MUTAG dataset increase in
gorithm drasctially with the increasing in the factor (Figure projector dimension for both the batch sizes leads to an in-
6). This indicates that for biomolecule datasets local structure crease in performance. It is more pronounced in batch size 64
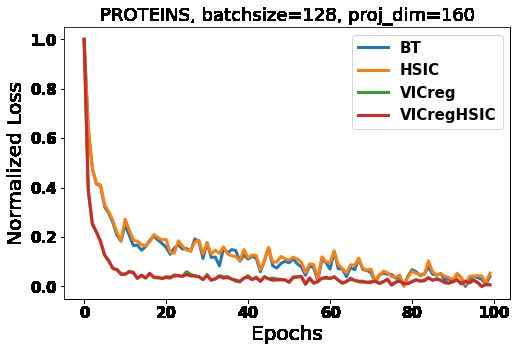
is always not able to hint the full semantics of the chemical and can be assumed that with even further increase in batchFigure 11: Normalized training loss curves (for representation pur-
poses) for 100 epochs showing performance of different methods on
PROTEINS dataset.
Methods MUTAG PROTEINS IMDB-B
InfoGraph [Sun et al., 2019] 89.13 74.48 73.05
GCL [You et al., 2020] 86.98 74.43 72.21
GBT 89.41 76.12 72.50
Figure 9: Impact of projector dimensions on linear evaluation test GHSIC 88.68 76.08 71.93
accuracy on MUTAG GReg 88.83 76.37 72.9
GVICRegHSIC 90.05 76.35 73.2
sizes the impact will be more. For this illustration, we have
considered data augmentations Node Drop and Subgraph to- Table 2: Linear Evaluation Test Accuracy scores between state-of-
gether in the augmentation pool. the-art methods.
Networks. This is a first of its kind study with Graph Neu-
ral Networks and Barlow Twins and similar loss functions
like HSIC, VICReg and the proposed VICRegHSIC. In the
proposed graph supervised learning framework for GNN pre-
training we have compared these aforementioned loss func-
tions to facilitate robust representation learning invariant to
perturbations via agreement maximization between the pair
of augmented representations. We have also analyzed the im-
pact of several data augmentation strategies like node drop-
ping and attribute masking in our proposed framework and
have noticed that considering all the augmentations together
Figure 10: Impact of batch size on linear evaluation test accuracy on gives the best results in terms of generalizability and robust-
PROTEINS ness. In the future, more experiments need to be conducted
to better understand the performance of these algorithms on
Increase in the batchsize as shown in figure 10 leads to an a variety of other datasets. Further modifications of the loss
increase in accuracy for PROTEINS with a few exceptions. functions, data augmentation strategies as well as the frame-
The Figure 11 demonstrates the performance of different work could lead to more efficient solutions and even better
methods on the PROTEINS dataset when trained for 100 performances in the domain of graph self-supervised learn-
epochs. Faster convergence is observed for VICReg and VI- ing.
CRegHSIC. The training loss curves have been normalized
for representation and comparison purposes. A Algorithm
Linear Evaluation Test Accuracy scores between different
state-of-the-art methods show that the proposed VICRegH-
SIC loss function gives the best accuracy score in 2 out of 3
cases.
5 Conclusion and Future Works
In this paper, we study the performances of different loss
functions for self-supervised pre-training of Graph NeuralAlgorithm 1: PyTorch-style pseudocode for VI- References
CRegHSIC [Bardes et al., 2021] Adrien Bardes, Jean Ponce, and Yann
# f: Graph Encoder LeCun. Vicreg: Variance-invariance-covariance regu-
# λ, µ, ν: coefficients of the larization for self-supervised learning. arXiv preprint
# invariance, variance and arXiv:2105.04906, 2021.
# covariance losses [Caron et al., 2020] Mathilde Caron, Ishan Misra, Julien
# N: batch size Mairal, Priya Goyal, Piotr Bojanowski, and Armand
# D: representation dimension Joulin. Unsupervised learning of visual features
# mseloss: Mean square error loss by contrasting cluster assignments. arXiv preprint
# offdiagonal: off-diagonal arXiv:2006.09882, 2020.
# elements of a matrix
[Caron et al., 2021] Mathilde Caron, Hugo Touvron, Ishan
# relu: ReLU activation function
# G: Actual Graph Misra, Hervé Jégou, Julien Mairal, Piotr Bojanowski, and
# augment: augmentation function Armand Joulin. Emerging properties in self-supervised
# VICRegHSIC: proposed vision transformers. arXiv preprint arXiv:2104.14294,
# self-supervised loss function 2021.
def VICRegHSIC(G, augment) [Chen and He, 2020] Xinlei Chen and Kaiming He. Explor-
# load a batch with N samples ing simple siamese representation learning. arXiv preprint
for x in loader: arXiv:2011.10566, 2020.
GA , GB = augment(G) # two [Chen et al., 2020] Ting Chen, Simon Kornblith, Moham-
# randomly augmented versions mad Norouzi, and Geoffrey Hinton. A simple framework
# of G for contrastive learning of visual representations. In In-
zA = f(GA ) # N x D ternational conference on machine learning, pages 1597–
# representation 1607. PMLR, 2020.
zB = f(GB ) # N x D
[Goyal et al., 2021] Priya Goyal, Mathilde Caron, Benjamin
# representation
# Lefaudeux, Min Xu, Pengchao Wang, Vivek Pai, Mannat
# invariance loss Singh, Vitaliy Liptchinsky, Ishan Misra, Armand Joulin,
simloss = mseloss(zA , zB ) et al. Self-supervised pretraining of visual features in the
# wild. arXiv preprint arXiv:2103.01988, 2021.
# variance loss [Grill et al., 2020] Jean-Bastien Grill, Florian Strub, Flo-
stdzA = rent Altché, Corentin Tallec, Pierre H Richemond, Elena
torch.sqrt(zA .var(dim=0) + Buchatskaya, Carl Doersch, Bernardo Avila Pires, Zhao-
1e-04) han Daniel Guo, Mohammad Gheshlaghi Azar, et al. Boot-
stdzB = strap your own latent: A new approach to self-supervised
torch.sqrt(zB .var(dim=0) + learning. arXiv preprint arXiv:2006.07733, 2020.
1e-04) [Hassani and Khasahmadi, 2020] Kaveh Hassani and
stdloss = Amir Hosein Khasahmadi. Contrastive multi-view repre-
torch.mean(relu(1-stdzA)) + sentation learning on graphs. In International Conference
torch.mean(relu(1-stdzB)) on Machine Learning, pages 4116–4126. PMLR, 2020.
#
# covariance loss [He et al., 2020] Kaiming He, Haoqi Fan, Yuxin Wu, Sain-
zA = zA - zA .mean(dim=0) ing Xie, and Ross Girshick. Momentum contrast for un-
zB = zB - zB .mean(dim=0) supervised visual representation learning. In Proceedings
covzA = (zA .T @ zA )/(N - 1) of the IEEE/CVF Conference on Computer Vision and Pat-
covzB = (zB .T @ zB )/(N - 1) tern Recognition, pages 9729–9738, 2020.
covloss = offdiagonal(covzA) [Jaiswal et al., 2021] Ashish Jaiswal, Ashwin Ramesh Babu,
.add (1).pow (2).sum()/D Mohammad Zaki Zadeh, Debapriya Banerjee, and Fillia
covloss += offdiagonal(covzB) Makedon. A survey on contrastive self-supervised learn-
.add (1).pow (2).sum()/D ing. Technologies, 9(1):2, 2021.
# [Peng et al., 2020] Zhen Peng, Wenbing Huang, Minnan
# loss Luo, Qinghua Zheng, Yu Rong, Tingyang Xu, and Jun-
VICRegHSICloss = λ * simloss + zhou Huang. Graph representation learning via graphical
µ * stdloss + ν * covloss mutual information maximization. In Proceedings of The
# optimization step Web Conference 2020, pages 259–270, 2020.
VICRegHSICloss.backward()
optimizer.step() [Qiu et al., 2020] Jiezhong Qiu, Qibin Chen, Yuxiao Dong,
return VICRegHSICloss Jing Zhang, Hongxia Yang, Ming Ding, Kuansan Wang,
and Jie Tang. Gcc: Graph contrastive coding for graphneural network pre-training. In Proceedings of the 26th ACM SIGKDD International Conference on Knowledge Discovery & Data Mining, pages 1150–1160, 2020. [Sun et al., 2019] Fan-Yun Sun, Jordan Hoffmann, Vikas Verma, and Jian Tang. Infograph: Unsupervised and semi-supervised graph-level representation learning via mutual information maximization. arXiv preprint arXiv:1908.01000, 2019. [Thakoor et al., 2021] Shantanu Thakoor, Corentin Tallec, Mohammad Gheshlaghi Azar, Rémi Munos, Petar Veličković, and Michal Valko. Bootstrapped representa- tion learning on graphs. arXiv preprint arXiv:2102.06514, 2021. [Tsai et al., 2021] Yao-Hung Hubert Tsai, Shaojie Bai, Louis-Philippe Morency, and Ruslan Salakhutdinov. A note on connecting barlow twins with negative- sample-free contrastive learning. arXiv preprint arXiv:2104.13712, 2021. [Velickovic et al., 2019] Petar Velickovic, William Fedus, William L Hamilton, Pietro Liò, Yoshua Bengio, and R Devon Hjelm. Deep graph infomax. In ICLR (Poster), 2019. [Xie et al., 2021] Yaochen Xie, Zhao Xu, Jingtun Zhang, Zhengyang Wang, and Shuiwang Ji. Self-supervised learn- ing of graph neural networks: A unified review. arXiv preprint arXiv:2102.10757, 2021. [You et al., 2020] Yuning You, Tianlong Chen, Yongduo Sui, Ting Chen, Zhangyang Wang, and Yang Shen. Graph con- trastive learning with augmentations. Advances in Neural Information Processing Systems, 33, 2020. [Zbontar et al., 2021] Jure Zbontar, Li Jing, Ishan Misra, Yann LeCun, and Stéphane Deny. Barlow twins: Self- supervised learning via redundancy reduction. arXiv preprint arXiv:2103.03230, 2021. [Zhu et al., 2020] Yanqiao Zhu, Yichen Xu, Feng Yu, Qiang Liu, Shu Wu, and Liang Wang. Deep graph contrastive representation learning. arXiv preprint arXiv:2006.04131, 2020. [Zhu et al., 2021] Yanqiao Zhu, Yichen Xu, Feng Yu, Qiang Liu, Shu Wu, and Liang Wang. Graph contrastive learning with adaptive augmentation. In Proceedings of the Web Conference 2021, pages 2069–2080, 2021.
You can also read