NENC ICS - Strategic Workforce Planning - Workforce Transformation and Strategy Board Development Session - October 2019 - The Whole ...
←
→
Page content transcription
If your browser does not render page correctly, please read the page content below

NENC ICS – Strategic Workforce
          Planning
   Workforce Transformation and
   Strategy Board Development
      Session – October 2019

                 1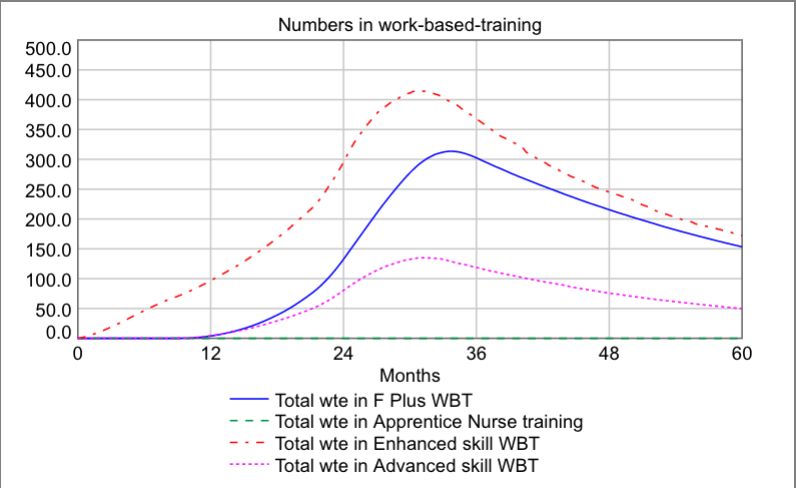
Objectives for the session
1. To review the context and approach to strategic
   workforce planning.
2. To provide the Board with feedback from the ICP
   workshops – both content and the discussions that
   emerged.
3. To facilitate a conversation about next steps.

                             2
Ambitions for transformation &
workforce
Making NENC ‘the best place to work in Health and Care…’
• A vision and understanding of the shape of future needs and services;
• A well coordinated, integrated but flexible plan, understood and embraced
  across the system – collaboration as opposed to competition;
• Staff working flexibly in response to patient needs;
• Appropriate centralising of specialist services;
• Forming new relationships with HEI providers at an ICP level;
• Attracting and retaining workforce in areas of specific need through innovative,
  flexible and system-based employment opportunities where appropriate
• Technology that is applied in a coordinated way enabling solutions that meet
  clinical needs, are interoperable and portable and that are supported by their
  own workforce.

                                          3
NENC ICS – Strategic Workforce
Planning
The development of a Strategic
Workforce Planning Approach
4Context setting
• The ICS provides a unique opportunity to take a step back from
the acknowledged challenges of the day-to-day;
• The Long Term Plan and associated People Plan provide a
platform, but genuinely working as a system needs more than a
plan – it’s a different way of thinking and behaving;
• We therefore invited each ICP to engage in a conversation about
how to develop a strategic approach to workforce planning
across the system;
• The work contributes to the development of system working at a
critical time and will feed into the narrative for the Long Term
Plan.
5Workforce futures
• ‘Traditional’ workforce planning looks at gaps in our current
establishments and tries to work out how we can fill them, which
has potential short-comings:
üThe fact that there are gaps perhaps suggests that we haven’t
done our workforce planning effectively in the past, so we’re at risk
of repeating our error;
üCurrent establishments reflect current service models, which we
are often looking to change, so planning to fill current gaps risks
consolidating what we are looking to transform;
üNew roles become ‘add-ons’ instead of providing an opportunity to
transform the mix of skills in future service provision.
• We therefore need a complementary strategic approach that
reduces the risk of gaps in the workforce in future...
6Microscopes & helicopters
What population health needs will we need to address in the
future, and what outcomes do we want to achieve?
How will services have been transformed to meet these needs?
Getting the lay of the land
How do we fill our current vacancies and stem the tide of ever increasing
demand whilst also preparing the workforce for an increasingly integrated
and digitized service environment?
7A population health led approach
– the care function cube
Care Each segment of the cube
requires a workforce that is
molded to cohort needs, the
en e
ip &
n
on re
m ar
t io
cr is
sp ca
Pl ion
at d c
care functions being delivered
t
e s os
en
se
re ent
Cohort
tre nne
t
pr a gn
ev
and the setting, whilst at the
g
Pr
a
Di
Ur
same time:
Severely frail • Population health needs are
changing;
• Services are being re-
Multiple
modeled;
/complex needs
• The settings where care is
delivered are evolving.
Single conditions
Hospital
Local facility
t
Healthy
ex
Long term care
nt
At home
Co
8The SWiPe framework
• The SWiPe framework is part of a toolkit that enables local partners
to join bits of the jigsaw into a bigger picture:
ü Underlying population health needs, and how these will change
over time;
ü Service transformation, and how things will look different in the
future;
ü The workforce transformation necessary to respond to these
challenges.
• The main concepts used to facilitate this are:
ü Care functions, that combine a number of tasks and activities into a
coherent ‘episode’ or level of support irrespective of provider
organisation, i.e. focussed on needs;
ü Workforce skill levels (foundation, core, enhanced and advanced) that
again focusses on need rather than professional groups.
9Professional roles & skill
levels
• The use of skill levels as part of this process does not negate
the need to plan for the training and development of specific
professional groups;
• It does, however, enable discussion and appropriate
challenge, for example with respect to:
ü The potential to substitute roles appropriately, for example Nursing or
Physician Associates;
ü Creating the space for the development of new roles, for example
care navigators or flexible workers;
ü Allows for some degree of alignment across health and social care as
well as recognising the skills and contributions of the wider
independent and voluntary sector, carers and ‘expert patients’, i.e. the
self-care dimension.
10For example – urgent care
Reducing
Integrated
/avoiding Appropriate
Reduces level Neighbourhood Working
of demand POD
Pro-active care &
case management – Need
supporting self care Diverts resolved UTC/A&E
demand
Community Ambulatory
Mental Primary response to
Health Crisis care hubs Em Care
urgent care need
Urgent care
UTC ED
need
Need Hear &
resolved Treat Admission (including
See & Treat the Emergency
Assessment Unit)
Community Pharmacy, Need
resolved
111 & CAS
11Links to demand and
capacity work
• Demand and capacity modelling, and the subsequent ‘ask’ of the
workforce, is often undertaken ‘in the light of’ demographic changes but
without a clear audit trail between the two;
• The relatively short-term nature of planning means that recent trends in
activity dominate future plans;
• However, transformation goals are designed to address trends in
demand that often outstrip genuine underlying changes in population
health need, so planning on the basis of recent trend for the medium to
long term is not appropriate;
• The approach taken here is to root future workforce requirements in
underlying population health needs, modified further by service
transformation goals.
12Discussion
How do we best support and enable a strategic, population health led
approach to workforce planning?
13NENC ICS – Strategic Workforce
Planning
Summary of content from the ICP
workshops
14Process
• The WSP team interviewed sixteen system leaders and fed their
perspectives into the subsequent workshops (see associated report for
details);
• During September 2019 we ran four workshops that engaged with
c.150 people;
• In parallel we obtained and shaped workforce data from ESR, Skills for
Care and NHS Digital to provide an overview of the ‘as is’ workforce –
shaping this by skill level and workstream as well as by sector;
• The content of the workshops included an overview of the approach
being adopted; ICP summaries of the as-is workforce; worked
examples of a workforce futures approach.
15Data sources
• To create the following workforce overview we have identified wte
workforce in post from:
ü An extract from the HEE ESR data warehouse for all Trusts in the ICS (March
‘19);
ü A set of Skills for Care data for adult social services previously obtained for
the NE STP and organised by CCG, plus a supplementary set of data on fte
in the social care workforce (2017/18);
ü A download from NHS Digital for the General Practice workforce (March ‘19).
• The data provides information on professional roles, areas of work,
geographical location and age band;
• We have used these fields to generate additional ways in which to
organise the data, including skill level, workstream and organisation type.
16General Practice
workforce and population
Total workforce (excl Practice Mgrs and Estates) = 7,040wte (NHS Digital, March 2019)
South Central North West
Total General Practic Workforce: 2590.8 1437.6 2230.7 780.9
South & Central ICPs are ‘under-doctored’ (GPs) compared
to the North & West…
Pop/GP wte
2,300 But, when taking other workforce into account, including
Advanced Practitioners, the South ICP has above the average
2,200
for the ICS and the North is under-provided for:
2,100
Distance from NENC average pop/wte
2,000
15.0%
1,900
10.0%
1,800
5.0%
1,700
South Central North West 0.0%
South Central North West
-5.0%
-10.0%
Pop/GP wte Pop/Autonomous wte Pop/total wte
17The adult social care
workforce
wte workforce in the Independent Sector
30,000 77,515wte estimate of Independent Sector
25,000 workforce…
20,000
15,000
10,000
5,000
And 9,146wte employed by the LA
0
Central North South West
Direct care 216.7 674.3 469.6 91.6 wte workforce employed by the LA
Social worker 8.8 19.4 22.1 7.3
3,500
Registered nurse 489.2 980.1 981.2 244.8
Other 1,799.8 3,373.1 3,652.7 830.9 3,000
Management 962.4 2,019.4 1,852.8 651.2 2,500
Community support 488.4 2,139.9 811.2 201.8 2,000
Care worker 10,921.5 18,517.8 19,576.4 5,408.3
1,500
AHP/Therapists 16.1 35.3 39.0 12.7
1,000
500
0
Central North South West
Direct care 20.0 129.0 85.0 0.0
Social worker 234.0 331.0 527.0 161.0
Registered nurse 0.0 0.0 0.0 0.0
Other 246.0 570.0 505.0 284.0
Management 226.0 312.0 446.0 245.0
Community support 304.0 336.0 562.0 13.0
Care worker 181.0 1,191.0 931.0 1,076.0
AHP/Therapists 84.0 28.0 95.0 24.0
18NHS Trust workforce
% of NHS workforce in different settings
2.5%
• Two thirds of the workforce is based in an
acute hospital setting;
18.1%
1.5% • We have defined ‘community’ as locations
10.9% withPatient flows to NHS
Trusts
• To ensure strategic workforce modelling for each ICP population maps to NHS
Trust workforce capacity, particularly for hospital/acute sector activity, we have
undertaken some preliminary analysis on HES data provided by PHE;
• We have reflected the ‘points of delivery’ (PoDs) in use in the Strategic Planning
Tool that supports the implementation of the Long Term Plan (A&E, First OP
appt, elective and non-elective admissions) in which there is an expectation of
alignment between activity, finance and workforce projections;
• We have then shaped the data by ICP and the NHS Trusts based in each ICP;
• The workforce data has the potential to be shaped in similar ways to the POD
activity (see the ‘wagon wheel’ later in this presentation) leading to greater
clarity on the links between activity, workforce and therefore potential
transformation;
• The activity flow by ICP NHS Trust & CCG is illustrated on the following slides.
20Patient flows to NHS
Trusts – summary
Urgent care: Planned care:
A&E (Type 1&2) Non-elective adms: First OP appts: Elective admission
West ICP 96% local Trusts with 93% local Trusts, 4% 83% local Trusts, 11% 76% local Trusts, 17%
3% outside of ICS to North ICP Trusts to North ICP Trusts to North ICP Trusts
and 2% outside of ICS and 5% outside of ICS and 6% outside of ICS
North ICP 96% local Trusts with 98% local Trusts with 88% local Trusts, 9% 96% local Trusts and
2% to Central ICP 1% to Central ICP to South ICP Trusts 3% outside of ICP
Trusts and 2% outside Trusts and 1% outside and 1% outside of ICP
of ICP of ICP
Central ICP 88% local Trusts, 10% 87% local Trusts, 11% 74% local Trusts, 14% 73% local Trusts, 21%
to North ICP Trusts to North ICP Trusts, to North ICP Trusts, to North ICP Trusts
and 2% outside of ICP 1% to South ICP Trusts 10% to South ICP and 5% outside of ICP
and 1% outside of ICP Trusts and 3% outside
of ICP
South ICP* 91% ‘local’ Trusts, 2% 69% local Trusts, 28% 58% local Trusts, 30% 66% local Trusts, 19%
to North ICP Trusts to Central ICP Trusts to Central ICP Trusts, to Central ICP Trusts,
and 7% outside of ICP and 2% outside of ICP 2% to North ICP Trusts 4% to North ICP Trusts
& 10% outside of ICP & 11% outside of ICP
[* Note: South ICP CCGs includes all flows to Durham & Darlington Trust.]
21Whole workforce – the
big picture
An in-scope workforce of c.175,000wte
Total wte workforce
70,000
60,000
50,000 With variation in the distribution by
40,000 sector across the four ICP areas…
30,000
20,000 Share of workforce compared to the population of multiple,
10,000 complex and frail needs
0 100%
11.3% 10.6% 9.8% 9.6%
South Central North West 90% 19.7%
80%
General Practice NHS Trusts 32.2%
70% 31.5% 35.8%
41.6%
Local Authority Adult Services Independent Sector 31.7%
60%
50%
21.7% 20.8% 19.2%
40% 17.8% 14.2%
30%
20% 36.4%
35.6% 30.8% 34.5% 35.4%
10%
0%
Multiple, GP & other NHS Trust LA employed Independent
complex and advanced skill community wte adult social care care Sector
frail population wte
South Central North West
22The nursing slice…
Headline figure: 24,087 wte employed in NHS Trusts and the
Independent Social Care Sector.
Total Nursing & Midwifery workfroce in NHS and
Independent Social Care Sector
Area of work in wte
12,000
10,000
8,000
& % split:
6,000
100%
4,000 90%
2,000 80%
70%
0
60%
South Central North West
50%
C&YP Community adult health Ind Sector
40%
Maternity MH/LD Acute/other
30%
20%
10%
0%
South Central North West
C&YP Community adult health Ind Sector
Maternity MH/LD Acute/other
23Age profiles & system net
gain or loss
% of workforce over 55
% by 5yr age bands % >55 45%
40%
West 3.8% 11.4% 10.7% 11.3% 11.4% 14.6% 16.5% 12.4% 6.4% 20.3% 35%
30%
25%
North 6.0% 13.3% 13.2% 10.4% 12.5% 14.4% 15.9% 9.6% 4.0% 14.4% 20%
15%
Central 3.3% 11.7% 11.7% 10.4% 13.4% 16.0% 16.6% 10.6% 5.3% 16.9% 10%
5%
0%
South 4.2% 12.7% 12.5% 12.7% 12.9% 14.4% 15.0% 10.1% 4.5%
15.7% C&YP Community Ind Sector Maternity MH/LD Acute/other
adult health
0% 10% 20% 30% 40% 50% 60% 70% 80% 90% 100%
Net gain or loss by 5yr age band
Under 25 25 to 29 30 to 34 35 to 39 40 to 44 45 to 49
150.0
50 to 54 55 to 59 60 to 64 65 to 69 Over 70
100.0
50.0
0.0
Under 25 to 30 to 35 to 40 to 45 to 50 to 55 to 60 to 65 to Over
25 29 34 39 44 49 54 59 64 69 70
-50.0
-100.0
-150.0
South Central North West
24ICP workforce ‘distinctives’
• West ICP – more GPs per head of population commensurate with higher levels
of frailty and complex needs; greater reliance on LA staff for adult social care;
reliance on an ‘external’ workforce as patient flows cross the A69; the oldest
age profile for qualified nursing.
• North ICP – workforce in the acute sector reflects patient flows; the General
Practice workforce has a higher than ICS average of salaried GPs and therefore
of GPs as a whole; the Independent Sector adult social care workforce is
relatively high compared to other NENC ICPs.
• Central ICP – a relatively low % of the General Practice workforce that are GPs
but a compensating higher level of other advanced practitioners; compared to
other ICPs Central has the lowest proportion of workforce capacity in each
sector.
• South ICP – the population per GP is the highest in the ICS although there are
high numbers of advanced practitioners; the proportion of the workforce in
the South in all other sectors is below the ICS average.
25Developing insights for
training and development
• Each ICP workshop was presented with a view on what a
workforce transformation journey might look like, given future
population health needs and service transformation goals, for:
üThe ‘core’ neighbourhood community health teams;
üThe General Practice workforce.
• This was aggregated up to an ICS level as an illustration of how
the approach could better inform discussions with HEI
providers...
26The training and development
challenge – Neighbourhood Teams
For the care functions and
workforce in-scope for
Neighbourhood Teams, used as an
example in this material, we have
used our career progression model
to estimate the size of the training
cohorts as workforce is upskilled and
turnover is replaced across the ICS…
ICS-wide training and development needs
27Discussion
• How should the data inform strategies at ICS and ICP levels...
28NENC ICS – Strategic Workforce
Planning
Feedback from ICP workshops
29Workshop feedback -
achievements
• External evidence:
ü CQC recognition of well led, caring and safe staff;
ü National awards for workforce attraction strategies;
ü Positive GMC training scores;
ü Results from the staff survey across the North East – best engagement of
staff;
ü Opening of the Sunderland medical school.
• Workshop feedback:
ü Many examples of the development of new roles across the system;
ü Collaboration across traditional boundaries is in evidence;
ü Some areas of recruitment success stories.
30Workshop feedback -
challenges
• Balancing day-to-day challenges with the need to take the long-
view;
• Making progress brings it’s own challenges, particularly in
resourcing and supporting the wide range of placements
necessary as services transform;
• Whilst front-line services are progressing toward greater
integration some of the supporting infrastructure and processes
are lagging behind, e.g. in finance, HR or technology;
• The expectations of staff in relation to careers, training and
flexible working bring both challenges and opportunities –
having the right conversation is key.
31Workshop feedback – learning
and insights from the data
• The need to understand attrition from the training pipeline e.g. for GPs to
improve recruitment and retention;
• Examining what possibilities for delaying post 55 retirement in e.g. nursing
and extending the valuable contribution of those who have extensive
experience to offer;
• Although the data may be inadequate for more detailed purposes, the main
thrust of the SWiPe ‘helicopter view’ process should raise the right questions
and direction of travel, which can be supplemented and taken forward with
more detailed, locally driven data;
• Bringing together the whole Health and Social Care workforce at ICP/S level
and in the delivery of specific services helps highlight the opportunities for
transformation and varying skill mix;
• The recognition of independent, 3rd sector and the volunteer capacity should
be factored in.
32Workshop feedback – areas for
developing our understanding
• Inclusion of perspectives on locums, agency and bank, as well as vacancy
information to give a fuller picture of the overall workforce;
• Developing the link between service activity, finance and workforce;
• National comparators could be accessed in addition to the IPC based
comparisons;
• Identifying new data sets where they have significant leverage in the
implications for future services, for example for the wider primary care
workforce;
• Looking to update and ratify the social care dataset;
• There are other demand drivers as well as population growth that is affecting
current demand that could be recognised in the base for future projections;
• A better understanding of the reasons for staff behaviours around flexibility
and retention.
33A new start?
• At each of the workshops people were presented with a framework for
developing a more strategic and system-wide approach to workforce planning
for key areas of service;
• Much work is underway in areas such as specialist services and evidence from
the workshops clearly demonstrates that people are solving some of the key
challenges through innovative and collaborative working;
• However, there remains uncertainty about whether the progress being made
is ‘enough’, and pressures continue to be felt;
• Complementing this with continued work to develop the strategic framing of
the workforce challenge therefore gives assurance of the overall direction of
travel; gives permission to people in the system to continue to realise the
overall vision to make the NENC ICS the best place to work; and provides an
important link to the wider demand and capacity work that is the
responsibility of the ICS and the ICPs.
34What next?
• A development programme for strategic workforce planning needs to
continue to impact on the system at different levels but with the overall
goal of greater integration into wider strategic and transformation
planning and delivery;
• Building on experience elsewhere, the feedback from the engagement
sessions (and the KPMG ‘readiness’ work?) we would suggest the
following:
1. A focus on one or more workstreams (i.e. bottom or middle-up planning);
2. Continuing to refine the ‘top-down’ mapping with a particular goal in the
short term to align and make transparent the relationship between
activity, finance and workforce;
3. Enhancing and sharing the data in ways that enable key planners in the
system to access and use the outputs.
35Programme area 1
• The application of the approach to a workstream(s) transformation
programme(s), perhaps for a recognised vulnerable service, where it will
be important to ensure that both immediate challenges are addressed and
a longer term sustainable workforce needs to be secured, consisting of:
ü The selection of appropriate workstream area(s) where there is existing or the
potential for good clinical/professional engagement;
ü Understanding the intended service transformation and the workforce
dependencies;
ü Develop a ‘workforce futures’ care function and skill mix map to reflect the
new service model including new ways of working and the adoption of
appropriate technologies;
ü Gathering additional data relevant to the workstream including intelligence
on the use of temporary staff and any staff groups not currently included;
ü Building/using models as the basis for engagement with the key stakeholders
in order to develop the strategic workforce plan.
36Programme area 2
• The workforce data gathered to inform the initial phase of work also
provides the basis on which to develop a system rather than
organisational perspective on the relationship between activity, finance
and workforce – this programme area would therefore:
ü Shape the existing workforce data to reflect the Long Term Plan ‘Points of
Delivery’ activity plans taking system-level assumptions for activity shifts as
our starting point;
ü Use the population health drivers and high level transformation
assumptions to sense-check future demand trajectories;
ü Establish a working group to explore the costing approach for activity and
workforce across the system for key workstreams and PODs;
ü Develop a system perspective by ICP on the contribution that workforce
transformation makes to overall activity and financial plans.
37Programme area 3
• The system has invested in sharing, shaping and exploring a rich set of
workforce data – this programme area would respect that openness by
developing views of that data as a way of ‘giving-back’ to the system by:
ü Establishing a small working group of data owners to review the use of
workforce data as a system resource and to make proposals for ongoing
sharing and use of this data;
ü Seek any necessary permissions for the continued sharing, use and access to
data as part of the ICS Strategic Workforce Planning programme;
ü Develop tools as appropriate for both data mining, representation and use
in the context of the strategic workforce planning programme.
38Discussion
39You can also read