COVID-19 - ITALY MARCH 19th 2020 - Omnicom Media Group

Page created by Nathan Pham
 
CONTINUE READING
COVID-19 - ITALY MARCH 19th 2020 - Omnicom Media Group
COVID-19 - ITALY
MARCH 19th 2020
COVID-19 - ITALY MARCH 19th 2020 - Omnicom Media Group
CONTENTS

1. SITUATION UPDATE

2. MEDIA DYNAMICS

3. CONSUMERS POINT OF VIEW

4. BRAND REACTIONS

                             2
COVID-19 - ITALY MARCH 19th 2020 - Omnicom Media Group
1. SITUATION UPDATE
COVID-19 - ITALY MARCH 19th 2020 - Omnicom Media Group
Italy - key events and timeline
                                           JANUARY / FEBRUARY 2020                                                                       MARCH 2020

           •    JAN 29th – first two Italian cases (Chinese tourists) in Rome                            •   MAR W/O 2nd – the alert continues and all events across Italy are
                                                                                                             suspended until April 3rd. Schools remain closed in all Italy until mid March.
                                                                                                             Big events (fairs, exhibitions) are postponed in June/July and many flights
           •    FEB 6th – another case (Italian person coming from Wuhan) in Rome
                                                                                                             from/to Italy are canceled until May.

                                                                                                         •   MAR 8TH – all the Lombardia region and other 14 districts are warning zone
           •    FEB    21st –    first cases in two different Italian regions (Lombardia e Veneto)
                                                                                                             until April 3rd. Schools remain closed as well as cinema, theatres, gym and
                                                                                                             in general all the public places where people can gather. Also bars and

           •    FEB W/O 24th – more cases discovered in many Italian regions. Italy is                       restaurants will be closed after 6 PM. People work more and more from

                divided in red areas (maximum alert) and yellow areas (medium alert) and                     home and the advice is not to go out and travel out of the cities is allowed

                precautionary measures depend on areas, regions and municipalities. In                       only for urgent matters. Supermarket are open.

                many regions schools, gyms, clubs, theatres, museum and cinema are
                                                                                                         •   MAR 10TH – the measures for containing Covid-19 have been extended to
                closed, aggregational events are canceled and public places are
                                                                                                             all Italy. Supermarket, drugstores and public transportation are guaranteed.
                implementing new rules (reduced opening hours, distance from people,
                                                                                                             Shops, bars and restaurants remain closed until March 25th.
                etc.)
                                                                                                         •   MAR 15TH - containment measures have been taken in other European
                                                                                                             countries and worldwide

                                                                                                     4
Source: Ansa, Corriere.it, Repubblica.it, salute.gov.it, open.online
COVID-19 - ITALY MARCH 19th 2020 - Omnicom Media Group
The first data highlight a decline in tech sector both in physical
          and in on-line store

                                                                   -8,9% -6,1%                       on-line sales
                                                                   in traditional point of sales

                                                                                                                             Tech industry has registered a strong

                                                                   -10% -12,4%
                                                                                                                             decrease in terms of sale both in

              -8,4%
                                                                                                                             physical and in on-line stores.

                                                                                                                             The most affected area is North Italy,
                                                                   in Lombardia                      In north-east Italy
                                                                                                                             especially Lombardia region.

             in terms of tech sales in the week of February 17th

                                                                    -31,4% -27,4%
                                                                                                                             Big domestic appliances are strongly
             compared to the prior four weeks                                                                                decreased as well as small ones.
                                                                                                                             Smartphones, which are the
                                                                   dryer                           air conditioning system   appliances with the biggest revue,
                                                                                                                             have lost almost 7 percentage points.

                                                                    -27%                           -24,1%
                                                                   printer                         vacuum cleaner

                                                                   -17,4% -6,7%         5

                                                                   coffee machine                  smartphone
Source: Ansa, GFK Eurisko *data released on February 24th
COVID-19 - ITALY MARCH 19th 2020 - Omnicom Media Group
Even if the following week is already filling the gap

              -1,9%
             in terms of tech sales in the week of February 24th
                                                                   +8,8%
                                                                   in terms of tech sales in the week of February 24th
             compared to the prior four weeks                      compared to the same week in 2019

                                                                                          6

Source: Ansa, GFK Eurisko *data released on March 6th
COVID-19 - ITALY MARCH 19th 2020 - Omnicom Media Group
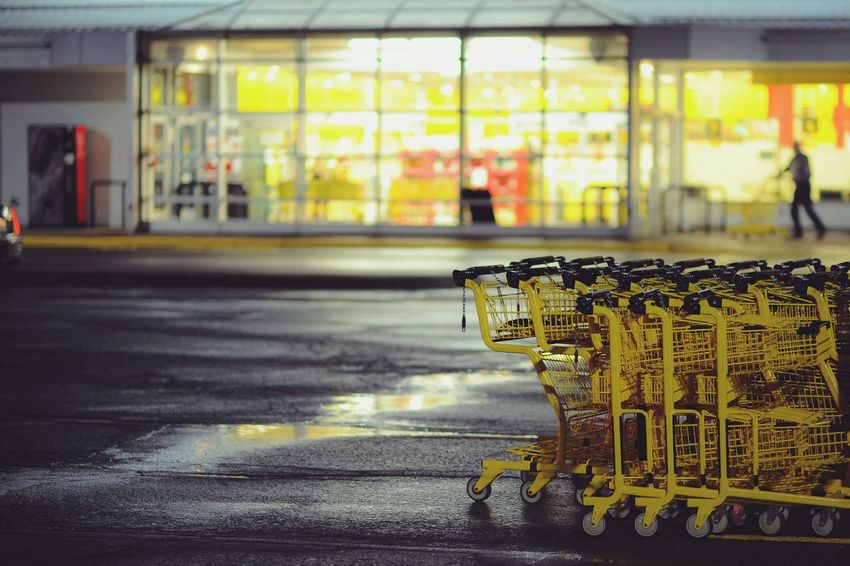
On the other hand, mass market retailers have experienced a
          boost

               +8,3%
              in terms of value sales in MMR in physical stores
                                                                    the peak was registered on Sunday 23rd
                                                                    with +73% of value sales in northern
                                                                    Italy, especially in Lombardia (+87%)
                                                                    and Veneto (+41,6%)
              in the week of February 17th compared to the
              same week in 2019
                                                                             % variation vs py - tot on-line sales FMCG products                    % variation vs py - click and collect on-line sales FMCG
                                                                                                                                                                             products
                                                                      250%

               +56,8%
                                                                                                                                             250%

                                                                      200%                                                                                                                                  205,4%
                                                                                                                                             200%

                                                                      150%
                                                                                                                                             150%
                                                                                                                           101,5%
                                                                      100%                                                                                                                         97,7%
                                                                                                                                    81,2%    100%     86,3%
                                                                                                                                                              72,1%             74,2%
              in terms of value sales in MMR in on-line stores in            61,2%
                                                                                      48,5%    45,3%    47,4%     42,2%
                                                                                                                                                                       68,1%
                                                                                                                                                                                          56,8%
                                                                      50%
              the week of February 17th compared to the same                                                                                 50%

              week in 2019
                                                                       0%                                                                     0%
                                                                             mon_17   tue_18   wed_19   thur_20   fri_21   sat_22   sun_23           mon_17   tue_18   wed_19   thur_20   fri_21   sat_22   sun_23

                                                                    Two main evidences arise:
                                                                    • the "week-end panic" due to the massive news about the increase of the number of positive
                                                                      cases of the virus
                                                                    • the positive trend of "click&collect" services instead of the more classic door to door delivery
                                                                                7

Source: Nielsen, IRI *data released on March 2nd
COVID-19 - ITALY MARCH 19th 2020 - Omnicom Media Group
Essential goods and para-pharmaceutical products in the
          shopping cart in the first week of the emergency

                                                   CANNED                 TOMATO                PERSONAL
            RICE                                            PASTA                     SAUCES
                                                    FOOD                DERIVATIVES               CARE

   +33%                                        +29%         +25%        +22%          +19%     +112%
  in terms of value sales in the week of
  February 17th compared to the same
  week in 2019

                                                                    8

Source: Nielsen, IRI *data released on March 2nd                                               w/o 17th February 2020
COVID-19 - ITALY MARCH 19th 2020 - Omnicom Media Group
Also in the second week of the emergency basic food and
          sanitizing products have been stocked up by Italians
             BASIC FOOD                                                                                                       PERSONAL CARE

          FLOUR                            RICE                            PASTA                                             WET WIPES    SOAP     PAPER TOWELS

             +82%                         +61%                             +57%                                               +260,3%     +83,5%     +31,7%

                                                                                                                              HOME CARE
       BOTTLED                        BREADED                          FROZEN
        WATER                           FISH                         VEGETABLES                                              ALCOHOL      BLEACH

           +19%                           +34%                             +22%                                               +347,0%     +87,8%

                                                                                                                         9

Source: Nielsen Market Track, Total Italy; sales value growth 2020 (24/2-1/3) vs homologous PY / released on March 6nd                                   w/o 24th February 2020
COVID-19 - ITALY MARCH 19th 2020 - Omnicom Media Group
And the growth for mass market and e-commerce continues also
          during the lockdown
                  SALES VALUE GROWTH VS 2019

                                                       17-23 Feb   24 Feb - 1 Mar                             2 Mar – 8 Mar

                      TOTAL MM                        +8,3% +12,2%                                             +11%
                                             Area 1     +11,2%         +9,9%                                      +7,9%

                                                                                     throughout Italy
                                                                                     the concern has spread
                                             Area 2      +9,7%         +12,8%                                     +7,5%

                                             Area 3      +4,4%         +12,8%                                    +12,9%

                                             Area 4      +6,1%         +15,8%                                    +20,9%

              E-COMMERCE                              +56,8% +81,0% +82,3%
                                                                                10

Source: Nielsen data released on March 9nd
People's behaviors are also rapidly changing

                                           49%                             30%                                    8%
                                avoid public and crowded places   avoid to take public transportation        is working from home

                                                                                               27%                                  15%
                       1 out of 3                                                              have
                                                                                               declared to
                                                                                                                                    have
                                                                                                                                    declared to
                       have reduced eating                                                                                          watch more
                       and drinking outside                                                    watch more
                                                                                                                                    on-line
                                                                                               TV
                                                                                                                                    video

                                                                                   11
Source: Ansa, Nielsen *data released on March 1st
And new forms of home entertainment are on the rise

              Trend Google searches by topic
              (100=day with more searches)

                       100
                                                  Streaming                           100
                                                                                                               Netflix                       100
                                                                                                                                                                Amazon Prime Video
                        50                                                             50                                                     50

                         0                                                              0                                                      0
                             2/1         2/8    2/15   2/22   2/29     3/7     3/14         2/1   2/8   2/15     2/22    2/29   3/7   3/14         2/1       2/8       2/15       2/22     2/29      3/7     3/14

                100
                                                  Music                               100
                                                                                                        Videogames                                 100
                                                                                                                                                                          Cooking Recipes
                 50                                                                    50                                                            50

                   0                                                                    0                                                             0
                       2/1         2/8     2/15    2/22   2/29   3/7        3/14            2/1   2/8   2/15     2/22    2/29   3/7   3/14                2/1       2/8       2/15       2/22     2/29     3/7      3/14

                                                                                                                                                   + 54% video played
                100
                                               Audiobooks                             100
                                                                                                           Twitch.tv
                 50                                                                    50

                   0                                                                    0                                                          week 9-15 march 2020 vs
                       2/1         2/8     2/15    2/22   2/29   3/7        3/14            2/1   2/8   2/15     2/22    2/29   3/7   3/14         week 10-16 february 2020
                                                                                                                                                   Source: internal data Twitch

                                                                                                                  12
Source: OMD Elaboration on Google Trend Data *data released on March 15st
The most worried are the less involved in the epidemic

                                                    NORTHERN ITALY
                                                    14% of very worried people

                                                           CENTRAL ITALY
                                                           15% of very worried people

                                                                      SOUTHERN ITALY
                                                                      23% of very worried people
                                                                      Campania region has the highest % of very worried
                                                                      people  28%

                                                               13
Source: Ansa, Nielsen *data released on March 1st
2. MEDIA DYNAMICS
Tv consumption reveal an increase during daytime and late evening.
          +20% in terms of average minute rating between 10 and 12
             30.000.000                                                                                                                                             35%

                                                                                                                                          +7%

                                                                                                                                                                    30%
             25.000.000                                                                                                                         +8%

                                                                                                                                    +8%
                                                                                                                                                                    25%
             20.000.000
                                                                                   +14%
                                                                                                                                                      +14%
                                                                                          +10%
                                                                                                                                                                    20%
                                                                                                 +10%
       AMR

             15.000.000
                                                                                                          +14%
                                                                                                                                                                    15%
                                                                           +21%
             10.000.000
                                                                  +23%
                                                                                                                                                                    10%

              5.000.000
                                                                                                                                                                    5%

                      0                                                                                                                                             0%

                                                                                            all population – Total audience Daily

                                                                                                   2020    2019

Source: OMG analysis on Auditel data. Period: 24/2/2019-2/3/2019 || 23-29/2/2020                                                                TV 23rd-29th February 2020
Total tv audience grows more in the next week in all time bands with a
          peak in the morning (+54% between 9am and 1pm)
             35.000.000                                                                                                                                                   70%

                                                                                                                                           +20%
             30.000.000                                                                                                                                                   60%
                                                                                                                                    +26%
                                                                                                                                                  +20%

                                                                                                                             +34%
             25.000.000                                                                                                                                                   50%

             20.000.000                                                      +38%   +29%                                                                                  40%
                                                                                                               +45%                                        +35%
       AMR

                                                                                                 +35%

             15.000.000                                                                                                                                                   30%

                                                                +68%
                                       +20% +44%
             10.000.000                                                                                                                                                   20%
                                                                                                                                                                   +35%

              5.000.000                                                                                                                                                   10%

                      0                                                                                                                                                   0%

                                                                                     all population – Total audience Daily

                                                                                            2020    2019

Source: OMG analysis on Auditel data. Period: 10-16/3/2019 || 28-14/3/2020                                                                               TV 8th-14th March 2020
Reach has +4,5pp: daily spent time grows for all the targets (+78
          min vs 2019) with 5h and 30min spent on average

                         100%
                          95%
                                                                                                                                                                          +1,4%
                                                                                                                                                               +1,9%
                          90%           +4,5                                                                                                        +3,9%
             Diff.
           REACH%         85%            %
                          80%                               6,0%                                                                         +6,2%
                          75%                                                    +6,4%
                                                                                                                              +5,4%
                          70%                                                                          +12,0%
                          65%                                                                                      +7,8%
                          60%
               REACH %

                          55%
                          50%
                          45%
                          40%
                          35%
                          30%
                          25%
                          20%
                          15%
                          10%
                           5%
                           0%

                                In d ivid u i             4 /7                 8 /1 4                1 5 /1 9   2 0 /2 4   2 5 /3 4   3 5 /4 4   4 5 /5 4   5 5 /6 4     65+

               % i ndi vi dui      100%                   4%                    7%                     5%         5%        11%        14%        17%        14%         23%
                                Ore spese
                         2019      4:15                   2:27                  1:53                  1:37       1:58       2:41       3:12       4:12       5:24        7:09
                         2020      5:33                   3:45                  3:02                  2:31       2:46       3:45       4:24       5:38       6:55        8:32
                     De l t a     +1:18                  +1:18                 +1:09                 +0:54      +0:48      +1:04      +1:12      +1:26      +1:31       +1:23

Source: OMG analysis on Auditel data. Period: 10-16/3/2019 || 28-14/3/2020 Target Individuals and Guests                                                      TV 8th-14th March 2020
Talking about radio, classic broadcasting station push on digital
radio

                                 18
WHO talks about infodemia to identify the abundance of information in a
          crisis situation. News websites have experienced it on February 24th
                                                 unique users - Top 10 news websites
            9.000.000
                                                                                                La Repubblica
            8.000.000
                                                                                                Corriere della Sera
            7.000.000
                                                                                                TGCOM24
            6.000.000
                                                                                                Il Messaggero
            5.000.000
                                                                                                Fanpage
            4.000.000
                                                                                                Il Fatto Quotidiano
            3.000.000                                                                           La Stampa.it
            2.000.000                                                                           ANSA
            1.000.000                                                                           Leggo
                    0                                                                           Quotidiani GNN - Gedi News Network

                                              visited pages - Top 10 news websites
            40.000.000
                                                                                            The peak is higher when many cases of
                                                                                            Covid-19 are discovered in different
            35.000.000
                                                                                            italian regions (February 23 and 24)
            30.000.000
            25.000.000
            20.000.000
            15.000.000
            10.000.000
              5.000.000
                        0

                                                                                       19
Source: Audiweb *data released on March 1st
The adv market grows in the first 2020 bimester. The crisis shows
    its effect in the first week of march

          MEDIA INVESTMENTS                                                                       1-14 MARCH TREND PER MEDIA

                                                                                                     -16%             -15%           -33%
          -4%                   -4%
                                                                                                  1-14 MARCH TREND PER SECTOR

                                                    -17%
                                                                         -20%                     House keeping   Gas/Electricity   Beverages

     WC 16/02/2020        WC 23/02/2020         WC 1/03/2020         WC 8/03/2020

                                                                                             20    Automotive        Leisure         Tourism
OMG forecast on provisional Nielsen data – Media excluded: OOH, magazines, search e social
3. CONSUMER POINT OF VIEW
Web Listening

We're constantly listening
the web in order to monitor
conversation around
Covid-19, sentiment and
most common topics.

                              22
Over 300mio conversations about Coronavirus. From march 2nd the trend
                          is growing due to the increase of infected and the Italy restrictive
                          measures
                          25.000.000                                  8.000

                                                                      7.000

                          20.000.000                                                                                 Conversations peak was
                                                                      6.000                                          February 24th and on March 5th

                                                                      5.000

                                                                              Numbers of infected
                                                                                                                     March 9th we detected over
      Tot conversations

                          15.000.000

                                                                                                                     25mio conversations.
                                                                      4.000                         Coronavirus
                                                                                                    Daily infected
                          10.000.000
                                                                      3.000
                                                                                                    Tot infected
                                                                                                                     With the rise of the infected in
                                                                                                                     the last 4 days, the number of
                                                                      2.000
                                                                                                                     conversations grow accordingly.
                           5.000.000

                                                                      1.000

                                  0                                   0

                                                                 23
Source: Annalect analysis Brandwatch *data released March 10th
Emergency and quarantine are the main generic topics also
          confirmed by emoji

                                                                 24
Source: Annalect analysis Brandwatch *data released March 10th
People seem worried and report general disinformation. In the last
          update grow smart-working, "normal flu" and disinformation issues

                                                                                              REACTIONS AND TOPICS
               35%
                           32% 32%
                                       30%
               30%

                                                                  25%
                                                      24%
               25%
                                                            23%

               20%
                                                                                17% 17%
                                                                          16%

               15%

                                                                                                11% 10% 11%
               10%                                                                                                                9%
                                                                                                                             8%
                                                                                                                       7%
                                                                                                                                             6%    5%
                5%                                                                                                                                       4%                 4%
                                                                                                                                                                      3%          3%
                                                                                                                                                                                           1%    1%    1%
                0%
                               Worried                Dinisformation    Economical impact /   Slightly more than a     Smartworking     Virus made artificially to   Italian politic bad   Irrational panic
                                                                            Recession              normal flu                              reduce population           management

                                                                                   Reactions March 2     Reactions March 4    Reactions March 9

                                                                                                                25
Source: Annalect analysis Brandwatch *data released March 10th
Conversation on 9th have reached the maximum peak. Disinformation
          grows due to the measured taken by the government
                                                                                                                                  DISINFORMATION
                              40.000.000

                              35.000.000

                              30.000.000
                                                                                                    WORRIED
                                                                                                                                                                                 ECONOMIC IMPACT
                              25.000.000
             # conversation

                              20.000.000

                              15.000.000

                              10.000.000

                               5.000.000

                                      0
                                           1/2 2/2 3/2 4/2 5/2 6/2 7/2 8/2 9/2 10/2 11/2 12/2 13/2 14/2 15/2 16/2 17/2 18/2 19/2 20/2 21/2 22/2 23/2 24/2 25/2 26/2 27/2 28/2 29/2 1/3 2/3 3/3 4/3 5/3 6/3 7/3 8/3 9/3

                                                                    Economical impact / Recession        Smartworking                         Virus made artificially to reduce population
                                                                    Worried                              Slightly more than a normal flu      Irrational panic
                                                                    Dinisformation                       Italian politic bad management       Coronavirus
                                                                                                                             26
Source: Annalect analysis Brandwatch *data released March 10th
Consumer Survey

We have also asked to our
proprietary panel (300
interviews per week) how
do they feel about Covid-
19.
We will update the data
weekly.

                            27
What consumers think about Covid-19? They are worried and
          some habits are changing fast
                                                                      0%     10%         20%         30%     40%        50%        60%         70%      80%        90%            100%

                                                                                                                                                                                         72%
       I am worried for the economic consequences of Covid-19           5% 5%          18%                        31%                                   41%

                            I spent more time than usual at home                 27%                  10%               27%                      19%                   18%                         are worried for the
                   I spent more time than usual with my relatives               24%                  15%                   27%                       21%                13%
                                                                                                                                                                                         economic impact

                            I have cancelled programmed travels                                52%                               11%           14%         11%              12%

                        I spent more than usual time watching TV

                  I spent more than usual time on social network
                                                                                   29%

                                                                                   32%
                                                                                                            18%

                                                                                                             16%
                                                                                                                                   26%

                                                                                                                                   25%
                                                                                                                                                           17%

                                                                                                                                                           18%
                                                                                                                                                                            10%

                                                                                                                                                                             9%
                                                                                                                                                                                         37%        stayed more at home

                                                                                                                                                                                         34%
                             I used Smart Working (remote work)                                      59%                               9%         13%            11%         9%

    I listened radio more than usual (both digital and traditional)                      42%                            18%                    22%               12%          7%                     spent more time than
                                               I bought more food                              49%                            14%              17%               14%          6%         usual with their relatives
                             I spent more time than usual outside               27%                         22%                          32%                     13%          6%

                                     I made more shopping on-line                              49%                               18%                 18%               9%     5%

                                         Strongly disagree       Disagree     Neither Agree nor disagree           Agree         Strongly Agree

                                                                                                                              28
Source: OMG Proprietary Panel 300 pp interviewed *data released March 10th
Consumer habits in
Milan

Thanks to smartphone App
it was possible to make
analysis on how the public
places have changed in
Milan in terms of people
influx during the
emergency.

                             29
Fast-food have been strongly affected by the emergency in Milan

                                                                                                                                                     Supermarket are stable visited except
                                                                                                                                                     for February 22th and 23th, when the
                                                                                                                                                     first alarm arise and people assaulted
                                                                                                                                                     grocery shops.

                                                                                                                                                     Fast-food have experienced a strong
                                                                                                                                                     decrease from February 24th with -75%
                                                                                                                                                     peak in terms of in-store visit (48%
                                                                                                                                                     average).

                                                                                                                               30

Source: https://beintoo.com/it/milano-al-tempo-del-covid-19-come-cambiano-realmente-le-abitudini-di-consumo-dei-cittadini *data released March 5th
Train stations and airports have experienced drops of people as
          well

                                                                                                                                                     Decrease in terms of people for
                                                                                                                                                     Centrale and Garibaldi, the two main
                                                                                                                                                     station in Milano.

                                                                                                                                                     Linate and Malpensa (airport in
                                                                                                                                                     Milano), have experienced the same
                                                                                                                                                     with a little delay.

                                                                                                                               31

Source: https://beintoo.com/it/milano-al-tempo-del-covid-19-come-cambiano-realmente-le-abitudini-di-consumo-dei-cittadini *data released March 5th
4. BRAND REACTIONS
Some brands are sending empowering sponsored messages to
          the community

    UNICREDIT – BANKING                                       MEDIOLANUM – BANKING                                        REPOWER – ENERGY SUPPLY
    "Unicredit is close to local economies and supports the   Mediolanum bank share their monetary support to the         "Luckily, also positive energy is contagious.
    most affected area by Covid-19 #Unicredit4People"         most involved hospital in Milan and ask the population to   #getinfected"
                                                              make donations.

                                                                                     33
Source: Twitter.it, desk research
Some brands are sending empowering sponsored messages to
          the community

   EUROSPIN / ESSELUNGA –                           ARMANI – FASHION BRAND                                   BARILLA – FOOD BRAND
   SUPERMARKET CHAIN                                Armani share their monetary support to fight the virus   Barilla share their monetary support to fight the virus
   They share their monetary support to fight the
   virus
                                                                                  34
Source: Eurospin.it
Some brands are sending empowering sponsored messages to
          the community

          SNAM - INFRASTRUCTURE COMPANY                          GILLETTE – PERSONAL CARE
          They share their monetary support to fight the virus   Gillette with the brand ambassador Christian Vieri launches a call to action to invite all
                                                                 fans to follow the live broadcast of the new "Casa Vieri Show” via IG.
                                                                 For each person who will connect to the broadcast, Gillette Italia will donate 1 euro
                                                                 (with the aim of reaching 100.000€)
                                                                  35
Source: Eurospin.it
Others are helping their consumers from the most affected
           regions with ad hoc offers

                                               VODAFONE / TIM /3-WIND – TELCO
                                               The three most important telco providers are offering
                                               illimited giga for a month to their customers who live in
                                               the most affected regions by Covid-19.

                                          36
Source: Corriere.it
Others are helping their consumers from the most affected
           regions with ad hoc offers and free entertainment

                                               VARIOUS BRANDS – TECH
                                               A Lot of brands, through the Ministry of innovation
                                               technology and digitalization, are offering different free
                                               tech support to the red zones (i.e. sharing platform, free
                                               wi-fi, newspaper and magazine subscription, streaming
                                               services, …)

                                          37
Source: solidarietadigitale.agid.gov.it
Others are pushing services / products that capitalize on the "stay
         at home" forced situation

         COOP and ESSELUNGA –                   McDonald's – FAST FOOD CHAIN           SONY PLAYSTATION – TECH
         SUPERMARKET                            McD's is offering free delivery        Sony is pushing for FIFA 2020, a soccer game for
         Coop and Esselunga are offering free                                          Playstation came out in September 2019
         delivery in Milano and other risky
         areas to over 65 years old people
                                                                                  38
Source: desk research
Others are pushing services / products that capitalize on the "stay
         at home" forced situation

                                               BARILLA– FOOD
                                               Barilla invites IG users to cook together
                                               with some chefs during daily Instagram
                                               live sessions
        MENZ AND GASSER – FOOD
        Menz & Gasser stress on the "stay at
        home" concept suggesting how to use
        their products.
                                                                                           SWIFFER– HOMECARE
                                                                                           swiffer suggests a physical workout to do
                                                                                     39
                                                                                           at home using the product
Source: desk research
Adaptive advertising is capitalizing on the virus situation

                                   WEROAD – TOUR OPERATOR                             KIA – AUTOMOTIVE
                                   WEROAD, a travel service organizing mainly trip    Kia offer the possibility to book the new Kia
                                   abroad for young people, is now pushing to         Xceed "from home" with a financial support
                                   discover the beauties of Italy and promotes "new
                                   express travel within Italy".
                                                                                      40
Source: desk research, Instagram
Others are activating communications to stimulate those who still
         go out

                                                     OOH CAMPAIGN #IORESTOACASA
                                                     The agency Fosbury is pushing with ironic OOH
                                                     message “If you're reading this you must be stupid”,
                                                     to highlight the importance of staying at home in this
                                                     crucial moment

                                         41
Source: desk research
Some products are pushed more than others

                              SUPRADYN – PHARMA
                                                                                IBM – TECH
                              Vitamin supplements are pushed in order to
                              help the immune system                            IBM communicates an institutional campaign
                                                                                speaking about health and "intelligent
                                                                                solutions"

                                                                           42
Source: desk research, Instagram, repubblica.it
But one in particular is suffering only because of the "unfortunate"
          name

                shares on stock exchange are going down
                (-18,49%)
                38% of the Americans would not buy Corona beer        CORONA – BEER
                 during the epidemic days                              Is loosing a lot in terms of sales worldwide
                14% would not order a Corona beer in public           due to the unfortunate naming and the web
                                                                       meme produced after the Corona virus
                                                                       spread.
                                                                  43
Source: ilsole24ore *data released February 29th
Lastly, some brands just had the wrong timing to push some
          messages #epicfail

 CRODINO – BEVERAGE
 Crodino –a famous non alcoholic drink- is on air
 with a brand new spot with multiple messages of:
 stay human, give us a hug as big as the world, give us
 a hug.
 Due to Corona Virus the law has imposed to
 maintain a distance security from each others and
 for that reason the commercial has received strong
 criticisms from the web and many people are asking
 to cancel it.
                                                          44
Source: desk research, Instagram, repubblica.it
You can also read