Global, European and Belgian pharmaceutical market trends

Page created by Gary Armstrong
 
CONTINUE READING
Global, European and Belgian pharmaceutical market trends
Global, European and
                                                                                            Belgian pharmaceutical
                                                                                                     market trends
                                                                                                                                                  Prepared for CIB
                                                                                                                                                27th February 2019
                                                                            Patrick Bervelt, Sales Director, Account Management
                                                                Patrick Van Dooren, Director Commercial & Technology Services

Copyright © 2019 IQVIA. All rights reserved. IQVIA® is a registered trademark of IQVIA Inc. in the United States and various other countries.
Global, European and Belgian pharmaceutical market trends
Agenda

         Patrick Van Dooren, Principal, Director Commercial & Technology Services IQVIA
         Global and European pharmaceutical market trends

         Patrick Bervelt, Sales Director, Sales, BEL & LUX, IQVIA
         Belgian pharmaceutical market trends

                                                                                          1
Global, European and Belgian pharmaceutical market trends
IQVIA Belgium & Luxembourg across our 7 key business areas

Domain Expertise                                                                                                             Unparalleled Data
Institutional knowledge and domain expertise across                                                                          One of the world’s largest curated healthcare data
diseases, geographies and scientific methods                                                                                 sources with innovative privacy protections

Transformative Technology                                                                                                    Advanced Analytics
Leading technologies to provide real-time access to                                                                          Faster, more precise decision-making generated by
operations-critical information                                                                                              advanced analytics designed for healthcare

    Research and          Real-World Insights       Healthcare Solutions        Information Offerings          Services                  Contract Sales and           Technology
Development Solutions    • 20 Real World           • 30 hospital consultants   • Wholesaler, retail,    • Commercial services             Medical Solutions            Solutions
• 150 staff, including     Evidence scientists                                   hospital panel                                       • 170 staff               • Leading CRM,
                                                   • Market leader for                                  • Technology services
  70 CRA                 • World class in health     hospital analytics        • Longitudinal patient                                 • Medical sales and Key     MCM & MDM
                                                                                                        • Data science                  Account Teams
• Yearly 800 new           economic modelling      • Benchmarking                data                                                                           • Compliance & quality
  patients enrolled                                                                                     • Strategic advice            • Nursing and Home care     solutions
                                                     solutions for hospitals   • HCP database
                                                                                                        • Marketing services            services for patients
• The Brussels                                                                   OneKey                                                                         • Business Intelligence
                                                                                                                                        support
  Prime Site

                                                                                                                                                                                          2
Global, European and Belgian pharmaceutical market trends
+ Global and European pharmaceutical market trends

+ Belgian pharmaceutical market trends

                                                     3
Global, European and Belgian pharmaceutical market trends
Global and European pharmaceutical
market trends

                                     4
Global, European and Belgian pharmaceutical market trends
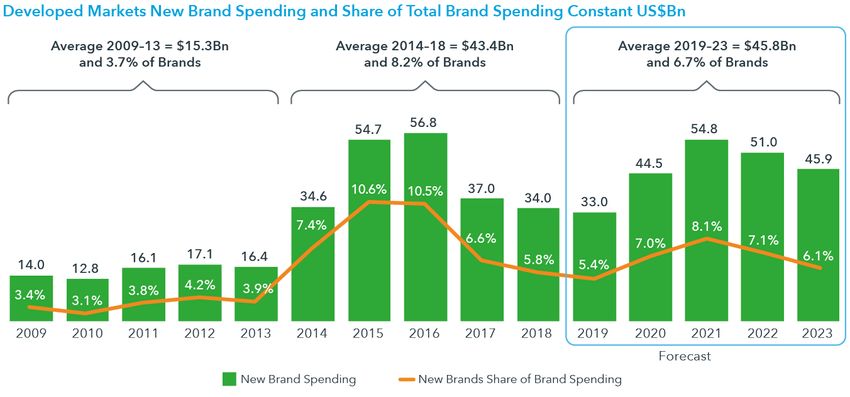
Global growth is forecast at 4.8% per annum, led by developing markets and
 the US in particular

                                                      Sales Evolution and Forecast - Global
                  1.600                                            (2016-2022)                                                   8%
                                                                                                                       1.447
                                                                                                            1.373                                     Forecasted annual
                  1.400                                                                    1.304                                 7%
                                                                                                                                                      growth 2017-2022
                                                                           1.245
                                                           1.205
                  1.200                  1.139                                                                                   6%
 Sales ($US bn)

                                                                                                                                      Annual growth
                           1.108                                                                                                                           +4.8%
                  1.000                                                                                                          5%
                                                                                                                                                           +5,5%
                   800                                                                                                           4%

                   600                                                                                                           3%                        +3.9%

                   400                                                                                                           2%

                   200                                                                                                           1%

                     0                                                                                                           0%
                          2016 (a)      2017 (a)          2018 (f)       2019 (f)         2020 (f)         2021 (f)   2022 (f)

                                           Global sales        Global growth        US growth        Europe growth

IQVIA Health Market Prognosis Q3 2018

                                                                                                                                                                          6
Global, European and Belgian pharmaceutical market trends
In Europe, growth will be more modest and in Belgium slightly weaker still

                                                  Sales Evolution and Forecast - Europe
                  350                                          (2016-2022)                                                   10%

                                                                                                                    300                            Forecasted annual
                  300                                                                                    290
                                                                                           279                                                     growth 2017-2022
                                                                             269                                             8%
                                                                259
                                                  248
 Sales (US$ bn)

                  250                   238                                                                                                             +3.9%

                                                                                                                                   Annual growth
                          227
                                                                                                                             6%
                  200
                                                                                                                                                        +2.9%

                  150
                                                                                                                             4%

                  100
                                                                                                                             2%
                   50

                    0                                                                                                        0%
                        2015 (a)    2016 (a)   2017 (a)       2018 (f)     2019 (f)      2020 (f)      2021 (f)   2022 (f)

                                               Europe sales       Europe growth       Belgium growth

IQVIA Health Market Prognosis Q3 2018

                                                                                                                                                                       7
Global, European and Belgian pharmaceutical market trends
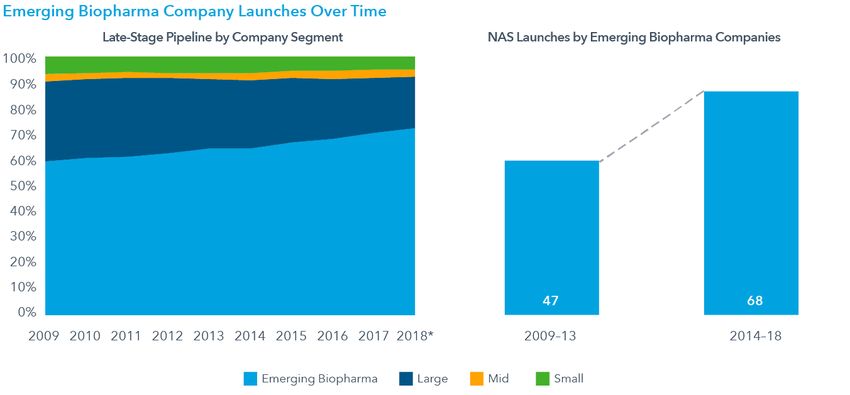
Global growth is expected to be primarily driven by developed markets, and
 to a lesser extent by expanded access and use in pharmerging markets

                                                              Contribution to Global Sales by Region
                                                                            (2017-2022)

                                          +5.5%       +5.0%          +7.4%         +3.8%       +3.6%        +5.1%       +1.6%   CAGR % (2017-2022)
                 1.500
                                                                                                              11          1           1.447
                                                                                    57           13
                 1.400                                                 16
                                                        61
                                           149
                 1.300
 Sales (US$ m)

                 1.200
                           1.139

                 1.100

                 1.000

                  900

                  800
                         2017 sales     N. America   W. Europe   E. Europe & CIS   Asia      L. America   ME & Africa   RoW         2022 sales

IQVIA Health Market Prognosis Q3 2018

                                                                                                                                                     8
The US will continue to be the largest market but we expect to see changes
 in rankings lower down the top 20

Source: IQVIA Institute

                                                                              9
By therapy area, oncology, antidiabetics and autoimmune disease products
 dominate the global market

                              Top 15 Therapy area ranked by sales                                                5 year CAGR
                              (Global sales, $US bn MAT 11/2018)

              Oncologics                                                              $103bn                                  9%
             Antidiabetics                                                    $92bn                                                11%
   Autoimmune Diseases                                                $69bn                                                               18%
                      Pain                                          $64bn                                         1%
      Respiratory Agents                                    $46bn                                                  2%
        Antihypertensives                                  $43bn                                     -6%
            Antibacterials                           $38bn                                                 -2%
           Anticoagulants                            $37bn                                                               6%
           Mental Health                           $34bn                                             -6%
                Antivirals                    $30bn                                                                           9%

        Multiple sclerosis                   $28bn                                                                                  13%

Nervous system disorders                    $27bn                                                                       5%

    Other cardiovasculars                  $25bn                                                                   2%

            Viral hepatitis                $24bn                                                                                                27%

          Lipid regulators                $22bn                                                -9%

Source: IQVIA MIDAS

                                                                                                                                                      10
The current drug pipeline reflects this emphasis on oncology

                                                                               Top 10 Therapy Areas by Molecule Count
                                      10.000   315
 Number of Molecules in Development

                                       8.000

                                       6.000
                                                     186
                                                                       222
                                       4.000

                                                                                        150            107
                                       2.000                                                                       47               100            82        92   66

                                          0

                                                           Discovery         Clinical         Phase 1 Clinical   Phase 2 Clinical         Phase 3 Clinical
IQVIA Market Analytics and ReSearch, IQVIA Institute

                                                                                                                                                                       11
Over the past five years there has been a significant increase in the number
of and spending on new active substances

                                                                               12
Fewer than half of the world’s top 20 pharmaceutical companies generated
>15% of their 2018 sales from products launched in the last 5 years
                                                                                                                    Global – Top 20 refreshment index
           Total absolute growth Q3MAT 2012-2018 (Bn LCUS$)

                                                              22
                                                                                                                                                       J&J                 Abbvie
                                                              20                                                                                                                                                             Gilead

                                                              16                                                                                                                                    BMS
                                                              14
                                                              12                               Novo Nordisk
                                                                                                                            Roche                                                        GSK
                                                              10
                                                                                                Amgen
                                                               8                                                                 Novartis                            Merck & Co                            Lilly
                                                                                                              Sanofi
                                                               6
                                                                           Bayer                                                                  Pfizer
                                                               4
                                                                                                                              Allergan                                            Boehringer Ingelheim         Takeda
                                                               2
                                                                                   Mylan                                                                                                 Bubble size represents recently
                                                              -4                                                                                 Astrazeneca                             launched* product sales in Q3MAT 2018
                                                                                   Teva
                                                              -6
                                                                   0   1     2       3     4   5    6    7      8       9   10      11      12    13       14   15    19     20     21    27   28    29   30       31   69   70   71

                                                                                                                       Share of Q3MAT sales from recent launches* (%)

Notes: Recent launches: Innovative branded products launched in the last 5 years.
                                                                                                                                                                                                                                       14
Source: IQVIA MIDAS MAT Q3 2018
Small players, the ‘emerging biopharma companies’, are expected contribute
  a larger share of new active substance launches

Source: IQVIA Institute

                                                                               15
Specialty products are accounting for more and more of new active
 substance launches and will make up over half of spending

                                 Share of Specialty Launches          Specialty medicine share of spending

                          2004-2008                       2009-2013

                           38%                                 50%

                          2014-2018                       2019-2023

                           61%                                 65%

Source: IQVIA Institute

                                                                                                             18
Growth in specialty spending will be disproportionately driven by five
 therapeutic classes

Source: IQVIA Institute

                                                                          19
Biologics growth continues to outstrip small molecules
Global biologics sales and trends (Bn of US$, MAT 06/2013-06/2018)

                   300                                                                           30%
                                                                                                                            MAT 06/18 Biologics sales
                   250
                                                                                                 25%                          (Total 2018: 295 Bn US$)

                                                                                                 20%
  Sales (Bn US$)

                   200
                                                                                                                      12%     17%                              19%

                                                                                                       Growth
                                                                                                 15%
                   150                                                                                           7%
                                                                                                 10%            5%                              42%
                                                                                                                                                                    18%
                   100
                                                                                                 5%

                    50                                                                                                      59%                          4%   17%
                                                                                                 0%

                    0                                                                            -5%                  EU5                           Autoimmune
                         2013     2014          2015          2016          2017          2018                        US                            Diabetes
                            Biologics sales                   Small molecule growth                                   Japan                         Oncology
                            Biologics growth                                                                          Pharmerging                   MS
                                                                                                                      RoW                           Others

                                                                                                                                                                          21
Source: IQVIA; European Thought Leadership; MIDAS MAT Q2 2018; Rx only; Note: growth in LCUS$
Biologics are on the cusp of being shaken up

                       Global Rx Value (MAT Q2 2018) LCUSD                    Global Biologics Top 10 (MAT Q2 2018)

                                                                                        Threatened by LOE
          $296bn                         Other Value Added Medicines
                                              3% 3%                                                     bn USD
                                                           Innovative SM    Top 10 biologics
                                                                                                         (2018)
                                                                            Humira                         24
              Biologics
                            29%                                             Lantus                         11
                                                                            Enbrel                         10
                                              MIDAS
                                                            41%             Remicade                        8
                                             Global Rx
                                              $1.0tn                        Novorapid                       7
                                                                            Herceptin                       7
                          1%                                                Mabthera                        7
         Biosimilars
                                                                            Opdivo                          7
                                        22%                                 Avastin                         6
                                  Generics                                  Humalog                         6

                                                                           Total threatened: $90bn, 30% of biologics

Notes: Pathway biosimilars only                                                                                        22
Source: IQVIA MIDAS MAT Q2 2018
Originators begin taking back share from certain markets. Adalimumab
                   latest and most anticipated entrant

                                                                                                   Biosimilar penetration – October 2018

                                                                                                    insulin
                                                                      infliximab                   glargine    etanercept     rituximab    trastuzumab   adalimumab
              EU5

                                             UK                          92.2%                       9.0%        82.0%         91.5%          60.7%
                                          Germany                        51.3%                      13.3%        56.8%         60.9%          28.3%         1.4%
                                           France                        59.1%                      14.6%        17.9%         63.6%          27.5%        0.08%
                                            Italy                        78.5%                      19.2%        45.6%         74.5%           9.2%        0.01%
                                           Spain                         55.8%                      12.0%        30.2%         27.8%          10.6%        0.02%
                                                                                                                                                                       High
High penetration

                                                                                                                                                                      uptake
                                        Denmark                          98.5%                       9.3%        90.6%         67.2%          99.3%
                                         Finland                         17.8%                       6.0%         6.1%          6.2%             -
                                       Netherlands                       76.1%                      10.8%        24.1%         93.4%          95.0%         3.2%
                                         Norway                          97.6%                       5.8%        90.1%          0.0%          81.2%
                                         Poland                          95.2%                      35.6%        36.6%                        34.4%

                                           Canada                         9.8%                       7.8%        11.0%                         0.2%
                                            Japan                         9.0%                      50.2%         6.8%         30.6%          30.6%
                                             USA                          6.2%                      31.7%                                                              Low
                                                                                                                                                                      uptake

                   Notes: trastuzumab and rituximab subcutaneous form excluded from calculations                                                                               23
                   Source: IQVIA MIDAS Restricted MTH October 2018
Originators use devices as one of their most successful defences

                            Trastuzumab forms (2014-17) Treatment days                     Trastuzumab volume share (2018) Treatment Days
                                                                                                SC Herceptin   IV Herceptin   Biosimilar

                        5        NL
                               EU5
                                                                                                   Germany                           UK
Treatment days (Mio.)

                        4

                        3

                        2

                        1

                        0
                        Q2/14 Q4/14 Q2/15 Q4/15 Q2/16 Q4/16 Q2/17 Q4/17

                            Reformulated       Subcutaneous injection: less invasive,
                            Original                   faster administration

                                                                                                                                           28
         Source: IQVIA European Thought Leadership; IQVIA MIDAS Restricted MTH July 2018
Defences hold strong: no significant switch from SC -> IV
                  Rituximab Subcutaneous share Treatment days                              Trastuzumab Subcutaneous share Treatment days
                    Biosim Launch May-17                                                                               Biosim Launch May-18
35%                                                                                        80%

30%                                                                                        70%

                                                                                           60%
25%
                                                                                           50%
20%
                                                                                           40%
15%
                                                                                           30%
10%
                                                                                           20%
 5%                                                                                        10%

 0%                                                                                        0%

                        France               Germany                  Italy   Spain   UK          France   Germany   Italy   Spain   UK

                                                                                                                                              29
Source: IQVIA European Thought Leadership; IQVIA MIDAS MTH December 2018
What to watch 2019 to 2023
Next-generation Biotherapeutics: expanding use and new approvals

                                                                   30
Source: IQVIA European Thought Leadership
Belgian pharmaceutical
market trends

                         31
Recent measures impacting the Belgium market
          • Easing of conditions for reimbursement of hep C
            drugs (Jan 2019)
          • Incentivization of biosimilar prescription (Jan 2019)
          • Liberalization of the distribution network for medical                       2019
            devices in Belgium (Feb 2019)
          • Elections (May 2019)

                                                                                                          • Creation of the Federal Observatory
                                                                                                            of Biopharmaceutical sector
                                                                         2018                             • Belgian Medicines Verification
• Low Variable Care                                                                                         System goes Live
• Hospital Networks
• BeNeLuxA – initiative to
  facilitate information sharing
  and streamline Health
  Technology Assessments
                                                    2017

                                                                     •   Agreement to boost uptake of biosimilars
                                                                     •   Introduction of patent cliff system for medicines in cat A, B, C, Cs,and Cx
                                   2016                              •   Reduction of the security margine
                                                                     •   Application of patent cliff
                                                                     •   Implementation of the “180 + 1” measure

                                                                                                                                                       32
The hospital channel has made the strongest contribution to Belgian
 pharmaceutical market growth

                                               Total Pharmaceutical market – Belgium
                                                (MNF Euro value; MAT December 2018)
                                               Total Pharmaceutical Market €5.401m
          Delta Absolute growth +€357m                      1yr growth +7.1%                 5yr CAGR +4.2%

                                                    Hospital €2.321m                         Rx bound sales €2.618m

                                                    +€346m abs value                         +0.3% 1y growth

                                                    +17.5% 1y growth
                                         43%
                                                    +10.9% 5y CAGR
                  57%                                                          85%           Non Rx bound €462m
                                                    Retail €3.081m                     15%   +0.5% 1y growth
                                                    +€10m abs value
                                                    +0.3% 1y growth
                                                    +0.4% 5y CAGR

Source: IQVIA Retail & Hospital audits

                                                                                                                      33
Hospital sales growth is led by original products, whilst in the retail channel
 generics are performing best

                                               Total Pharmaceutical market – Belgium
                                                (MNF Euro value; MAT December 2018)
                                               Total Pharmaceutical Market €5.401m

                        Hospital €2.321m        Generic €107m
                                         5%     +11.0% 1yr growth                                    Protected
                                                                                       88
                                                Original €2.208m                       %
                                                +17.9% 1yr growth
                                                                                              12%   Unprotected
                                   95%

                           Retail €3.081m       Generic €506m                                        Protected
                                                +5.9% 1yr growth                       40
                                         17%                                           %
                                                Original €2.572m
                                                                                            60%     Unprotected
                                                -0.7% 1yr growth

                                  83%
Source: IQVIA Retail & Hospital audits

                                                                                                                  34
Retail

         35
In retail, immunotherapy and haematology are the best performing
 categories, whilst angiotensin products have seen the greatest decline                                                                                                                       Retail

                                                   Top 10 ATC2 classes in values with growing and declining – Retail
                                                             (MNF Euro Value (Mio.); MAT December 2018)

          Immunosuppressants (L04)                                                               Humira, Stelara,            Psycholeptics (N05)
                                                               330                    +9,3% Cosentyx, Cimzia                                                        163               -2,7%

                  Antithrombotics (B01)                  226              +9,3%      Eliquis, Lixiana, Brilique                 Analgesics (N02)               140                -4,4%

            Antihistamines and COPD
                                                     177             +5,1%    Inuvair, Revlar Elipta, Xolair      Renin-Angiotensin agents (C09)              119             -3,8%
                  products (R03)

                      Antidiabetics (A10)          148          +5,3% Toujeo, Trulicity, Jardiance                   Lipid modifying agents (C10)             117            -25,6%

            Systematic antivirals (J05)            146          +6,2% Genvoya, Tivicay, Odefsey                          Psychoanaleptics (N06)           94              -3,8%

                                                                                                               Sex hormones and modulators of
 Other nervous system drugs (N07)              100         +1,4%      Tecfidera, Aubagio                                                                 76          -0,9%
                                                                                                                   the genital system (G03)
             Antiinflammatory and
                                              60     +13,4%      Xeljanz, Olumiant                                                 Urology (G04)     68             -4,1%
        antirheumatic products (M01)

                             Vaccines (J07)   56    +10,3%       Gardasil, Bexsero                                 Systematic antibacterals (J01)   58         -3,4%

             Cough medications (R05)          55    +2,6%        Bronchosedal, Toularynx                                Nasal preparations (R01)    46        -4,8%

                     Antiepileptics (N03)     53    +2,6%       Vimpat                                                   Antihemorrhagics (B02)     45        -8,9%

Source: IQVIA Retail Audit

                                                                                                                                                                                                       36
In retail, immunotherapy and haematology are the best performing
 categories, whilst angiotensin products have seen the greatest decline                                                                                                                      Retail

                                                   Top 10 ATC2 classes in values with growing and declining – Retail
                                                             (MNF Euro Value (Mio.); MAT December 2018)

          Immunosuppressants (L04)                                                                  Risperdal, Zolpidem,    Psycholeptics (N05)
                                                               330                    +9,3%                                                                        163               -2,7%
                                                                                                    Lormetazepam, Abilify

                  Antithrombotics (B01)                  226              +9,3%               Dafalgan, Durogesic, Perdolan   Analgesics (N02)                140                -4,4%

            Antihistamines and COPD
                                                     177             +5,1%      Coversyl, Preterax, Exforge   Renin-Angiotensin agents (C09)                 119             -3,8%
                  products (R03)

                      Antidiabetics (A10)          148          +5,3%                    Crestor, Inegy, Ezetrol   Lipid modifying agents (C10)              117            -25,6%

            Systematic antivirals (J05)            146          +6,2%                            Sipralexa, Cymbalta   Psychoanaleptics (N06)            94              -3,8%

                                                                                                            Sex hormones and modulators of
 Other nervous system drugs (N07)              100         +1,4%                 Mireva, Nuvaring, Yasmin                                               76          -0,9%
                                                                                                                the genital system (G03)
             Antiinflammatory and
                                              60     +13,4%                                    Vesicare, Tamsolisine SDZ, Cialis   Urology (G04)    68             -4,1%
        antirheumatic products (M01)

                             Vaccines (J07)   56    +10,3%           Amoxicilline EG, Amoclane EG, Tetralysal   Systematic antibacterals (J01)     58         -3,4%

             Cough medications (R05)          55    +2,6%                         Otrivine, Sofrasolone, Rhinospray   Nasal preparations (R01)     46        -4,8%

                     Antiepileptics (N03)     53    +2,6%                                        Refacto AF, Benefix   Antihemorrhagics (B02)      45        -8,9%

Source: IQVIA Retail Audit

                                                                                                                                                                                                      37
The top 20 companies account for 63% of the market share
 and display variable performances over the last year                                                                                                                            Retail

                               Top 20 companies performances and growth – Retail                               Growth since last MAT                      Market growth
                               (MNF Euro Value (Mio.); MAT December 2018)                                                                                     0.2%

             EG GENERICS                                                                         219,3                                                    1,4%
                      PFIZER                                                             164,4              Enbrel                     -7,5%
                      ABBVIE                                                     140,8              +1      Humira                                                 9,1%
       NOVARTIS PHARMA                                                         131,3                +1                                                          4,9%
  GLAXOSMITHKL.PHARM                                                         125,3                  +1                                                     2,3%
                    SANDOZ                                               122,8                      +1                                                     3,1%
      BRISTOL-M. SQUIBB                                                114,6                        +3      Eliquis, Orencia                                      7,3%
             MSD BELGIUM                                               113,7                        -1      Inegy, Ezetrol             -6,8%
           JANSSEN-CILAG                                               113,7                        +1      Stelara                                                            20,0%
  BAYER PHARMACEUTIC                                                 106,2                          +1                                         -1,9%
          SANOFI BELGIUM                                        101,7                                                                      -2,8%
            ASTRAZENECA                                       92,0                                  -9   Crestor -33,3%
     BOEHRINGER INGEL.                                 73,9                                                                                                     5,0%
        GILEAD SCIENCES                              68,8                                           +1      Genvoya, Odefsey                                           10,6%
         TAKEDA BELGIUM                             63,8                                            -1      Pantomed Nycomed           -6,7%
   TEVA PHARM.BELGIUM                               62,1                                                                                                         6,6%
                  J&J CONS.           22,1                                                                                                     -2,2%
         VIIV HEALTHCARE                     49,1                                                                                                         2,0%
           NOVO-NORDISK                      47,3                                                                                                -0,1%
                    SERVIER                  47,2                                                   +1                                                   0,1%
Source: IQVIA Retail Audit

                                                                                                                                                                                          38
On the Belgian market, 162 retail products have been launched between
January 2017 and September 2018                                                                 Retail

                       In total, 162 products were launched on the Belgian market between
         162           January 2017 and September 2018

                       Influenza vaccines, Imported products, Generics
         139           Original products with monthly sales below €30k

                       Original products with monthly sales above €30k recorded at least once
         23

                                                                                                         39
HIV drugs, biologics in psoriasis, rheumatics and diabetes markets, and
     respiratory products show the fastest growth                                                                                                                                                                                                                                    Retail

                                                                                Original products launched between January 2017 and September 2018
                                                                                     with monthly sales above 30,000 EUR recorded at least once
                                                                                               (Value (MNF/EUR); 24 months as of launch)
                  1.400.000

                  1.200.000

                                                                                                                                                                                                                                                        J05C - ODEFSEY - 201701
                  1.000.000
Sales (MNF/EUR)

                                                                                              J05C - SYMTUZA - 201804
                   800.000

                   600.000

                   400.000

                   200.000

                         0
                              MONTH 1

                                        MONTH 2

                                                  MONTH 3

                                                            MONTH 4

                                                                      MONTH 5

                                                                                   MONTH 6

                                                                                             MONTH 7

                                                                                                       MONTH 8

                                                                                                                 MONTH 9

                                                                                                                           MONTH 10

                                                                                                                                      MONTH 11

                                                                                                                                                 MONTH 12

                                                                                                                                                            MONTH 13

                                                                                                                                                                       MONTH 14

                                                                                                                                                                                  MONTH 15

                                                                                                                                                                                             MONTH 16

                                                                                                                                                                                                        MONTH 17

                                                                                                                                                                                                                   MONTH 18

                                                                                                                                                                                                                              MONTH 19

                                                                                                                                                                                                                                         MONTH 20

                                                                                                                                                                                                                                                    MONTH 21

                                                                                                                                                                                                                                                               MONTH 22

                                                                                                                                                                                                                                                                          MONTH 23

                                                                                                                                                                                                                                                                                     MONTH 24
Source: IQVIA LMPB data

                                                                                                                                                                                                                                                                                                40
HIV drugs, biologics in psoriasis, rheumatics and diabetes markets, and
     respiratory products show the fastest growth                                                                                                                                                                                                                                           Retail

                                                                              Original products launched between January 2017 and September 2018
                                                                                   with monthly sales above 30,000 EUR recorded at least once
                                                                                             (Value (MNF/EUR); 24 months as of launch)
                  600.000
                                                                                                                                                                        M01C - XELJANZ - 201712
                                                                                                                                                                                      M01C - OLUMIANT - 201711
                  500.000
Sales (MNF/EUR)

                  400.000

                  300.000

                  200.000

                  100.000
                                                                                                                                    M01C - KEVZARA - 201803

                       0
                            MONTH 1

                                      MONTH 2

                                                MONTH 3

                                                          MONTH 4

                                                                    MONTH 5

                                                                                 MONTH 6

                                                                                           MONTH 7

                                                                                                     MONTH 8

                                                                                                               MONTH 9

                                                                                                                         MONTH 10

                                                                                                                                       MONTH 11

                                                                                                                                                  MONTH 12

                                                                                                                                                             MONTH 13

                                                                                                                                                                           MONTH 14

                                                                                                                                                                                         MONTH 15

                                                                                                                                                                                                    MONTH 16

                                                                                                                                                                                                               MONTH 17

                                                                                                                                                                                                                          MONTH 18

                                                                                                                                                                                                                                     MONTH 19

                                                                                                                                                                                                                                                MONTH 20

                                                                                                                                                                                                                                                           MONTH 21

                                                                                                                                                                                                                                                                      MONTH 22

                                                                                                                                                                                                                                                                                 MONTH 23

                                                                                                                                                                                                                                                                                            MONTH 24
Source: IQVIA LMPB data

                                                                                                                                                                                                                                                                                                       41
HIV drugs, biologics in psoriasis, rheumatics and diabetes markets, and
     respiratory products show the fastest growth                                                                                                                                                                                                                                      Retail

                                                                                  Original products launched between January 2017 and September 2018
                                                                                       with monthly sales above 30,000 EUR recorded at least once
                                                                                                 (Value (MNF/EUR); 24 months as of launch)
                  250.000

                                                                    A10C - FIASP - 201809
                  200.000
                                                                              A10C - XULTOPHY - 201808
Sales (MNF/EUR)

                  150.000

                  100.000

                   50.000

                       0
                            MONTH 1

                                      MONTH 2

                                                MONTH 3

                                                          MONTH 4

                                                                        MONTH 5

                                                                                     MONTH 6

                                                                                               MONTH 7

                                                                                                         MONTH 8

                                                                                                                   MONTH 9

                                                                                                                             MONTH 10

                                                                                                                                        MONTH 11

                                                                                                                                                   MONTH 12

                                                                                                                                                              MONTH 13

                                                                                                                                                                         MONTH 14

                                                                                                                                                                                    MONTH 15

                                                                                                                                                                                               MONTH 16

                                                                                                                                                                                                          MONTH 17

                                                                                                                                                                                                                     MONTH 18

                                                                                                                                                                                                                                MONTH 19

                                                                                                                                                                                                                                           MONTH 20

                                                                                                                                                                                                                                                      MONTH 21

                                                                                                                                                                                                                                                                 MONTH 22

                                                                                                                                                                                                                                                                            MONTH 23

                                                                                                                                                                                                                                                                                       MONTH 24
Source: IQVIA LMPB data

                                                                                                                                                                                                                                                                                                  42
HIV drugs, biologics in psoriasis, rheumatics and diabetes markets, and
     respiratory products show the fastest growth                                                                                                                                                                                                                                     Retail

                                                                              Original products launched between January 2017 and September 2018
                                                                                   with monthly sales above 30,000 EUR recorded at least once
                                                                                             (Value (MNF/EUR); 24 months as of launch)
                  250.000
                                                                                                                         R03L - TRIMBOW - 201804

                  200.000
Sales (MNF/EUR)

                  150.000      R03L - TRELEGY ELLIPTA - 201807

                  100.000

                   50.000

                       0
                            MONTH 1

                                      MONTH 2

                                                MONTH 3

                                                          MONTH 4

                                                                    MONTH 5

                                                                                 MONTH 6

                                                                                           MONTH 7

                                                                                                     MONTH 8

                                                                                                               MONTH 9

                                                                                                                            MONTH 10

                                                                                                                                       MONTH 11

                                                                                                                                                  MONTH 12

                                                                                                                                                             MONTH 13

                                                                                                                                                                        MONTH 14

                                                                                                                                                                                   MONTH 15

                                                                                                                                                                                              MONTH 16

                                                                                                                                                                                                         MONTH 17

                                                                                                                                                                                                                    MONTH 18

                                                                                                                                                                                                                               MONTH 19

                                                                                                                                                                                                                                          MONTH 20

                                                                                                                                                                                                                                                     MONTH 21

                                                                                                                                                                                                                                                                MONTH 22

                                                                                                                                                                                                                                                                           MONTH 23

                                                                                                                                                                                                                                                                                      MONTH 24
Source: IQVIA LMPB data

                                                                                                                                                                                                                                                                                                 43
HIV drugs, biologics in psoriasis, rheumatics and diabetes markets, and
     respiratory products show the fastest growth                                                                                                                                                                                                                                               Retail

                                                                                   Original products launched between January 2017 and September 2018
                                                                                        with monthly sales above 30,000 EUR recorded at least once
                                                                                                  (Value (MNF/EUR); 24 months as of launch)
                  1.400.000

                  1.200.000

                                                                                                                                                                                                                                                               J05C - ODEFSEY - 201701
                  1.000.000
Sales (MNF/EUR)

                                                                                                  J05C - SYMTUZA - 201804
                   800.000                        D05B - TREMFYA - 201807

                                                                                                                                                               M01C - XELJANZ - 201712
                   600.000                                                                                                                                                                                                                                            D05B - TALTZ - 201704
                                                                                                                                                                                      M01C - OLUMIANT - 201711

                   400.000
                                                                R03M - FASENRA - 201809
                                                                 A10C - FIASP - 201809           R03L - TRIMBOW - 201804
                   200.000                                       A10C - XULTOPHY - 201808
                                                                               R03L - TRELEGY ELLIPTA - 201807
                                                                  D05B - KYNTHEUM - 201809              M01C - KEVZARA - 201803
                         0
                              MONTH 1

                                        MONTH 2

                                                     MONTH 3

                                                               MONTH 4

                                                                         MONTH 5

                                                                                      MONTH 6

                                                                                                MONTH 7

                                                                                                          MONTH 8

                                                                                                                    MONTH 9

                                                                                                                              MONTH 10

                                                                                                                                         MONTH 11

                                                                                                                                                    MONTH 12

                                                                                                                                                                MONTH 13

                                                                                                                                                                           MONTH 14

                                                                                                                                                                                         MONTH 15

                                                                                                                                                                                                    MONTH 16

                                                                                                                                                                                                               MONTH 17

                                                                                                                                                                                                                          MONTH 18

                                                                                                                                                                                                                                     MONTH 19

                                                                                                                                                                                                                                                MONTH 20

                                                                                                                                                                                                                                                           MONTH 21

                                                                                                                                                                                                                                                                          MONTH 22

                                                                                                                                                                                                                                                                                     MONTH 23

                                                                                                                                                                                                                                                                                                MONTH 24
Source: IQVIA LMPB data

                                                                                                                                                                                                                                                                                                           44
Specific patterns cannot be traced when looking at generic products
     separately                                                                                                                                                                                                                                                                     Retail

                                                                              Generic products launched between January 2017 and September 2018
                                                                                  with monthly sales above 30,000 EUR recorded at least once
                                                                                            (Value (MNF/EUR); 24 months as of launch)
                  500.000

                  450.000
                                                                                                                                                                     Gx launched betwen Jan17 & Dec18 = 18,9M€
                  400.000

                  350.000
Sales (MNF/EUR)

                                                                                                                                                                            75% coming from 4 molecules :
                  300.000                                                                                                                                                         - Tadalafil
                  250.000                                                                                                                                                         - Rosuvastatine
                                                                                                                                                                                  - Ezetimibe
                  200.000
                                                                                                                                                                                  - Ethinylestradiol
                  150.000

                  100.000

                   50.000

                       0
                            MONTH 1

                                      MONTH 2

                                                MONTH 3

                                                          MONTH 4

                                                                    MONTH 5

                                                                                 MONTH 6

                                                                                           MONTH 7

                                                                                                     MONTH 8

                                                                                                               MONTH 9

                                                                                                                         MONTH 10

                                                                                                                                    MONTH 11

                                                                                                                                               MONTH 12

                                                                                                                                                          MONTH 13

                                                                                                                                                                      MONTH 14

                                                                                                                                                                                 MONTH 15

                                                                                                                                                                                            MONTH 16

                                                                                                                                                                                                       MONTH 17

                                                                                                                                                                                                                  MONTH 18

                                                                                                                                                                                                                             MONTH 19

                                                                                                                                                                                                                                        MONTH 20

                                                                                                                                                                                                                                                   MONTH 21

                                                                                                                                                                                                                                                              MONTH 22

                                                                                                                                                                                                                                                                         MONTH 23

                                                                                                                                                                                                                                                                                    MONTH 24
Source: IQVIA LMPB data

                                                                                                                                                                                                                                                                                               45
Hospital

           46
On the hospital market, Antineoplastic drugs lead in sales and growth,
 adding €229m additional sales for the period                                                                                                             Hospital

                                            Top 10 ATC2 classes in values with growing and declining – Hospital
                                                       (MNF Euro Value (Mio.); MAT December 2018)

         Antineoplastic agents (L01)                                                 Opdivo, Keytruda,   Systemic antivirals (J05)
                                                     908                     +35,4% Revlimid                                                   83     -22,9%

         Immunosuppressants (L04)        123 +8,7%         Remsima, Inflectra                     Systematic antimycotics (J02)      20       -3,1%

              Antihemorrhagics (B02) 104 +19,6%            Novoseven, Advate, Kovaltry                       Psycholeptics (N05)     17       -1,3%

             Ophthalmologicals (S01)     84 +12,8%         Lucentis, Eylea                                      Analgesics (N02)     17       -8,1%

                                                                                                   Antiseptics and disinfectants
               Immunoglobulins (J06)     79 +10,7%         Multigam, Privigen                                                        15       -2,3%
                                                                                                              (D08)

                     Antianemics (B03)   78 +10,9%         Aranesp, Injectafer                      Other gynecologicals (G02)       11     -0,7%

                                                                                                Drugs for acid related disorders
Other nervous system drugs (N07)         75 +15,6%         Gilenya, Lemtrada, Bridion                                                10     -5,2%
                                                                                                             (A02)

           Imaging diagnostics (T01)     74 +16,3%         Iomeron, Dotarem, Visipaque                   Psychoanaleptics (N06)      7     -1,1%

                                                           Piperacilline/Tazobactam,
     Systematic antibacterials (J01) 65 +6,5%                                                            Plasma expensers (K02)      4    -14,4%
                                                           Meropenem Fresenius Kabi

              Hormono therapy (L02) 63 +26,8%              Xtandi, Zytiga                          Lipid modifying agents (C10)      4    -21,6%

Source: IQVIA Hospital Audit

                                                                                                                                                                     47
On the hospital market, Antineoplastic drugs lead in sales and growth,
 adding €229m additional sales for the period                                                                                                          Hospital

                                            Top 10 ATC2 classes in values with growing and declining – Hospital
                                                       (MNF Euro Value (Mio.); MAT December 2018)

         Antineoplastic agents (L01)                                           Epclusa, Viekirax,    Systemic antivirals (J05)
                                                     908             +35,4% Daklinza                                                        83     -22,9%

         Immunosuppressants (L04)        123 +8,7%                                Cancidas      Systematic antimycotics (J02)     20       -3,1%

              Antihemorrhagics (B02) 104 +19,6%                                                   Xeplion   Psycholeptics (N05)   17       -1,3%

             Ophthalmologicals (S01)     84 +12,8%                  Paracetamol Fresenius Kabi, Dafalgan      Analgesics (N02)    17       -8,1%

                                                                                                 Antiseptics and disinfectants
               Immunoglobulins (J06)     79 +10,7%                               Iso-Betadine                                     15       -2,3%
                                                                                                            (D08)

                     Antianemics (B03)   78 +10,9%             Syntocinon, Prostin E2, Dostinex   Other gynecologicals (G02)      11     -0,7%
                                                             Pantomed Nycomed, Nexiam,     Drugs for acid related disorders
Other nervous system drugs (N07)         75 +15,6%           Losec Mups
                                                                                                                                  10     -5,2%
                                                                                                        (A02)

           Imaging diagnostics (T01)     74 +16,3%                             Sipralexa, Cymbalta   Psychoanaleptics (N06)       7     -1,1%

     Systematic antibacterials (J01) 65 +6,5%                 Volulyte, Voluven, Geloplasma MRX      Plasma expensers (K02)       4    -14,4%

              Hormono therapy (L02) 63 +26,8%                         Crestor, Inegy, Ezetrol    Lipid modifying agents (C10)     4    -21,6%

Source: IQVIA Hospital Audit

                                                                                                                                                                  48
The leaders on the hospital market remain consistent compared
 to last period                                                                                                                                                  Hospital

                               Top 20 hospital companies sales and annual growth              Growth since last MAT                                     Market growth
                               (MNF Euro Values (Mio.); MAT December 2018)                                                                                  19%

                         ROCHE                                         233,5                                                         15%
                MSD BELGIUM                                    185,8               +2   Keytruda                                                  37%
          NOVARTIS PHARMA                                  170,6                   -1                                               12%
          BRISTOL-M. SQUIBB                               164,9                    -1   Opdivo, Sprycel                               20%
              JANSSEN-CILAG                            138,8                            Imbruvica, Darzalex, Zytiga                              34%
                      CELGENE                    104,0                             +1   Revlimid                                           25%
                         AMGEN                  90,8                               -1                                          3%
               PFIZER+PFE BE                87,5                                   +9   Ibrance, Inflectra, Sutent, Ecalta                                         85%
             SANOFI BELGIUM                75,2                                    -1                                          5%
            TAKEDA BELGIUM               66,4                                      +3   Entyvio                                                  34%
 BAYER PHARMACEUTICALS                   63,6                                      -1                                           9%
             FRESENIUS KABI              59,9                                      -1                                           7%
                         ABBVIE      56,6                                               Maviret                                              32%
                        BAXTER      43,9                                                                                       5%
                 CSL BEHRING       42,0                                                                                              15,7%
           GILEAD SCIENCES         40,3                                            -7               -38%
              NOVO-NORDISK         38,5                                            +1   Novoseven                                                36%
                     ASTELLAS     32,5                                             -2                                               12%
               ASTRAZENECA        32,0                                                  Iressa, Lynparza, Tagrisso, Faslodex          19%
        SHIRE PHARMACEUT.         29,4                                             +1                                               14%
Source: IQVIA Hospital Audit

                                                                                                                                                                            49
Consumer Health

                  50
The Consumer Health market grew by 1.1% in the past year, driven by the
 performance of the patient care category                                Consumer
                                                                                                       Health

                                          Consumer Health market – Belgium
                                         (PUB Euro value; MAT December 2018)
                                         Total Consumer Health Market €1,997m
      Delta Absolute growth €21m                 1yr growth +1.1%               5yr growth +1.8%

                                         OTC €1,340m                            Registered €823m
                15%                      +0.8% 1y growth                        +0.4% 1y growth
                                         +1.4% 5y CAGR
        18%                              PEC €354m
                                                                                Non registered €517m
                                   67%   +0.4% 1y growth
                                                                                +1.6% 1y growth
                                         +2.1% 5y CAGR
                                         PAC + NTR €302m
                                         +2.8% 1y growth
                                         +3.8% 5y CAGR

Source: IQVIA Consumer Health Services

                                                                                                                51
Most of the biggest Consumer Health classes are OTC but are
 experiencing mixed performances                                                                                                                                 Consumer
                                                                                                                                                                  Health
                                                Top 10 OTC classes in values with growing and declining – Consumer Health
                                                               (PUB Euro Value (Mio.); MAT December 2018)

                     01 Cough Cold                      253                  +4,3% Rhinathiol, Medica, Physiomer     02 Pain Relief                268             -0,3%

                                                                             Promagnor, Tribvit,
       04 Vit/Minerals/Nutrit.Suppl               194                +1,0% Folavit                    82 Beauty Product For Women           116          -0,2%

    03 Digestive/Oth Intest Rems                  189               +1,0% Imodium, Movicol, Buscopan        10 Circulatory Products        81         -6,8%

                 06 Skin Treatment         90           +1,7% Iso-Betadine, Bepanthol, Cremicort H                     07 Eye Care     62             -0,2%

       83 Unisex Beauty Products           87        +7,1%       Cicaplast LRP, Anthelios, Mouskito                 35 Baby Foods      61             -1,5%

 13 Calm Sleep Mood Enhancing         46        +5,7% Sedistress, Sediplus, Metasleep                              86 Hair Products   46            -0,7%

      56 Tests & Measuring Instr.     28 +1,1%           One Touch Verio, Bayer Contour Next          12 Urinary And Repruduct Car    44            -2,5%

      30 Spec Enteral Nutrition Pr    27    +4,1%        Fortimel Com.Prote, Fresubin 2 Kcal                  85 Personal Hygiene     44           -1,9%

           47 Advanced Dressings      24 +8,8%           Flaminal, Flamigel, Opsite                      05 Tonics/Other Stimulants   42          -0,4%

          57 Medical/Surgical Aids    23 +8,3%           Krober Oxycure, Nexcare Coldhot               93 Oral Hygiene & Care Acce    17          -3,7%

Source: IQVIA Consumer
Health Services

                                                                                                                                                                            52
Most of the biggest Consumer Health classes are OTC but are
 experiencing mixed performances                                                                                                                                 Consumer
                                                                                                                                                                  Health
                                                Top 10 OTC classes in values with growing and declining – Consumer Health
                                                               (PUB Euro Value (Mio.); MAT December 2018)

                     01 Cough Cold                      253               +4,3%         Dafalgan, Voltaren Emulgel   02 Pain Relief                268             -0,3%

       04 Vit/Minerals/Nutrit.Suppl               194                                           82 Beauty Product For Women                 116          -0,2%
                                                                  +1,0%        Widmer Visage, Remederm, Widmer Yeux

    03 Digestive/Oth Intest Rems                  189             +1,0%           Arterin, Cardioaspirine   10 Circulatory Products        81         -6,8%

                 06 Skin Treatment         90             +1,7%                     Preservision 3, Hyabak, Systane    07 Eye Care     62             -0,2%

       83 Unisex Beauty Products           87             +7,1%               Nutrilon (2), Nan Optipro HA, Nan      35 Baby Foods     61             -1,5%

 13 Calm Sleep Mood Enhancing         46                +5,7%                       Nizoral-JPB, Dercos Shamp     86 Hair Products    46            -0,7%

      56 Tests & Measuring Instr.     28           +1,1%                                          12 Urinary And Repruduct Car        44            -2,5%
                                                                              Ymea, Canestene Gyn Clo., Prevalon

      30 Spec Enteral Nutrition Pr    27        +4,1%                               Saforelle, PH5-Eucerin    85 Personal Hygiene     44           -1,9%

           47 Advanced Dressings      24        +8,8%                 Biocure, A.Vogel (5), Tonixx   05 Tonics/Other Stimulants       42          -0,4%

          57 Medical/Surgical Aids    23    +8,3%                              Corega, Protefix   93 Oral Hygiene & Care Acce         17          -3,7%

Source: IQVIA Consumer
Health Services

                                                                                                                                                                            53
Johnson & Johnson retains its leadership in Belgium Consumer
 Health but the top 10 have overall seen negative performance                                                                                                                                  Consumer
                                                                                                                                                                                                Health

                                 Top 20 Consumer Health Companies Ranked by Sales                                      Growth since last MAT                                 Market growth
                                 (PUB Prices €m, MAT December 2018)                                                                                                              1.1%

            J&J CONS.                                                                                 87,7                                                     1,3%
                   GSK                                                                         75,8                         -6,3%                              Voltaren Emulgel, Voltapatch Tissugel
                  BMS                                                                   66,2            +1                                  -2,4%              Dafalgan, Sedergine, Niflugel
     OMEGA PHARMA                                                                    63,0                -1            -7,9%                                   XLS Medical, Arterin, Davitamon
         SANOFI CHC                                                                  62,3                                                                      1,2%
RECKITT BENCKISER                                                               58,8                                                            -0,7%
   TAKEDA BELGIUM                                                             57,1                                                      -2,8%                  Asaflow, Steovit, Magnecaps
 MERCK CONS.HLTH                                                             54,9                                                      -2,3%                   Omnibionta
  SMB LABORATOIRE                                                     49,4                                   Algostase Mono, Neo-Golaseptine, Afebryl                       4,6%
      MEDA PHARMA                                                47,0                                                                               -0,4%
            MELISANA                                            45,5                                                                                -0,2%
             NUTRICIA                                          44,2                                                                         -2,1%
                    EG                                   40,3                                           Cetirizine
                                                                                                        +1         EG, Paracetamol EG, Ibuprofen EG                                           11,2%
          QUALIPHAR                                      39,7                                           +2        Medica, Toularynx, Mouskito                                        7,9%
               TILMAN                                    39,6                                            -2                                                          2,7%
   LA ROCHE POSAY                                       39,0                                             -1                                                        1,7%
        METAGENICS                                    35,7                                                        Probactiol, Curcudyn, Metasleep                             5,5%
      LOUIS WIDMER                             29,8                                                                                    -2,7%
   NESTLE BELGILUX                            29,1                                   OTC       PEC                                                          0,0%
                VICHY                       25,8                                     PAC       NTR                                  -4,3%

Source: IQVIA Consumer Health Services

                                                                                                                                                                                                          54
Biosimilars

              55
2019 is expected to be the biggest year yet for biosimilars
                                           Share of Sales in Belgium – Originators and Biosimilars
                                                (MNF Euro Value (Mio.); MAT December 2018)
 Therapy Area         Molecule           Product                   Share of sales             Biosimilar                    Share of sales
                      Adalimumab         Humira                              100%             Imraldi, Amgevita                         0%
                      Etanercept         Enbrel                               94%             Benepali                                  6%
                      Infliximab         Remicade                             71%             Remsima, Inflectra, Flixabi               29%

 Antineoplastic &     Filgrastim         Neupogen                             73%             Tevagrastim, Nivestim                     27%
 Immunomod.           Trastuzumab        Herceptin                           100%             Herzuma                                   0%
                      Rituxumab          Mabthera                            100%
                      Bevacizumab        Avastin                             100%                                  Expected EU 2022
                      Nivolumab          Opdivo                              100%                                 Expected in EU 2024
                      Insulin Glargine   Toujeo, Lantus, Suliqua              98%             Abasaglar                                 2%
 Alimentary
                      Insulin Aspart     Novorapid, Novomix                  100%                                 Expected in EU 2022
 Blood                Epoetin Alfa       Eprex                                88%             Binocrit                                  12%
 Genito, sex
                      Follitropin Alfa   Gonal-F                              76%             Bemfola                                   24%
 hormones
 Hormonal             Somatropin         Genotonorm, Norditropin              82%             Omnitrope                                 18%

Source: IQVIA MIDAS

                                                                                                                                              56
HCPs

       57
Amongst the General Practitioners, 4,545 of them are
 responsible for 70% total market potential                                                                                                                           Prescriptions

                                                                                            Decile analysis
                                                           (Active GPs and Occupational GPs; prescription value (millions); MAT December 2018)
                                                                                           15,155 physicians
                                               600                                                                                               50%

                                                                                                                                                 45%
                                               500
               Prescription value (millions)

                                                                                                                                                 40%
                                                           35%                                                                                   35%
                                               400

                                                                                                                                                       Market share
                                                                                                                                                 30%

                                               300                                                                                               25%
                                                     555
                                                           20%          15%                                                                      20%
                                               200                                11%
                                                                                                                                                 15%
                                                                 312
                                                                                           8%
                                                                         228                                                                     10%
                                               100                                                  5%
                                                                                  169                          3%
                                                                                           124                        2%        1%       0%      5%
                                                                                                    86         54                8        1
                                                0                                                                    27                          0%
                                                     D1          D2      D3       D4       D5       D6         D7      D8       D9      D10
AVERAGE prescription
value per doctor per year                            366         206     151      112      82       57         36      18       6         1
(in thousands euro)

Source: IQVIA Xponent

                                                                                                                                                                                  58
Digital promotional spending has slowly grown compared to traditional
 spending, but levelled off in 2018 at 5%
 Corporate website and mailing represent over 80% of digital spending

                       Digital vs. Traditional promotional                                       Total Digital Spending
                                    spend EU5
Total €m       144                136          137            130        116      Web advertising
                                                                                  GPs/Primary care                           Meetings
100%                                                                                                             Detailing
                4%                5%           6%             6%          5%            5%                                     0%
                                                                                                                   2%
                                                                                                        Social                Apps
                                                                                                        media                  1%
  80%                                                                                                    11%

  60%                                                                                      Mailing
                                                                                            20%
               96%               95%           94%            94%        95%
  40%
                                                                                                             Corporate
                                                                                                              website
  20%                                                                                                          61%

   0%
             FY 2014            FY 2015   FY 2016           FY 2017     FY 2018                          € 9m
                        Traditional Spending         Digital Spending
Source: IQVIA ChannelDynamics

                                                                                                                                        59
When including Digital channels in the mix, it is important to target the
HCP’s who are receptive to these channels

                                                                            60
CONCLUSIONS
             Hospital market is the key driver of the market growth, and
               potentially as large as the Retail in a few years’ time

       Despite the slow down and stability of the Retail market, the launch
  performance and uptake will be an important driver for the Primary Care drugs

           Biosimilars are part of the market pictures, with some of them
            launched lately and a few others to come in the next years

         Use of the Digital channels in the promotion mix will also require a
                         good tactical plan to be successful

                                                                                  61
Thank you
You can also read