The non-fungible token (NFT) market and its relationship with - Blockchain Research Lab
←
→
Page content transcription
If your browser does not render page correctly, please read the page content below
BRL Working Paper Series No. 20

The non-fungible token (NFT) market and its relationship with
 Bitcoin and Ethereum
 Lennart Ante 1 *
 1
 Blockchain Research Lab, Max-Brauer-Allee 46, 22765 Hamburg
 * ante@blockchainresearchlab.org

 Published: 06 Jun 2021

 Abstract: Non-fungible tokens (NFTs) are transferrable rights to digital assets, such
 as art, in-game items, collectables or music. The phenomenon and its markets have
 grown significantly since early 2021. We investigate the interrelationships between
 NFT sales, NFT users (unique active blockchain wallets), and the pricing of Bitcoin
 and Ether. Using daily data between January 2018 and April 2021, we show that a
 Bitcoin price shock triggers an increase in NFT sales. Also, Ether price shocks
 reduce the number of active NFT wallets. The results suggest that (larger)
 cryptocurrency markets affect the growth and development of the (smaller) NFT
 market, but there is no reverse effect.

 Keywords: NFTs; non-fungible tokens; cryptocurrency

1 Introduction
Prominent examples of non-fungible tokens (NFTs), such as the artist Beeple selling a piece of
digital art for $69 million (Christie’s, 2021) or Twitter CEO Jack Dorsey auctioning off his
first-ever tweet for $2.9 million (Valuables, 2021), show that NFTs have received mainstream
attention. NFTs are unique certificates of authenticity on blockchains that are usually issued by
the creators of the underlying assets. These assets can be digital or physical in nature. Fungible
goods such as money or trade goods can be exchanged for goods of the same kind. By contrast,
non-fungible items cannot be exchanged for a similar good because their value exceeds the
actual material value. Examples from the analogue world include items of artistic or historical
significance, or rare trading cards—all of which have a long history of trading in auctions and
other marketplaces. In the digital world, it has so far been difficult to trade and auction non-
fungible goods as their authenticity was hard to verify. NFTs now pave the way for the
digitization and trade of unique values on the internet.

Within less than half a year (by May 16, 2021), hundreds of thousands of NFTs worth over
$800 million were traded (NonFungible, 2021). Most of these referred to digital art, collectibles,
music, in-game items or metaverses. Like cryptocurrency and other types of tokens, NFTs rely
on blockchain technology and smart contracts as their digital infrastructure (Ante, 2021);
however, they significantly differ from traditional cryptocurrencies such as Bitcoin or Ethereum

 1
in other respects. NFTs serve not as a currency, a commodity or a technology but as an asset
(Dowling, 2021a).
Besides the common technological infrastructure, NFT marketplaces such as OpenSea or
Rarible furthermore use cryptocurrency, most commonly Ether (ETH), as a payment and
trading option, evidencing a close relationship between the cryptocurrency market and the NFT
market. If users typically require cryptocurrency to buy NFTs, it is reasonable to assume that
the cryptocurrency market has an impact on the smaller NFT market. Dowling (2021a)
accordingly writes that anyone who is active in the NFT market recognizes the strong overlap
between participants in these two markets. To access and use cryptocurrencies is a complex
task; therefore, those who have mastered it are more likely to also participate in the NFT market.
There are few prior studies on the financial aspects of NFT markets. Nadini et al. (2021) map
the NFT ecosystem based on sales and traded volume across different projects, stakeholders
and other relevant characteristics. Dowling (2021b) examines the pricing behavior of a
particular NFT project, Decentraland, which enables the trading of digital plots of land in a
blockchain-based multiverse. In another study, Dowling (2021a) uses wavelet coherence
analysis to identify any co-movement between the cryptocurrency and the NFT markets. He
examines three major NFT submarkets (Decentraland, CryptoPunks and AxieInfinity), as well
as the prices of Bitcoin and Ether. The results suggest that cryptocurrency pricing behavior can
help understand NFT pricing patterns. Building on this, the aim of the present study is to
investigate how the markets for NFTs and cryptocurrencies are related. We extract macro data
on the Ethereum-based NFT market, more specifically the trading volume of all NFTs in USD
and the number of blockchain wallets participating in the NFT market (sellers and buyers), and
analyze how these relate to the pricing of Bitcoin and Ethereum using a cointegrated vector
autoregressive (VAR) model, i.e. a vector error correction model (VECM). This allows us to
identify to what extent these markets influence each other, or co-move.
Our data on overall trading volume and users should permit a better understanding of the NFT
phenomenon, with the existing research focusing on pricing aspects of NFT (sub)markets
(Dowling, 2021a, 2021b). We aim to clarify what impact changes in the prices of Bitcoin and
Ethereum have on the NFT market, which in turn helps to understand the impact or spillover
effect of the (larger) cryptocurrency markets on the (smaller) NFT market. It seems likely that
Bitcoin, as the market leader, drives the NFT market, as it does or did with respect to other
cryptocurrencies (Kumar and Ajaz, 2019). We also hope to determine whether demand shocks
in the NFT market affect the pricing of cryptocurrencies. The results contribute to lessons
learned on the co-movement and spillover of blockchain-based markets or assets (Kumar and
Anandarao, 2019; Moratis, 2021), and the use of on-chain data to assess blockchain-based
markets and their efficiency (Ante et al., 2021). The data set and methodology are described
below, followed by a presentation of the results and concluding remarks.

2 Data and methodology

Our dataset comprises 1,231 daily observations (January 01, 2018 to May 16, 2021) on the
volume of NFT sales in USD, the number of blockchain wallets holding or interacting with
NFTs on a particular day, and the prices of Ether (ETH) and Bitcoin (BTC) in USD. The first

 2
two metrics are collected from NonFungible Corporation (nonfungible.com) and cover data on
the Ethereum blockchain only, which (historically) accounts for a majority of the NFT market.
Price data (daily close) are collected from the cryptocurrency exchange Bitfinex (bitfinex.com).
In line with Dowling (2021a), as cryptocurrency reference markets we use ETH, the most
relevant currency for issuing and trading NFTs, and BTC, the largest and most significant
cryptocurrency.
Figure 1 shows the extreme increase in the trading volume of NFTs since early 2021. For
example, on the single day of May 03, 2021, over $100 million worth of NFTs were traded, and
the daily average trading volume of the year to date is much higher than in previous years ($6.13
million, compared to $0.18 million in 2020, $0.07 million in 2019, and $0.10 million in 2018).
The figure also shows that the number of wallets on the Ethereum blockchain holding NFTs
has increased significantly. For example, in March 2021, over 5,700 different wallets held
NFTs. The two metrics clearly illustrate the increasing relevance of NFTs, both in terms of
market volume and the number of users, as proxied by the number of blockchain wallets. The
two cryptocurrencies also peaked in 2021, at $63,537 (BTC) and $4,172 (ETH) respectively,
having traded significantly lower prior to that. Descriptive statistics on the raw series, the log
series and the log differences are presented in Table A.1.
 NFT sales in million USD Number of active NFT wallets
 120 6,000

 100 5,000

 80 4,000

 60 3,000

 40 2,000

 20 1,000

 0 0
 Jan-18 Sep-18 May-19 Jan-20 Sep-20 May-21 Jan-18 Sep-18 May-19 Jan-20 Sep-20 May-21

 ETH price in USD BTC price in USD
 5,000 75,000

 4,000
 50,000
 3,000

 2,000
 25,000
 1,000

 0 0
 Jan-18 Sep-18 May-19 Jan-20 Sep-20 May-21 Jan-18 Sep-18 May-19 Jan-20 Sep-20 May-21

Figure 1. NFT and cryptocurrency market data..

To investigate the relationship between the NFT market and the cryptocurrencies, we propose
a VAR framework, which can be used to structurally analyse the dependencies between several
variables. Here, we model vectors of variables as depending on their own lags and the lags of
other variables. With our four variables, the VAR model takes the following form.

 −1 −4 1,
 −1 −4 2,
[ ] = 0 + 1 [ ] + ⋯ + 4 [ ] + [ ] (1)
 −1 −4 3,
 −1 −4 4,

 3
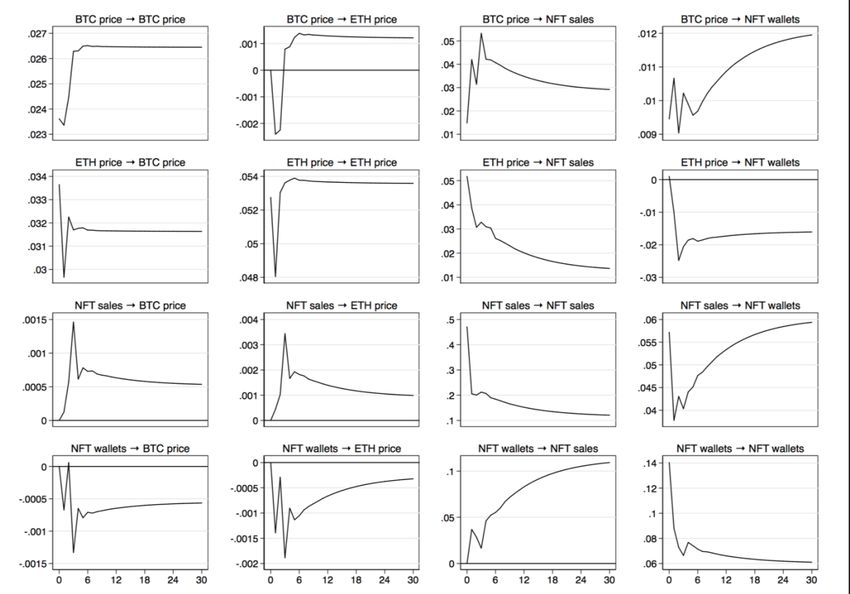
a0 is a vector of intercept terms and A1 to A4 are coefficients of a 4x4 matrix. The optimal
number of lags—4 in our case—is identified by the Akaike information criterion (AIC). All
four time series are stationary in their logarithmic form and all log differences are non-
stationary (cf. Table A.2), making VAR a suitable method. Yet the Johansen test of
cointegration (Johansen, 1991) indicates one cointegrating relationship (cf. Table A.3), thus
making the VECM—the cointegrated VAR—our choice of model.

3 Results and discussion
In the following, we present two postestimation statistics to interpret the results of the
cointegrated VAR. Table 4 lists short-run Granger causality test statistics that indicate whether
a change in one variable precedes a change in another variable. The statistics are calculated for
each combination of our dependent and independent variables. For example, the first line of
results refers to the test whether all coefficients on 4 lags of NFT wallets as a potential predictor
of NFT sales are zero. Since the p-value exceeds the significance threshold of 10%, we cannot
confirm that NFT wallets Granger-cause NFT sales. NFT sales are, however, Granger-caused
by the BTC price. Furthermore, NFT wallets are Granger-caused by the ETH price. BTC is not
Granger-caused by any of the other variables, while ETH is Granger-caused by the BTC price.
Accordingly, we find that NFT markets are influenced by cryptocurrency pricing, though
Granger causality tells us nothing about the direction of these influences.

Table 4. Short-run Granger causality. The table shows short-run Granger causality test statistics for
the VECM model.
 Dependent variable Independent variable F-statistic p-value
 NFT wallets 3.92 0.270
 NFT sales BTC price 10.32 0.016**
 ETH price 4.68 0.197
 NFT sales 6.25 0.100
 NFT wallets BTC price 1.22 0.747
 ETH price 13.09 0.004***
 NFT sales 1.89 0.596
 BTC price NFT wallets 11.86 0.603
 ETH price 5.53 0.137
 NFT sales 5.23 0.156
 ETH price NFT wallets 2.14 0.544
 BTC price 6.81 0.078*
*** p < 0.01; ** p < 0.5; * p < 0.1.

To understand that direction of influence, impulse response functions are shown in Figure 2.
They depict how a standard deviation shock to one variable affects another variable over a
period of 30 days. One impulse is placed in reach row and one response in each column.
Unlike with the VAR, impulse response functions of a VECM need not return to their mean
value, as series are cointegrated in the long-run. We find that one-time standard deviation shock
increases in the prices of BTC and ETH have positive effects on NFT sales. The effects level
off at around 0.03% for BTC and around 0.015% for ETH. Bitcoin price shocks have a clear
positive effect on the number of active NFT wallets. Surprisingly, the reverse effect applies to
the ETH price. As expected, NFT sales and the number of NFT wallets are positively related.
A 1% price shock of BTC has a negative short-term effect on the price of ETH. After about 5
days, the trend reverses, settling at a permanent effect of around 0.001%. An ETH price shock
 4
has a positive effect on the price of BTC (0.032%). Due to the existence of a long run
equilibrium relationship between series, impulse response functions must be interpreted with
caution for VECM models. They are helpful in interpreting the basic relationships between the
variables, map short-run effects and complement the above results of the short-run Granger
causalities.

Figure 2. Impulse response functions. Impulse response functions based on the VECM with 4 lags are
shown for a time horizon of 30 days.

4 Concluding remarks
This paper has analyzed the interplay between the cryptocurrency market and the NFT market,
contributing to the emerging literature on the latter. In line with Dowling's (2021a) conjecture,
we find that BTC and ETH pricing affects the NFT market, while the NFT market does not
significantly influence the pricing of cryptocurrencies. It thus appears that the smaller NFT
market is driven by the cryptocurrency market. This is plausible, as cryptocurrencies are the
common currency for buying and trading NFTs. A drop in cryptocurrency value means lower
purchasing power, which is likely to depress the NFT market. Conversely, when
cryptocurrencies appreciate, investors tend to look for new or alternative investment
opportunities. This is especially plausible in the context of ETH, the standard denomination of
NFTs. While the impulse response function indicates such a relationship between NFT sales
and ETH, we do not find a significant Granger causality between these metrics—yet we do so
for BTC.
Our results contribute to research on spillover effects between blockchain-based markets of
different sizes. For initial coin offerings (ICOs)—another market that is much small than
cryptocurrency—Masiak et al. (2019) have shown that shocks in cryptocurrency pricing have

 5
positive effects on market volume. Like NFTs, ICOs also typically rely on cryptocurrency for
payment. Similarly, stablecoin markets are driven by the demand for cryptocurrency (Ante et
al., 2020; Kristoufek, 2021). The question thus arises to what extent insights, issues and
challenges from other blockchain-based markets can be transferred to the NFT market. This
includes issues related to quality signaling in the context of token pricing or valuation (Fisch,
2019), investment returns (Domingo et al., 2020), or legal challenges (Hornuf et al., 2021).
A potential limitation of this study and at the same time an exciting challenge for future research
is the topic of NFT wash trading. This is an issue that poses significant challenges to blockchain-
based pseudo-anonymous markets and cryptocurrency markets (Cong et al., 2020; Le Pennec
et al., 2021). In principle, an owner or creator can trade her own NFT transparently but
anonymously by transferring it between two different addresses/wallets on the public
blockchain infrastructure. This way, demand can be suggested, faked or inflated with the goal
to attract future buyers. The legality of any such behavior is currently unclear. If it were to take
place, this could— besides the evident investor protection challenges—bias the statistics on
NFT sales and wallets and their interpretation used in this study. Accordingly, future research
might analyze (large) NFT sales, the blockchain addresses involved, and transaction patterns to
identify any wash trading.
We agree with Dowling’s (2021a) main conclusion “that NFTs do appear to be a distinct (and
exciting) new asset class”. While the NFT market still seems to depend on the cryptocurrency
market, specifically BTC, it may well mature over time. The question is to what extent this
relationship will change once traditional marketplaces such as eBay allow trading of NFTs
(against fiat currencies or stablecoins) (Reuters, 2021), established companies such as
Instagram fully appreciate the potential of NFTs (Keely, 2021), or media firms like Fox launch
their own NFT ventures (Khatri, 2021). In the future we may see NFT submarkets that are
strongly related to cryptocurrency markets and others that are much more independent. The
further development of the NFT market and its relationship to the cryptocurrency market thus
holds plenty more research interest.

References
Ante, L., 2021. Smart Contracts on the Blockchain – A Bibliometric Analysis and Review.
 Telemat. Informatics 57, 101519. https://doi.org/10.1016/j.tele.2020.101519
Ante, L., Fiedler, I., Strehle, E., 2021. he impact of transparent money flows: Effects of
 stablecoin transfers on the returns and trading volume of bitcoin. Technol. Forecast. Soc.
 Change 170, 120851. https://doi.org/10.1016/j.techfore.2021.120851
Ante, L., Fiedler, I., Strehle, E., 2020. The Influence of Stablecoin Issuances on
 Cryptocurrency Markets. Financ. Res. Lett. 101867.
 https://doi.org/10.1016/j.frl.2020.101867
Christie’s, 2021. Beeple (b. 1981) [WWW Document]. URL
 https://onlineonly.christies.com/s/first-open-beeple/beeple-b-1981-1/112924 (accessed
 3.25.21).
Cong, L., Li, X., Tang, K., Yang, Y., 2020. Crypto Wash Trading. SSRN Electron. J. 1–75.
 https://doi.org/10.2139/ssrn.3530220
Domingo, R.-S., Piñeiro-Chousa, J., Ángeles López-Cabarcos, M., 2020. What factors drive
 returns on initial coin offerings? Technol. Forecast. Soc. Change 153, 119915.
 https://doi.org/10.1016/j.techfore.2020.119915
Dowling, M., 2021a. Is non-fungible token pricing driven by cryptocurrencies? Financ. Res.
 Lett. 102097. https://doi.org/10.1016/j.frl.2021.102097

 6
Dowling, M., 2021b. Fertile LAND: Pricing non-fungible tokens. Financ. Res. Lett. 102096.
 https://doi.org/10.1016/j.frl.2021.102096
Fisch, C., 2019. Initial coin offerings (ICOs) to finance new ventures. J. Bus. Ventur. 34, 1–
 22. https://doi.org/10.1016/j.jbusvent.2018.09.007
Hornuf, L., Kück, T., Schwienbacher, A., 2021. Initial coin offerings, information disclosure,
 and fraud. Small Bus. Econ. https://doi.org/10.1007/s11187-021-00471-y
Johansen, S., 1991. Estimation and Hypothesis Testing of Cointegration Vectors in Gaussian
 Vector Autoregressive Models. Econometrica 59, 1551–1580.
 https://doi.org/10.2307/2938278
Keely, A., 2021. Instagram is hosting a professional development panel for NFT artists
 [WWW Document]. The Block. URL
 https://www.theblockcrypto.com/linked/105407/instagram-nft-artists-event (accessed
 5.20.21).
Khatri, Y., 2021. Fox is launching an NFT company and a blockchain-based animated series
 [WWW Document]. The Block. URL
 https://www.theblockcrypto.com/linked/105171/fox-nft-company-blockchain-based-
 animated-series (accessed 5.18.21).
Kristoufek, L., 2021. Tethered, or Untethered? On the interplay between stablecoins and
 major cryptoassets. Financ. Res. Lett. 101991.
 https://doi.org/https://doi.org/10.1016/j.frl.2021.101991
Kumar, A., Ajaz, T., 2019. Co-movement in crypto-currency markets: evidences from
 wavelet analysis. Financ. Innov. 5, 33. https://doi.org/10.1186/s40854-019-0143-3
Kumar, A., Anandarao, S., 2019. Volatility spillover in crypto-currency markets: Some
 evidences from GARCH and wavelet analysis. Phys. A Stat. Mech. its Appl. 524, 448–
 458. https://doi.org/10.1016/j.physa.2019.04.154
Le Pennec, G., Fiedler, I., Ante, L., 2021. Wash Trading at Cryptocurrency Exchanges.
 Financ. Res. Lett. 101982. https://doi.org/10.1016/j.frl.2021.101982
Moratis, G., 2021. Quantifying the spillover effect in the cryptocurrency market. Financ. Res.
 Lett. 38, 101534. https://doi.org/10.1016/j.frl.2020.101534
Nadini, M., Alessandretti, L., Di Giacinto, F., Martino, M., Aiello, L.M., Baronchelli, A.,
 2021. Mapping the NFT revolution: market trends, trade networks and visual features.
NonFungible, 2021. NFT Market History [WWW Document]. URL
 https://nonfungible.com/market/history (accessed 3.29.21).
Reuters, 2021. EBay says open to accepting to cryptocurrencies in future, exploring NFTs
 [WWW Document]. URL https://www.reuters.com/technology/ebay-ceo-says-looking-
 cryptocurrency-payment-option-cnbc-2021-05-03 (accessed 5.3.21).
Valuables, 2021. Auction site “just setting up my twttr” [WWW Document]. URL
 https://v.cent.co/tweet/20 (accessed 3.21.21).

 7
Appendix

Table A.1. Descriptive statistics. Descriptive statistics for the raw metrics, log-transformed series and
the logarithmic differences of 1,231 daily observations.
 Mean SD P50 Min Max Skewness Kurtosis
 Raw series
 NFT sales 780,199 3,644,778 78,349 14,591 102,000,000 485.80 18.59
 NFT wallets 1,261 767 1,026 233 5,701 11.41 2.65
 BTC price 13,139 13,458 8,818 3,281 63,537 7.78 2.43
 ETH price 503 606 246 85 4,172 12.92 2.90
 Log series
 NFT sales 11.73 1.44 11.27 9.59 18.44 5.64 11.73
 NFT wallets 7.02 0.47 6.93 5.45 8.65 4.38 7.02
 BTC price 5.80 0.83 5.51 4.45 8.34 3.07 5.80
 ETH price 9.19 0.68 9.08 8.10 11.06 4.24 9.19
 Log differences
 NFT sales 0.0021 0.5452 -0.0107 -3.4753 3.5531 11.0229 -0.0823
 NFT wallets 0.0001 0.1637 -0.0037 -1.0603 1.1160 11.2118 0.0688
 BTC price 0.0010 0.0413 0.0016 -0.4919 0.1789 21.0601 -1.4379
 ETH price 0.0013 0.0533 0.0012 -0.5801 0.2331 15.8410 -1.2076

Table A.2. Unit root tests.
 Log series Log differences
 ADF p-value ADF p-value
 NFT sales -1.593 0.4869 -17.219 0.0000***
 NFT wallets -2.452 0.1275 -16.536 0.0000***
 BTC price -0.011 0.9576 -12.264 0.0000***
 ETH price 0.084 0.9650 -11.902 0.0000***
*** p < 0.01; ** p < 0.5; * p < 0.1.

Table A.3. Johansen cointegration test.
 Hypothesized 5% Maximum 5%
 Trace
 number of Eigenvalue critical Eigenvalue critical
 statistic
 cointegrated vectors value statistic value
 0 64.48 39.89 30.04 23.80
 1 0.0317 24.92 24.31 14.35 17.89
 2 0.0124 9.63 12.53 2.13 11.44
 3 0.0067 1.42 3.84 0.11 3.84

 8
Declarations

Availability of data and materials

The datasets used and/or analyzed during the current study are
available from the corresponding author on request.

Conflicts of interest

Not applicable.

Funding

Not applicable.

Acknowledgements

None.

 About the Blockchain Research Lab

The Blockchain Research Lab promotes independent science and
research on blockchain technologies and the publication of the results
in the form of scientific papers and contributions to conferences and
other media. The BRL is a non-profit organization aiming, on the one
hand, to further the general understanding of the blockchain technology
and, on the other hand, to analyze the resulting challenges and
opportunities as well as their socio-economic consequences.

 www.blockchainresearchlab.org

 9
You can also read