COVID syndrome Financial markets' post - "Economics and Business of the post COVID-19 World" - HANFA

Page created by Lee Higgins
 
CONTINUE READING
COVID syndrome Financial markets' post - "Economics and Business of the post COVID-19 World" - HANFA
Financial markets’ post
        COVID syndrome
"Economics and Business of the post COVID-19 World"
   Economics of Digital Transformation (EDT) 2021

                  Ante Žigman, PhD

                   25th June 2021
COVID syndrome Financial markets' post - "Economics and Business of the post COVID-19 World" - HANFA
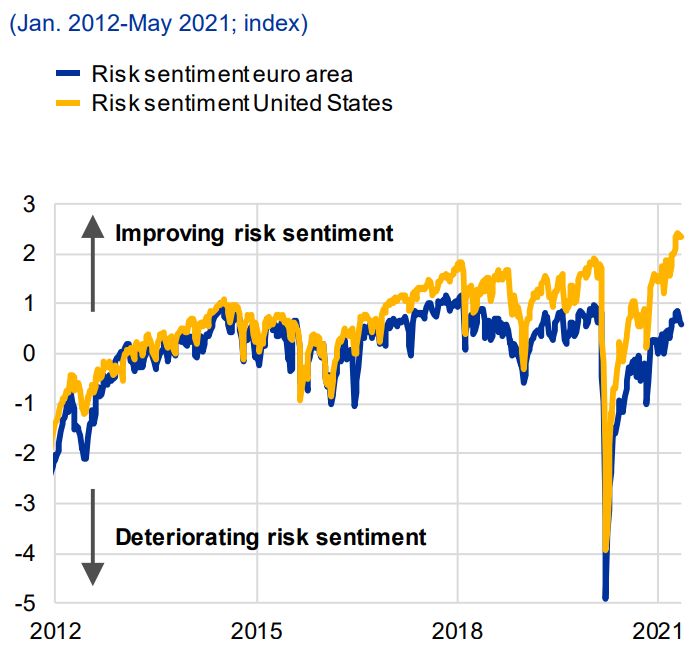
Economic policy response to COVID-19
Monetary conditions remain relaxed                                                                          Stabilisation of the economy has implicit fiscal costs
           Size of central bank COVID-19 asset purchases,                                                            Net public lending/borrowing,                Total consolidatet public debt,
                                                          ECB and FED policy rates, in %
           in % of 2020. GDP                                                                                         in % of GDP                                  in % of GDP

                    Croatia       Euro area      USA                  ECB Deposit facility    FED                                  EA19      HR        USA                     EA19       HR        USA

                                                                                                                 0
   15.0%
                                                                                                                                                             90
                                                       4

                                                                                                                -5
   10.0%
                                                                                                                                                             60

                                                       2

    5.0%                                                                                                       -10
                                                                                                                                                             30

                                                       0
    0.0%                                                                                                       -15                                           0

               Croatia        Euro area        USA          06   08    10    12   14    16   18   20   22                      2019                  2020                   2019                2020

Source: CNB, ECB, Eurostat and St. Louis FED                                                                Source: St. Lois FED, Eurostat

• Strong monetary and fiscal response to COVID-19 helped alleviate financial instability and prevented greater
  losses
• As a negative consequence fiscal position worsened
COVID syndrome Financial markets' post - "Economics and Business of the post COVID-19 World" - HANFA
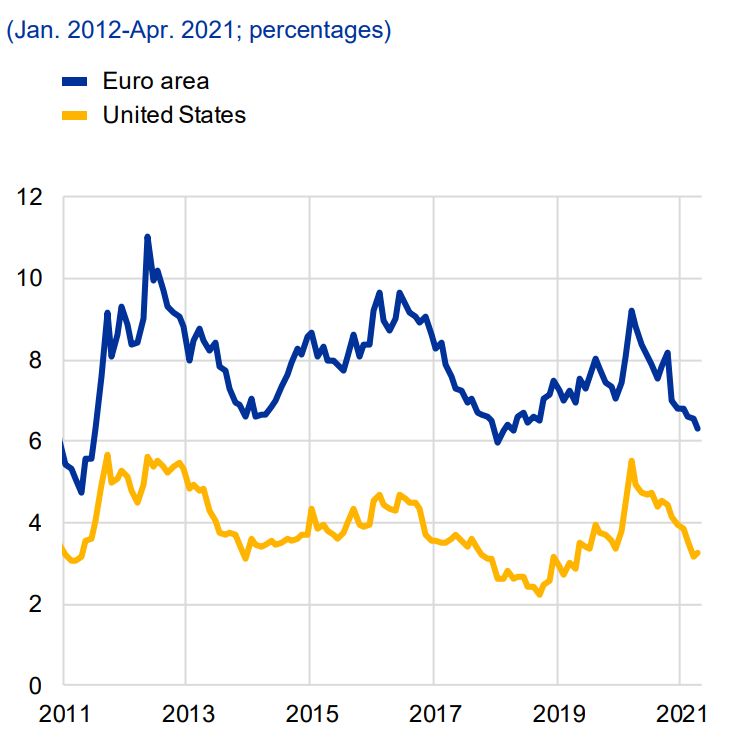
Post-covid recovery stronger than expected
Strong recovery in 2021. but slowdown in following years                                                                                                              Uptick in producer prices puts additional pressure on inflation
Real GDP growth rates, in %                                                                                                                                           Producer and consumer prices growth rate, in %

                                                                 China           Croatia               EU            USA                                                                                        Consumer prices     Producer prices

                                                                                                                                                                                         China                 Croatia              Euroa area                USA
   20.0%

   15.0%                                                                                                                                                                 7.5%

   10.0%
                                                                                                                                                                         5.0%

    5.0%
                                                                                                                                                                         2.5%

    0.0%
                                                                                                                                                                         0.0%
                     2021

                            2022

                                   2023

                                          2024

                                                          2021

                                                                   2022

                                                                          2023

                                                                                 2024

                                                                                                    2021

                                                                                                            2022

                                                                                                                   2023

                                                                                                                          2024

                                                                                                                                          2021

                                                                                                                                                 2022

                                                                                                                                                        2023

                                                                                                                                                               2024
            3/2021

                                                 3/2021

                                                                                           3/2021

                                                                                                                                 3/2021                                         Dec Jan Feb Mar Apr MayDec Jan Feb Mar Apr MayDec Jan Feb Mar Apr MayDec Jan Feb Mar Apr May

Note: Shaded area denote projected values.
Source: European comission, ST. Louis FED                                                                                                                             Source: Eurostat, ST. Louis FED

        • Solid conditions are established for economic recovery in the medium term
        • Upward pressures on prices could jeopardize expected recovery
COVID syndrome Financial markets' post - "Economics and Business of the post COVID-19 World" - HANFA
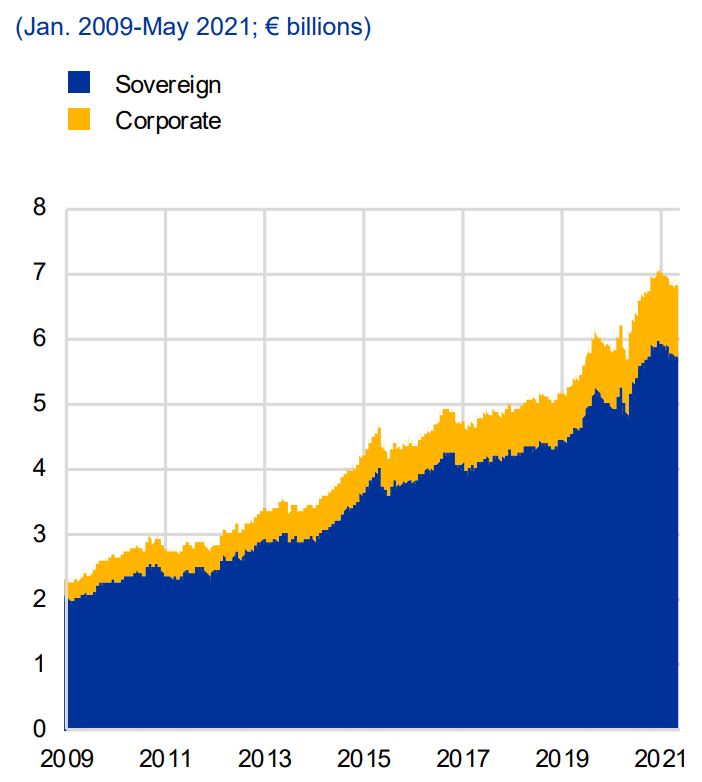
Systemic stress in financial markets dip down to
                                           levels before the pandemic
Significant reduction in systemic stress in financial markets                                                                  US stock market volatility decreased firmly in 2021
Composite indicator of systemic stress (CISS)                                                                                  VIX volatility index

                             Foreign exchange market          Financial intermediaries     Money market
                                                                                                                                  60
                             Stock market                     Correlation                  Bond market

                                                                                                                                  40
   0.50

   0.00
                                                                                                                                  20

          2000       2005        2010       2015       2020        Jul 2020     Oct 2020   Jan 2021      Apr 2021

                                                                                                                                       1990                 2000                     2010   2020
Note: A seven-day moving average of the value of the index and its components is shown. Areas marked in red indicate periods
of crisis in European financial markets.
Source: ECB                                                                                                                    Source: St. Louis FED

      • Reactions of economic policymakers alleviated stress in financial markets, which returned to pre-crisis
        levels by mid-June 2021
Nominal bond yields are rising considering
                                                economic recovery and inflation
Nominal yields remain at historical lows despite signs of potential increase                        Drivers of US Treasury yields
Yields to maturity on long-term government bonds, in %                                              May 2013-May 2021; basis points

                                   CEE countires       HR       Other EU countries   USA                                          Global demand shocks   US macro risk shocks
                                                                                                                                  Global risk shocks     US monetary policy shocks

                                                                                                      80
   7.5

                                                                                                      60
   5.0

                                                                                                      40

   2.5

                                                                                                      20

   0.0
                                                                                                       0
                2007        2009         2011         2013       2015         2017    2019   2021
                                                                                                                               2021                                  Taper tantrum

CEE countries are: BG, CZ, EE, HU, LV, LT, PL, RO, SI and SK.
Source: Bloomberg, Eurostat                                                                         Source: ECB

         • Signs of potential interest rate spike due to inflation concerns appeared at the beginning of the year
         • Nevertheless, sentiment towards monetary policy remained stable
Re-pricing risk of bond portfolios is increasing (interest rate
              risk), in line with observed increase in duration
    Amount of duration risk in euro area bond markets   Increase in maturity means bigger interest rate risk
                                                        Avg. residual bond portfolio maturity, in years

                                                                             Investment funds     Life insurance       Non-life insurance    Pension funds

                                                          8

                                                          6

                                                          4

                                                              2014.       2015.       2016.        2017.           2018.       2019.        2020.       2021.

    Source: ECB                                         Source: Hanfa

• Increased duration of investment portfolio due to search-for-yield behavior emphasizes interest-rate risks,
  globally and domestically
Croatian financial services sector assets are highly
                                    concentrated in bond investments
Pronounced concentration of investments in government bonds                                                       Relatively high concentration of bond portfolio investments
Investment structure of financial services sector by type of investment, in % (left) and                          Share of the five largest counterparties in total investments in bonds and shares, in %
annual rate of change, in HRK bn. (right)
                                                                                                                                                                        Bonds        Shares
                              Cash and deposits       Government bonds          Loans        Real estate
                              Corporate bonds         Investment funds          Other        Shares
                                                                                                                                  Insurance companies                 Investment funds                     Pension funds
                                                                                                                    100%
   100%

    75%                                                         20
                                                                                                                      75%

    50%
                                                                10
                                                                                                                      50%

    25%
                                                                 0

                                                                                                                      25%
     0%
        2016     2017    2018     2019    2020     2021                  2017       2018        2019       2020

                                                                                                                            11 12 13 14 15 16 17 18 19 20 21   11 12 13 14 15 16 17 18 19 20 21   11 12 13 14 15 16 17 18 19 20 21
Note: The investments of insurance companies, pension and investment funds are presented, which together form
almost 90% of the assets of the financial services market.
Source: Hanfa                                                                                                     Source: Bloomberg, Hanfa

     • Relatively high concentration of bond investments exposes domestic institutional investors to potentially
       sizeable revaluation losses
Stock markets growth on the basis of
                                                        economic recovery expectations
Global equity and bond market developments                                                                                      Strong financial markets rebound on the basis of quick recovery expectations
Index, 31.12.2021=100
                                                                                                                                         Major stock indices, quarterly rate of change (%)                  Real gdp, yearly rate of change (%)
                                                                                                                                   US                                                                 US
                                                         Bonds         Stocks                                                      UK                                                                 UK
                                                                                                                                   SK                                                                 SK
                                                                                                                                    SI                                                                 SI
                                                                                                                                   SE                                                                 SE
                                                                                                                                   RO                                                                 RO
   110                                                                                                                             PT                                                                 PT
                                                                                                                                   PL                                                                 PL
                                                                                                                                   NL                                                                 NO
                                                                                                                                   MT                                                                 NL
                                                                                                                                   LV                                                                 MT
   100                                                                                                                                                                                                LV
                                                                                                                                   LU
                                                                                                                                   LT                                                                 LU
                                                                                                                                    IT                                                                LT
                                                                                                                                    IE                                                                 IT
    90                                                                                                                             HU                                                                  IE
                                                                                                                                                                                                      HU
                                                                                                                                   HR                                                                 HR
                                                                                                                                   GR                                                                 FR
                                                                                                                                   FR                                                                  FI
    80                                                                                                                              FI                                                                ES
                                                                                                                                   ES                                                                 EL
                                                                                                                                   EE                                                                 EE
                                                                                                                                   DK                                                                 DK
    70                                                                                                                             DE                                                                 DE
                                                                                                                                   CZ                                                                 CZ
                                                                                                                                   CY                                                                 CY
                                                                                                                                   BG                                                                 BG
    60                                                                                                                             BE                                                                 BE
                                                                                                                                   AT                                                                 AT
                     Apr 2020           Jul 2020          Oct 2020           Jan 2021          Apr 2021              Jul 2021            2016     2017      2018      2019      2020      2021              2016     2017      2018      2019      2020      2021

Note: Global stock index is represented by MSCI All Country World Index, while global bond index is represented by              Note: Color of the square for a particular date indicates position of historical distribution of obsereved indicator for a particular
Bloomberg Barclays Multiverse Index.                                                                                            country where green color indicates very high growth rates and red color very low growth rate.
Source: Bloomberg                                                                                                               Source: Eurostat, St. Louis FED

  • Despite the huge contraction, global stocks outperformed global bonds due to strong recovery
  • Record stock valuations in current subdued economic activity circumstances
Investors’ glass is half full (maybe?)
Domestic investor sentiment recovered in hightened uncertainty environment                                         Risk sentiment indices
Investor sentiment index in domestic capital market

    2.5

                                                                              1
    0.0

                                                                              0
   -2.5

                                                                              -1
   -5.0
           07 08 09 10 11 12 13 14 15 16 17 18 19 20 21 22                         04-20 07-20 10-20 01-21 04-21

Note: Marked area indicates crisis period starting with 20th February 2020.
Source: Hanfa                                                                                                      Source: ECB

• Risk sentiment in both the euro area and the US continues improving
• Croatia investor sentiment index indicates a continuation of a positive trend after the transitory dip at the
  beginning of the crisis
Strong market recovery rally took place at the beginning of
                                          2021…
Stock market recovery accelerated after US elections and news of                                                           Most CEE stock markets redeemed value lost at beginning of crisis
vaccine introduction                                                                                                       Value of leading stock indices in selected CEE countries, 100 = 31.12.2019.
Average value of leading stock indices in EU countries
         100 = 31.12.2007                                             100 = 31.12.2019                                                                                 End 2019         End 2020          Mid May 2021

                                      CEE countries        HR       Other EU countries       USA                              130

                                                                120                                                           110

   200

                                                                100                                                            90

   100
                                                                 80
                                                                                                                               70

            09     11     13     15      17    19     21                 Mar-20 Jun-20 Sep-20 Dec-20 Mar-21 Jun-21
                                                                                                                                       BG         CZ        EE        HR        HU        LT        LV         PL        RO   SI   SK

Note: CEE countries are: BG, CZ, EE, HU, LV, LT, PL, RO, SK and SI. Vertical lines indicate November 3 for US elections,
and December 11 when the first COVID-19 vaccine was approved.                                                              Note: Vertical lines denote range of values observed since end of 2019. until 14th od May 2021.
Source: Bloomberg                                                                                                          Source: Bloomberg

     • US elections and the start of the vaccination process gave a boost to stock markets recovery at end of 2020
     • Most emerging markets redeemed lost value by mid-May 2021
… however, the growth is asymmetrical between and within
                                   individual markets
K-shaped recovery driven primarly by recovery expectations                                                     Major domestic stock prices fully recovered lost ground in 2020
Selected STOXX Europe 600 sector stock indices, 100 = 1.1.2020                                                 Selected domestic sector stock indices, 100 = 1.1.2020

                    Banks and insurance         Industry   Stoxx 600       Technology   Traveling                                                 Construction     Food industry        Tourism
                                                                                                                                                  CROBEXplus       Industry

                                                                                                                 200
  120

  100
                                                                                                                 150

    80

                                                                                                                 100
    60

    40
         Jan-2020                    Jul-2020                          Jan-2021                     Jul-2021           Jan-2020                   Jul-2020                         Jan-2021       Jul-2021

Source: Bloomberg                                                                                              Source: ZSE

  • Technology and industry leads the way in EU markets, but cyclical sectors (such as banks and insurance) are catching up
  • However, inflation expectations could jeopardize relatively high market valuations of growth companies (such as certain IT
    companies)
Flying to close to sun?
Record stock market valuations rely on continuation of low interest-rate environment                                Excess CAPE yield
S&P500 index (left), cyclically adjusted price-to-earnings ratio - CAPE (middle),
long-term bond yield and excess cyclically adjusted stock market yield (right)

                            S&P500          CAPE        Long interest rate (%)      Excess CAPE yield (%)

    4000
                                            40                                    7.5

    3000
                                                                                  5.0
                                            30

    2000
                                                                                  2.5

                                            20
    1000
                                                                                  0.0

           1990   2000      2010     2020        1990   2000     2010      2020         1990   2000   2010   2020

                                                                                                                    Source: ECB
Source: Robert J. Shiller

•    Albeit realizing record high valuations, excess yields (relative to long term bonds) in US and EA markets are still
     within the range observed in the last decade
•    Change in interest rate environment could bring the prices down
Domestic market price recovery accompanied by increased
                                   market concentration
The recovery of prices in the domestic capital market in the environment of subdued                  Stock market liquidity stable in 2021, but trading becomes more concentrated
trading                                                                                              Share of the first three and the first five most traded stocks in total turnover
          Turnover on the ZSE regular market, in HRKm         ZSE market capitalization, in HRKbn
                                                                                                                                                         Top 3          Top 5
               Bonds      Other instruments    Stocks                   Bonds      ETF      Stocks

                                                                                                       80

   1000                                                 200
                                                                                                       60

    500                                                 100
                                                                                                       40

      0                                                  0

          2014 2015 2016 2017 2018 2019 2020 2021                    2019        2020        2021           2014          2015       2016         2017           2018           2019    2020   2021

Source: ZSE, Hanfa                                                                                   Source: ZSE, Hanfa

    • The beginning of 2021 was highlighted by a recovery in prices in the domestic capital market, but trading remains at
      suppressed levels
    • In 2020, the multi-year trend of increasing the concentration of trading on the domestic stock market continued, which
      emphasizes the possibility of contagion and the propagation of disturbances through parts of the financial system
Market risks of domestic financial services sector remain
                                     pronounced in 2021
Exposure to market risks is growing                                                                             Materialization of market risk in 2020
Share of equity and investment funds in assets/investments, in %                                                Estimated loss per shares and units in investment funds in the scenario with probability of
                                                                                                                occurence of 5%, in % of assets
                                                     Equity   Investment funds
                                                                                                                                                                            Portfolio VaR           VaR

                              Insurance                                            Mandatory
                                                                                                                                        Mandatory                                 UCITS                               Voluntary
  30%

  20%

  10%                                                                                                              10.0%

    0%

                               UCITS                                               Voluntary
                                                                                                                    5.0%
  30%

  20%

  10%
                                                                                                                           15    16   17   18    19   20    21    15   16    17    18     19   20    21   15   16   17   18   19   20    21
    0%
         2015   2016   2017   2018     2019   2020     2021   2015   2016   2017    2018   2019   2020   2021   Note: The blue line indicates the portfolio Value at Risk of the portfolio on the observed day, while the red line indicates
                                                                                                                the number Value at Risk values of the individual exposures estimated based on weekly returns in a moving time horizont
                                                                                                                of one year.
Source: Hanfa                                                                                                   Source: Hanfa

    • Slight increase in exposure to market risks through the investments in equity and investment funds’ shares
      (search for returns)
    • Despite stabilization in 2020, market risks remain elevated
Alongside the growth of equity investments, foreign
                       investments are growing progressively (equity and IF)
Increase in cross-border exposures                                                                     Bonds remain being dominant component in foreign transactions
Transactions in financial assets of the financial services sector to the counterparty, in HRKbn        Annual transactions of investments in foreign assets by type of instrument, in HRKbn

                        Central bank            Enterprises      Government          Other                                            Bonds      Investment funds     Other      Shares
                        Credit institutions     Foreign sector   Investment funds    Other FI
                                                                                                         8

  20                                                                                                     6

                                                                                                         4

  10

                                                                                                         2

   0
                                                                                                         0

             2012     2013        2014        2015      2016     2017      2018     2019        2020               2012     2013     2014      2015      2016       2017      2018        2019   2020

Source: CNB, Hanfa                                                                                     Source: CNB, Hanfa

• The growth of cross-border exposure brings potential diversification benefits as it reduces the exposure to the
  domestic government
• At the same time, the sector is exposed to higher volatility and potential shocks in foreign capital markets
Positive market trends have returned investors to the funds
Investors return in investment funds with underlined growth of market valuations                                In 2021, there were no pressures on the liquidity position of UCITS funds
Quarterly change in net assets of investment funds, in HRKbn                                                    Trade of UCITS funds units, in HRKbn
                                                                                                                      Total payins and payouts                        Net payins by fund category
                                     Exchange rate changes            Market trends      Net receipts
                                                                                                                                                                                    Balanced        Equity
                                                                                                                                    Payins       Payouts
                           Investment funds                                              Pension funds                                                                              Bond            Other
    2.5

                                                                                                                  8
                                                                                                                                                               1.00
                                                                3.0
    0.0
                                                                                                                  6                                            0.75

   -2.5                                                         0.0
                                                                                                                                                               0.50
                                                                                                                  4

   -5.0                                                        -3.0                                                                                            0.25
                                                                                                                  2

                                                                                                                                                               0.00
   -7.5
      2018          2019          2020           2021              2018           2019         2020      2021     0
                                                                                                                      10 11 12 13 14 15 16 17 18 19 20 21 22             Jul-20    Oct-20      Jan-21        Apr-21

Note: Net receipts stand for net payments into funds in the observed quarter.
Source: Hanfa                                                                                                   Source: Hanfa

• At the beginning of 2021, investment and pension funds recorded stable growth under the impact of positive
  market trends as well as positive net payments
• Bond funds remain the most popular fund type
Profitability of investment and pension funds remained
                             relatively stable in 2020 is improving
Recovery of UCITS funds returns in early 2021                                                                       Profitability of mandatory pension funds
Annual returns of individual categories of UCITS funds, in %                                                        Annual returns of MIREX indices

                                 Balanced                                                     Bond
                                                                                                                                                             A category    B category    C category

                                                                  5.0%
      10%                                                                                                             20.0%

                                                                  2.5%
       0%
                                                                                                                      15.0%
                                                                  0.0%
     -10%
            2017      2018       2019       2020       2021              2017      2018      2019     2020   2021
                                                                                                                      10.0%
                                   Equity                                                     Other

    30.0%                                                                                                               5.0%
                                                                  20%
    20.0%
    10.0%                                                         10%
                                                                                                                        0.0%
     0.0%
                                                                    0%
   -10.0%
                                                                                                                       -5.0%
            2017      2018       2019       2020       2021              2017      2018      2019     2020   2021
                                                                                                                                    Dec-15 Jun-16 Dec-16 Jun-17 Dec-17 Jun-18 Dec-18 Jun-19 Dec-19 Jun-20 Dec-20 Jun-21

Note: The marked area indicates the interquartile range of indicators by individual funds.
Source: Hanfa                                                                                                       Source: Hanfa

• Almost all categories of pension and investment funds achieved positive returns in 2020  value of investor
  assets preserved in challenging circumstances
• Profitability recovery at the beginning of 2021 mainly under the influence of the recovery of investor
  sentiment and positive market trends
A strong ESG proposition can help create additonal excessive
          business value across the financial services sector

                    Environment                               Social                              Governance

                  One of the most important         The social impact may not                Staying ahead of violations,
                 concerns of the 21st century      be evident right at the onset,            ensuring transparency and
                                                     but it is an integral part             industry best practices, and
                   Sustainable practices attract
                                                                                              dialogue with regulators
                  more customers, allows better    How a company fosters its people
                   access to resources, lowers     and culture will have ripple effects     Sustainable practices may lead to
                  energy and water consumption      on the broader community. Their          government support, subsidies,
                  and therefore also can reduce     inclusivity and diversity will pave     overcoming increasing regulatory
                        operational costs.          the way for a sustainable future.     pressure and better investor relations.

• Marked by the COVID-19 pandemic and the global social and economic crisis, 2020 emphasized the
  importance of sustainable financing
• Nowadays, ESG criteria have become a reference for socially responsible investing  complete integration of
  ESG factors in investment policies is of a great importance
Strong investor demand for ESG and crypto funds suggests that
  the pandemic has increased the overall awareness of the global
                       sustainability needs
                                                                                          The number of ESG UCITS in Europe has been rising at a
                                                                                          steady rate of 20% annually during the last five years in
                                                                                          response to the ever-growing demand for sustainable investing

                                                                                          Equity funds are the most dominant ESG fund type, counting
  During the last five years in Europe, the
  number of ESG funds has grown at more
                                                                                          for 56% of ESG UCITS net assets.
  than double the rate of non-ESG funds

                           While non-ESG funds saw a growth in net assets                 The COVID-19 pandemic, which led to a sharp fall in global
                               of only 4.8% in 2020, ESG funds recorded a                 markets in March 2020, did not halt the growth of the ESG
                                                      growth rate of 37.1%                market in 2020
 The gross annual performance of European ESG
 equity funds reached on average 10.4% in 2016-                                           Recognizing the relevance of a sustainable financing in
 2020. This compares to 9.2% for non-ESG funds                                            domestic market  two ESG funds were founded in last
                                   Social funds have experienced substantial growth in
                                                                                          year
                                         demand, but environmental funds still hold the
                                                dominant position in the ESG universe.
                                                                                          Growing interest in digital assets  international hedge
                                                                                          funds significantly increase their exposure to
                                                                                          cryptocurrencies

Source: EFAMA, Hanfa
                                                                                          Interest into crypto is rising in domestic market  first
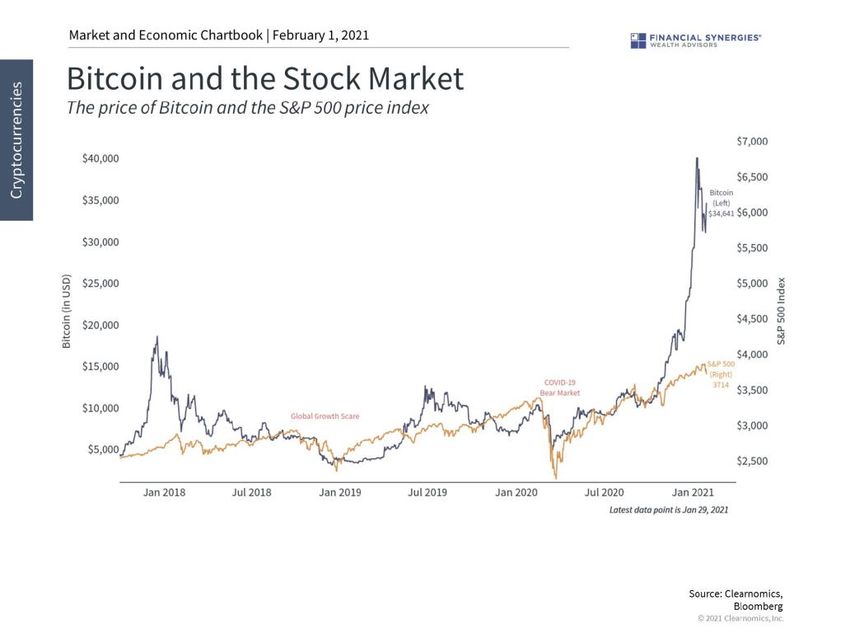
                                                                                          domestic crypto fund established and is in proceeding
Dynamics of crypto market

               THE      The crypto currency world is growing
1            GROWTH
                        exponentially and has reached market
                        cap that now exceeds $1 trillion

                CRYPTO AS        Not only Bitcoin, but Zcash,
    2        DIGITAL ASSET
                                 Chainlink, Ripple, Litecoin,
                                 Ethereum

                                         Unlike before, today's crypto
                  SUPPORTED BY           market is being propelled by
        3          INSTITUTIONS
                                         institutional adoption and big
                                         money entering the field rather
                                         than retail investors

                                         Interest for crypto currency
                 CROATIA IS NOT          investment is also growing in
        4         AN EXCEPTION
                                         Croatia, as evidenced by launch
                                         of first local „crypto” fund
                                                                                 Apple

                                                                             Microsoft

                                 Potential for long term gain and
    5          TRUST ISSUES      diversification of portfolios but data
                                 security issues are present
                                                                           Kriptovalute

                                                                              Amazon

                        Consumer/investor education is required               Alphabet
                        due to the fact this is a very volatile and
6           EDUCATION   opaque /non transparent asset class with
                        high risk of market manipulation                     Facebook

                                                                                 Tesla
Closing remarks

      What we have learned from                                     The economy of the future
        COVID-19 pandemic?                               •   pandemic has already outlined a future in which the sectors
                                                             that traditionally boosted GDP the most are going to be
•   the world of today is truly interconnected
                                                             challenged in the medium term by new, growing sectors
     systemic stress like this can occur
                                                         •   digitalisation, in line with growing respect for the environment,
    anytime and disrupt the entire global
                                                             will mark the economy of the future
    economy
                                                         •   the fourth industrial revolution  efficiency and quality of
•   technology and science have never been
                                                             production processes and the optimisation of decision-making
    more important
                                                              ESG propositions incorporated in business policies
•   the need to maintain a healthy relationship
                                                         •   green recovery proposed by the EU grouped into two main
    with the environment
                                                             objectives: create a generation of employment and wealth
•   importance of macroprudential policies
                                                             and fight against climate change
    and prompt response of regulators
                                                         •   new opportunities for financial services markets
Thank you for attention!
You can also read