Market Performance Report - 1Q20 - State House Uganda
←
→
Page content transcription
If your browser does not render page correctly, please read the page content below

1Q20
                                                            Report
                                                            Market
                                                            Performance

1
    UCC - Market Performance Report   January
                                      March   2020
                                            2020
Legal Disclaimer
                                  The information and figures contained herein were obtained from licensees’ submissions to the
                                  Commission and other sources available to the Commission. It is intended to provide the communications
                                  market overview to:
                                  1.    The industry,
                                  2.    Prospective entrants,
                                  3.    Government,
                                  4.    Academia and other stakeholders.

                                  UCC does not give any warranty and may not be liable for the interpretation arising from its use or misuse.
March 2020
UCC - Market Performance Report

          2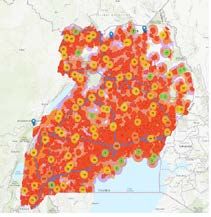
Introduction
This is a review of the industry performance, trends and key developments for the quarter starting January
to March 2020. The quarter on quarter variations reported are for Q4 2019 to Q1 2020. The report covers:

1.    Telephone Subscriptions
2.    Internet Subscriptions
3.    Mobile Financial Services
4.    Network Growth
5.    Domestic Voice Traffic
6.    Broadband Traffic
7.    International Traffic
8.    Monthly Average User Traffic
9.    Roaming
10.   OTT Services
11.   Revenues
12.   Cost of service
13.   International Interconnect
14.   Postal Services
15.   TV market
16.   Programming & Local Content.

                                                                                                             March 2020
                                                                                                             UCC - Market Performance Report

                                                                                                                      3
Section A : Access
1. TELEPHONE SUBSCRIPTIONS
The industry grew from 26.7 million active subscriptions in December 2019 to 28.4 million at the end
of March 2020. This translates into a total growth of 1.8 million subscribers and a quarter-to-quarter
growth of 7%.
Quarter-on-Quarter Growth
There were
1.8 Million
28,450,429
1,759,298
new additions
1,006,423 26,691,131
between 4Q19
213,730
25,682,708
696,362
24,772,616
25,468,97 8 and 1Q20“
1Q19 2Q19 3Q19 4Q19 1Q20
The strongest growth was realised in the Mobile segment with 1.8 million new mobile subs,
while growth in fixed line subscriptions was marginal with less than a thousand new connections.
1Q20
Quarter-on-Quarter Growth
4Q19
3Q19
28,364,500
26,605,421
25,601,343
85,710 85,929
Mobile Subscribers
81,274 4% growth 7% growth
Fixed line Subscribers
Note: These numbers are drawn from registered mobile subscriptions that have undertaken at least
one billable service in the 90-day period ending March 31st, 2020.
March 2020
Based on 2020 population estimates of 41.5 million, national tele-density now stands at 67% having
grown from 66% at the end of December 2019.
The growth in subs in the quarter Jan – to March 2020 reflects the highest three-month growth rate
in the financial year 2019/20. This is despite the traditional subscriber peaks associated with the
December festivities. The unusual performance in Jan-March could in part be attributed to adoption
of digital work methods, ‘Work-From-Home’ offers, as well as international returning residents in light
UCC - Market Performance Report
of the global pandemic towards the end of the review period.
In comparison with 1Q19, the subscriber growth realised in 1Q20 is almost twice that in the same
period last year:
43.5
2
2. INTERNET SUBSCRIPTIONS
The broadband segment has, for the first time posted more than 1 million new connections in two
consecutive quarters. In the quarter Jan-March, 1.2 million new broadband connections were posted.
This followed 1.4 million new subs posted in the preceding quarter.
Total internet subscriptions have grown by 31% over the last 12 months.
The mobile (sim enabled devices) again stands out as the internet access medium of choice
accounting for more than 95% of new growth in the quarter. At the end of the review period, mobile
internet subscriptions accounted for 99.6% of all internet subscriptions in Uganda.
Spread of Mobile and Fixed Internet Subscriptions
18,846,885
16,906,819
Total internet
subscriptions
have grown by Fixed internet subscribers
31% between
1Q19 to 1Q20.
32,370
30,440 Mobile internet subscribers
16,939,189 18,877,325
4Q19 1Q20
Device Distribution of Network Connected Devices
BASIC MOBILE PHONE FEATURE PHONES
Can make calls and Can make and receive calls, send
send text messages text messages and provide some of
the advanced features found on a
smartphone.
March 2020
Monthly Users Monthly Users
Jan-20 3,422,727 Jan-20 17,458,317
Feb-20 5,071,470 Feb-20 17,072,042
Mar-20 5,076,937 Mar-20 17,278,770
UCC - Market Performance Report
SMARTPHONES
A class of mobile phones and of multi-purpose mobile computing
devices. They are distinguished from feature phones by their
stronger hardware capabilities and extensive mobile operating
systems, which facilitate wider software, internet (including web
browsing overmobile broadband), and multimedia functionality
(including music, video, cameras, and gaming), alongside core
phone functions such as voice calls and text messaging.
Monthly Users
Jan-20 6,860,946
Feb-20 6,981,855
Mar-20 7,091,860 5In terms of penetration, the new growth in internet subscriptions and internet-enabled hardware on
the market translates into an internet penetration of 45 internet connections per 100 Ugandans.
Smartphones and feature phones with basic internet access remain the driver of new mobile internet
subscriptions, growing from 23.8 million feature and smartphones in December 2019 to 24.4 million
in March 2020.
During the period, 12 handsets and CPE terminals received Type Approval authorisations from the
regulator:
Company Equipment/Device Detail
ATOM VIDA
Smart T-pro M571M3
A2229
A2230
A2296
A2251
A2228
A2232
A2179
A2289
Reach Communications LTD Hero K6
SM-A955Z
The new growth in mobile internet subscriptions could in part be attributed to heavy promotional
activity by MNOs and independent hardware distributors. Some of the highlights include:
An e-commerce platform (Jumia) offered a 70% discount on all technology products
sold on its platform. These products included smartphones, feature phones,
laptops, among others. The campaign - dubbed ‘Tech Week’ - ran from 19th March to
March 2020
27th March 2020.
Airtel Uganda collaborated with iTel Mobile Uganda to offer the iTel A56 to consumers.
The model, which is the latest addition in the A-Series line, comes pre-loaded monthly
data bundles of 3GB for 3G smartphones and 5GB for 4G smartphones.
3. MOBILE FINANCIAL SERVICES
UCC - Market Performance Report
Registered Mobile Money accounts have grown by almost 700,000 new registrations from 24.7
million registered accounts in December 2019 to 25.4 million registered mobile money accounts.
Of these, 21 million accounts had partaken in at least one billable mobile money transaction in the 90
days preceding 31st March 2020.
From the above, it is evident that growth was posted in terms of both subscriptions and Mobile Wallet
activity during the review period.
While registered accounts grew at only 0.9% during the quarter, the growth in active mobile money
accounts averaged 4% during the period. 75% of the new wallet activity is drawn from previously
6 dormant accounts.This resurgence in wallet activity is likely reflective of the boom in e-commerce due to limited mobility
at the onset of the lockdown.
Growth in Mobile Money Registration
For every 2
Ugandans, at least
1 has an active
mobile wallet.
*These figures are based off operator submissions to the Commission.
The number of active mobile money wallets has crossed the 20 million mark for the first time in
Uganda.
Agent access points have grown from 204,141 nationwide at the end of December 2019 to 213,295
at the end of March 2020.
Change in Agent Networks over the last 3 Quarters
March 2020
UCC - Market Performance Report
USSD.
Noting that the majority of mobile financial services are USSD-facilitated, a commensurate growth in
total USSD sessions was realised during the quarter.
The total number of sessions averaged 1.80 billion per month during the quarter. The quarterly peak
was realised in January 2020 with a total of 1.82 billion USSD sessions.
The growth in USSD sessions is attributed to mobile financial services.
7USSD Traffic in 1Q20
4. NETWORK GROWTH
In March 2020, the number of 2G sites stood at 4,810, 3G and 4G sites stood at 4,187 and 2,593
respectively. These sites are served by a network of 21,327 km of terrestrial backhaul fibre. The
growth in fibre infrastructure was largely due to expansions by UETCL and Airtel between the months
of February and March.
The status of radio network coverage at the end of March 2020 was as follows:
The total number of 3G
and 4G sites stands at
6,780
Fibre cell site distrbution Passive cell site distrbution
March 2020
UCC - Market Performance Report
Other Developments in the Telecom Infrastructure & Access Market
MTN Uganda completed the divesture of its interest in American Tower Company (ATC) Uganda
– this was in fulfilment of the conditional no objection of the ATC-Eaton merger issued by the
Commission in December 2019.
At the end of 1Q20, SEACOM submitted a notification and request for regulatory approval of internal
transfer of shares within SEACOM Group.
8Section B. Services & Usage
5. DOMESTIC VOICE TRAFFIC
The growth in mobile subscriptions between 4Q19 and 1Q20 translated into a 10% increase in total
domestic traffic.
On net minutes continue to dominate domestic traffic accounting for 98.6% of total local traffic.
The dominance of on net traffic is attributed to the pricing differential caused by discounted
promotional bundles.
The market has averaged 4.58 billion on net minutes per month during the quarter, with an on-net
monthly traffic peak in January of 4.7 billion minutes.
Total quarterly on-net traffic stood at 13.6 billion minutes up from 12.4 billion in the quarter October-
December 2019.
On-Net Traffic Growth.
During 1Q20, the market averaged 163.8 on-net minutes per subscriber per month, or approximately
5 minutes per day. This is approximately the same as the preceding quarter. March 2020
The market has averaged 63.53 million off net minutes per month during the quarter, with an off-net
traffic peak in January of 66.5 million minutes.
This is a 4% growth from an average quarterly traffic of 61.1 million minutes in 4Q19.
The above translates into an average of 2.27 off-net minutes per month per subscriber during 1Q20.
UCC - Market Performance Report
The dominance of on net traffic may be indicative of strong incumbency and scale advantages of
the two leading service providers. This may present special market entry bottlenecks in the voice
segment for new entrants who may not have the means to match the on net value propositions
provided by the incumbents.
To this end the Commission plans a further review of wholesale termination rates to mitigate the
potential exclusionary effects of the current traffic distribution.
96. BROADBAND TRAFFIC
During 1Q20, total quarterly broadband traffic has grown to 49 billion MBs from 42.3 billion MBs in
the quarter October-December 2019.
The market has averaged 16.34 billion MBs downloaded per month during the quarter, with a traffic
peak of 18.3 billion in March 2020. This translates into an average of 582.2 MBs per subscriber per
month.
49 billion MBS were
used between January
and March 2020
Monthly Internet Traffic vs. Average MBs per Subscriber
Total Internet
Month
Traffic (MBs)
Jan-20 15,261,978,890
Feb-20 15,415,954,179
Mar-20 18,327,645,552
Average MBs
Month
Per Subscriber
Jan-20 555
Feb-20 546
Mar-20 644
Internet Traffic vs Total Subscriptions.
March 2020
UCC - Market Performance Report
The new growth in mobile broadband traffic at the end of the quarter may be largely attributed to the
early demand for Work-From-Home internet packages that followed the initial lockdown.
E-commerce, online conferencing and multimedia streaming applications dominated downloads
of applications during the period due to social distancing and limited mobility during the lockdown
period.
107. INTERNATIONAL TRAFFIC
This traffic excludes Roaming traffic
International Outgoing (Minutes)
80,156,135
90, 000, 000 76,165,544
74,559,983
70,265,988
80, 000, 000 67,824,948
19%
70, 000, 000 19%
19% 8% -5%
21%
60, 000, 000 10%
Minutes
-3% 21%
50, 000, 000
40, 000, 000
30, 000, 000 81% 81% 81%
20, 000, 000 79% 79%
10, 000, 000
0
Q1 Q2 Q3 Q4 Q1 - 20
Total international outgoing traffic shrunk from 80.2 million minutes in 4Q19 to 76.2 million minutes in
1Q20. This represents a 5% drop in total quarterly international outgoing traffic.
This drop may be attributed to shrinkage in global trade and travel.
International outgoing traffic remains largely destined to the Northern Corridor partner states of
Kenya, Rwanda and South Sudan, with which Uganda has special international traffic termination
arrangements framework.
In 1Q20, ONA traffic accounted for 81% of total international outgoing traffic. The rest of the world
only accounted for 19% of total international outgoing minutes.
International Incoming (Minutes)
117,847,112
110,882,443
March 2020
120, 000, 000
103,725,165 103,616,174
110, 000, 000 97,160,318
17%
100, 000, 000 17% 6%
7%
90, 000, 000 21%
22% -6% 7%
80, 000, 000 24%
70, 000, 000
60, 000, 000
UCC - Market Performance Report
Minutes
50, 000, 000
83% 83%
40, 000, 000 79%
30, 000, 000 78% 76%
20, 000, 000
10, 000, 000
0
Q1 Q2 Q3 Q4
11Total international incoming traffic grew from 110.9 million minutes in 4Q19 to 117.8 million minutes in
1Q20. This represents 6% growth in total quarterly international incoming traffic.
International incoming traffic largely originates from the Northern Corridor partner states of
Kenya, Rwanda and South Sudan, with which Uganda has special international traffic termination
arrangements (through the ONA) framework.
Consistent with the traffic distribution in 4Q19, 83% of total international incoming traffic was from
ONA partner states. The rest of the world only accounted for 17% of total international incoming
minutes landed in Uganda.
8. MONTHLY AVERAGE USER TRAFFIC PROFILE 4Q19
INTERNATIONAL
OUTGOING
INTERNATIONAL
OFFNET INCOMING
1.0
MINUTES
2.3 1.4
MINUTES MINUTES
ONNET MOBILE (MBs)
164 538
MINUTES MBs
MONTHLY AVERAGE USER TRAFFIC PROFILE 1Q20.
INTERNATIONAL
OUTGOING
March 2020
INTERNATIONAL
OFFNET INCOMING
0.9
MINUTES
2.3 1.4
UCC - Market Performance Report
MINUTES MINUTES
ONNET MOBILE (MBs)
163.8 582
MINUTES MBs
129. ROAMING
At the end of March 2020, the number of outbound roamers (Ugandans roaming on foreign networks)
was at 697,402. Of these, 61% are from ONA countries.
At the end of March 2020, the number of inbound roamers (foreigners roaming in Uganda) was at
873,987. Of these, 66% are from ONA countries.
Visiting Customers vs. Ugandans Roaming in other Countries.
Distribution of Roamers (ONA vs. Rest of World)
I
March 2020
10. OTT SERVICES
UCC - Market Performance Report
OTT subscriptions increased markedly with more than 10.63 million cellular users accessing OTT
services at least once in the month of March 2020.
This is up from 10.16 million users in December 2019 and represents a growth of 466,132 additional
monthly users, or a growth rate of 5%.
1310.63
MILLION
466,132 MORE
MONTHLY USERS
10.16 MARCH
MILLION 2020
2 019
DEC
Section C. Financials
11. REVENUES
The telecom sector posted the highest quarterly revenues on record, crossing the Shs1 trillion mark
in total quarterly earnings for the first time. These revenue lines include retail and input/wholesale
revenues like Tower Lease sales, International Bandwidth, Mobile Financial Services as well as Voice
and Data services.
The growth in quarterly revenues represents a quarter-on-quarter growth of 12% between 4Q19 and
1Q20.
Within 1Q20, telecom sector revenues continued to grow at an average monthly rate of 3% in the
quarter January to March 2020. In the month of March, the telecom sector posted 361 billion in gross
revenues from Shs328 billion recorded in the month of December.
While the sector witnessed a Shs 6 billion drop in monthly revenues between the months of January
and February, a Shs 20 billion increase was realised in the month of March 2020. The revenue
recovery in March may in part be due to demand arising from the circumstances surrounding the
March 2020
COVID-19 pandemic.
In this vein, it is worth noting that the share of Mobile Data with respect to total sector revenues grew
by a factor of almost 2%.
Quarterly Revenue Growth.
UCC - Market Performance Report
Quarterly telecom revenues
crossed the 1 trillion mark for the
first time.”
14Revenue Distribution by Service
12. COST OF SERVICE
While total revenues have grown by 10% between December and March, the monthly cost of service
has grown from Shs230 billion in December 2019 to Shs238 billion in March 2020.
The cost of service includes expenses on input/wholesale services, salaries, taxes, depreciation and
other key metrics.
This cost-to-revenue ratio translates into an industry gross margin of 40%.
13. INTERNATIONAL INTERCONNECT POSITIONS
Total industry monthly revenues from international incoming traffic have averaged 11 billion shillings
in 1Q20, an increase of almost Shs 1 billion when compared to last quarter.
March 2020
Outbound international interconnect settlements have also increased, averaging 7 billion per month
in 1Q20 compared to 6 billion in 4Q19.
During 1Q20, Uganda has posted a positive
balance of payments position (BoP) with respect to
international traffic settlement, with a net positive
position of UGX 11.69 billion.
UCC - Market Performance Report
15Section D. Postal & Courier
14. POSTAL SERVICES
The postal and courier sector has a total of 30 licensees as of March 2020. Over 50% of these
operators are Domestic license holders.
Postal and courier operators use a number of pick up/drop off centres for the delivery and processing
of mail. In the quarter under review, the total number of registered centres stood at 571.
The market averaged 133,289 processed mails per month in the quarter, with a quarterly peak in
January of 151,141.
March 2020
UCC - Market Performance Report
16Section E. Broadcast & Multimedia Markets
15. TV MARKET
Free-to-Air
The delivery of FTA channels is mainly via the government-owned SIGNET UG Ltd. By the end of
March 2020, 39 FTAs were carried on the SIGNET platform.
Pay TV
The Pay-Tv market in Uganda is served by a combination of satellite, cable and digital terrestrial
networks, with 7 licensed content aggregators.
March 2020
UCC - Market Performance Report
17Total active subscribers are at 1.58 million as of March 2020, compared to 1.69 million in the
preceding quarter.
This translates to a contraction of 6% in comparison to active Pay-Tv subscriptions at the end of
4Q19. This may in part be attributed to the suspension of major sports leagues such as the English
Premier League and UEFA Champions League due to the novel coronavirus.
Active Pay TV subscriptions.
16. PROGRAMMING & LOCAL CONTENT
Pay-Tv service providers deliver a range of content on their platforms and the number of channels on
a network may vary slightly month to month.
Channel Distribution by Pay-Tv Provider
At the end of March
2020 there were
more than 500
unique streams
March 2020
UCC - Market Performance Report
18Local Content Purchased in 1Q20.
Pay-Tv providers have increased promotion of local content by acquiring local films and setting up
channels to show local content.
Operator Content Name Producer
Akasandali Pearl Bros Pictures
Forced Relations Golden Star Production
Campus Lifa Lexo Media Group Ltd
Dream America Art Angels
Muyambe Kman Media
Reform Zenken Films Uganda Limited
Epidemic New Cinema Productions
Battle of the Souls (Relinse) Bish Films
The Life Savannah Moon Limited
Nsaali Trendz Studios
Ekanamba 7 Mamosa Production
Who is a man Yiga Conrad Peter
My House on fire Luzinda Charles
Reform Zenken Films Uganda Limited
The Forbidden Red Pictures Movie Company
Tamz Production Bala Bala Sese
Zziwa Aaron Alone Wako
Kent and Kate Vortex Creations
Save One Mahj Films
Gold Vision Films Ssaakitegeeza
Torture Limit Productions Company
Star Times Uganda Premier Sanyuka Television
League
March 2020
Average Local
Content
Quota = 22%
UCC - Market Performance Report
19Bouquet Pricing
Bouquet pricing is diverse, with Pay Tv providers offering packages targeted at various market
segments.
While bouquets are traditionally billed on a monthly payment basis, some operators are providing
bouquet offerings on a daily payment schedules, such as the NOVA, Classic and Basic daily bundles
on the StarTimes
Subscriber numbers by and large vary heavily with price, indicating a high price sensitivity for Pay-
Tv content. The cheapest bouquet offerings on average represent 40% of a given service providers
subscriber base, while the most expensive account for 13%.
Subscription Distribution Across Bouquet
Basic Bouquet Prices
Station Bouquet Price Channels
DSTV Access UGX 33,000 75
SITI CABLE Local UGX 15,000
AZAM TV Azam PURE UGX 10,000 50
STARTIMES (Satellite) NOVA UGX 13,000 38
STARTIMES (Terrestrial) NOVA UGX 11,000 31
ZUKU TV Smart UGX 12,000 53
GOTV GOTV Lite UGX 11,000 20
Average share of subscriber base = 40%
Premium Bouquet Prices
Station Bouquet Price Channels
DSTV Premium UGX 219,000 140
SITI CABLE ASiAN UGX 85,000 133
AZAM TV Azam PLAY UGX 37,000 105
STARTIMES ( Satellite) Chinese UGX 80,000 21
STARTIMES ( Terrestrial) Classic UGX 26,000 14
March 2020
ZUKU TV Asia Stand Alone UGX 39,000 29
GOTV GOTV Max UGX 39,000 52
Average share of subscriber base = 13%
Subscriber Distribution by Bouquet Offering
UCC - Market Performance Report
20The tariff plans in the communication sector varies according to the market segments. For the
different market tariff plans, please visit the UCC accredited price comparison website;
www.kompare.ug
March 2020
UCC - Market Performance Report
21UCC - Market Performance Report March 2020 22
You can also read