Positioned for profitable growth - Transition delivers streamlined and strengthened portfolio and operations Ulrich Spiesshofer, CEO; Timo ...
←
→
Page content transcription
If your browser does not render page correctly, please read the page content below
—
ABB LTD, ZURICH, SWITZERLAND, FEBRUARY 8, 2018, FULL-YEAR AND Q4 2017 RESULTS

Positioned for profitable growth
Transition delivers streamlined and strengthened portfolio and operations
Ulrich Spiesshofer, CEO; Timo Ihamuotila, CFO
—
Important notices

This presentation includes forward-looking information and statements including statements concerning the outlook for our
businesses. These statements are based on current expectations, estimates and projections about the factors that may affect our
future performance, including global economic conditions, and the economic conditions of the regions and industries that are
major markets for ABB Ltd. These expectations, estimates and projections are generally identifiable by statements containing
words such as “expects,” “believes,” “estimates,” “targets,” “plans,” “outlook”, “framing 2018” or similar expressions.
There are numerous risks and uncertainties, many of which are beyond our control, that could cause our actual results to differ
materially from the forward-looking information and statements made in this presentation and which could affect our ability to
achieve any or all of our stated targets. The important factors that could cause such differences include, among others:
– business risks associated with the volatile global economic environment and political conditions
– costs associated with compliance activities
– market acceptance of new products and services
– changes in governmental regulations and currency exchange rates, and
– such other factors as may be discussed from time to time in ABB Ltd’s filings with the U.S. Securities and Exchange Commission,
   including its Annual Reports on Form 20-F.
Although ABB Ltd believes that its expectations reflected in any such forward-looking statement are based upon reasonable
assumptions, it can give no assurance that those expectations will be achieved.
This presentation contains non-GAAP measures of performance. Definitions of these measures and reconciliations between these
measures and their US GAAP counterparts can be found in the ‘Supplemental reconciliations and definitions’ section of “Financial
Information” under “Quarterly results and annual reports” on our website at www.abb.com/investorrelations

February 8, 2018     Slide 2

—
Agenda

Full-year and Q4 2017 financial performance

Next Level update

ABB’s way forward

February 8, 2018   Slide 3
—
2017 – ABB streamlined and strengthened
Year of transition

                      Base orders growing in all divisions and regions
Profitable
                      ABB AbilityTM momentum building, 210+ solutions
Growth
                      Streamlined and strengthened portfolio

                      Streamlined and strengthened operations
Relentless            – White Collar Productivity (WCP): $1.3+ bn run-rate savings vs. initial $1 bn target
Execution             – Regular cost savings program on track
                      – Net Working Capital (NWC) % of revenues down 280 bps vs. 2014

                      Simpler, leaner, more customer-focused organization
Business-led
                      Ongoing leadership development
Collaboration
                      Brand strengthened

                                    Positioned for profitable growth

February 8, 2018   Slide 4
—
Full-year and Q4 2017

               Orders                   Revenues                  Operational                Operational            Cash flow from
                                                                 EBITA margin                   EPS               operating activities
 FY 2017

           $33.4 bn                    $34.3 bn                     12.1 %                      $1.25               $3,799 mn
                   +0%1                    +1%1                     -0.3 pts                      -1%2                  steady

                      Orders                       Base orders                      Revenues                  Operational EBITA
                                                                                                                  margin
 Q4 2017

                     $8.5 bn                        $7.9 bn                        $9.3 bn                        10.9 %
                          -3%1                         +9%1                            -1%1                       -0.8 pts

                                 1On   a comparable basis;
February 8, 2018      Slide 5    2Operational  EPS growth is in constant currency (2014 foreign exchange rates)
—
Q4 2017: strong base order momentum
2017 Q4 total order growth by region 2017 Q4 base order growth2
Change on a comparable basis Change on a comparable basis
EUROPE Aust ralia +26%
Base orders +8% Canada +28%
Total orders +5% China +1%
Germany +15% Finland -7%
UK -5% Germany +7%
Sweden -19% India +10%
It aly +18%
AMERICAS AMEA1 Norway +32%
Saudi Arabia -68%
Base orders +12% Base orders +6%
Sout h Korea +8%
Total orders +3% Total orders -14%
Sweden -1%
US +2% China -3%
UK -17%
Canada +35% India -69%
Brazil -45% Saudi Arabia -65% US +11%
1AMEA: Asia, Middle East and Africa
February 8, 2018 Slide 6 2Selected countries from among ABB’s Top 20 countries by total order volume—
EPC business model change completed in Q4 2017
Actions across three divisions Group financial impact
Power Grids
JV agreement for electrical substation projects
Q4 2017 FY 2017
with SNC-Lavalin signed
Reported
Industrial Automation op. EBITA 10.9% 12.1%
Oil & gas JV with Arkad completed margin
Robotics and Motion Impact of EPC -150 bps -30 bps
Wind down of turnkey full train retrofit business charges
Effective January 1, 2018 – remaining EPC
activities to be reported as non-core unit within
Corporate and Other reporting to CFO
De-risking the ABB portfolio
February 8, 2018 Slide 7—
Q4 2017: performance by division
Key figures
$ bn unless Electrification Robotics and Industrial Power
otherwise stated ABB Group Products Motion Automation Grids
Orders 8.5 2.6 2.0 1.8 2.5
Comparable -3% +10% +6% -1% -16%
Base orders1 7.9 2.4 1.8 1.6 2.0
Comparable +9% +8% +5% +5% +15%
Revenues 9.3 2.7 2.2 2.0 2.8
Comparable -1% -1% +6% +0% -7%
Op. EBITA % 10.9% 14.7% 10.8% 14.8% 7.8%
-0.8 pts +1.4 pts -3.1 pts -0.4 pts -2.9 pts
Impact of EPC
-150 bps n/a -300 bps n/a -240 bps
charges
February 8, 2018 Slide 8 1Third-party base orders—
Q4 2017: operational EBITA
Operational EBITA bridge Q4 2016 to Q4 2017, $ mn
11.7% op. 10.9% op.
EBITA margin EBITA margin
+186 -29 -23 -66 +11 -34 +21 +38 -140
1,161
1,057 1,021
Op. EBITA Net Net Net Invest in Mix Other Acq. / Forex Excl. EPC EPC Op. EBITA
Q4 2016 savings commodity volume growth Div. charges charges Q4 2017
February 8, 2018 Slide 9—
Continued progress in Net Working Capital
Net Working Capital reduction Achievements vs. 2014
NWC as a % of revenues
Net Working Capital lower by
$1.9 bn excl. portfolio changes
NWC % of revenue reduced 280 bps
Freed up $1.5 bn in cash
NWC % improved across all divisions
2014
and regions
Further opportunities in value chain
optimization
Excl. portfolio
2017
changes
Q4 Q1 Q2 Q3 Q4
February 8, 2018 Slide 10—
Reminder: framing 2018
Operational items Other items
Order backlog and base order growth $200 – 250 mn “normal” capacity restructuring
EPC business model change effective Jan 1, 2018 $1,000 mn CAPEX
Corporate op. EBITA incl. EPC business ~$500 mn ~$220 mn finance net1
‘Power Up’ investment continues through 2018 ~$250 mn PPA-related amortization1
(approx. $100 mn)
~$800 mn depreciation1
Full-year of B&R financials
Forecast long term effective tax rate
GE-IS expected to close in H1 (costs related to unchanged 27%
integration approx. $100 mn)
February 8, 2018 Slide 11 1Does not include GE-IS—
Next Level strategy
2017 transition delivers streamlined and strengthened portfolio and operations
Driving growth in four market-leading entrepreneurial divisions
Profitable Quantum leap in digital
Growth Value creating, strategic acquisitions and partnerships
Shifting the Center of Gravity: competitiveness, growth, risk
World-class operational excellence across the whole organization
Relentless
Execution
– White Collar Productivity, Net Working Capital, Quality
Linked strategy, performance management and compensation
Market focused and lean organization
Business-led
Collaboration
Continued leadership development
Strengthening the global ABB brand
February 8, 2018 Slide 12—
Streamlined and strengthened digital-first portfolio
ABB today: two clear value propositions
Bringing electricity from any Automating industries from natural
power plant to any plug resources to finished products
Partner of choice for…
Power Grids Electrification Products Industrial Automation Robotics and Motion
… a stronger, … electrification of … robotics and
… perfection in
smarter and all consumption intelligent motion
automation
greener grid points solutions
#1 motion
#1 #2 #2
#2 robotics
February 8, 2018 Slide 13—
Driving growth in market-leading entrepreneurial divisions
PIE approach: Penetration highlights 2017
Food & Beverage Microgrids Africa
…orders up 20% …orders up 100%+ …orders up ~40%
Industry solution offering, Growth driven by renewables Strong growth across all
major awards from e.g. development, digitalization divisions, sub-regions and
Heineken, TetraPak and emerging markets channels
February 8, 2018 Slide 14—
Driving growth in market-leading entrepreneurial divisions
PIE approach: Innovation highlights 2017
Power Grids Electrification Products
Leadership
Leadership
in electric vehicle
in HVDC
fast charging
Industrial Automation Robotics and Motion
Leadership in
Leadership in
collaborative
process control
robotics
#1 DCS1
1DCS:Distributed Control Systems
February 8, 2018 Slide 15
Source: ARC Advisory Group—
Driving growth in market-leading entrepreneurial divisions
PIE approach: Expansion highlights 2017
Power Grids Electrification Products
#1 position
Global #2 position
strengthened in
to be strengthened
digital grid
Industrial Automation Robotics and Motion
Global #2 position Leading in
strengthened robotics and AI
February 8, 2018 Slide 16—
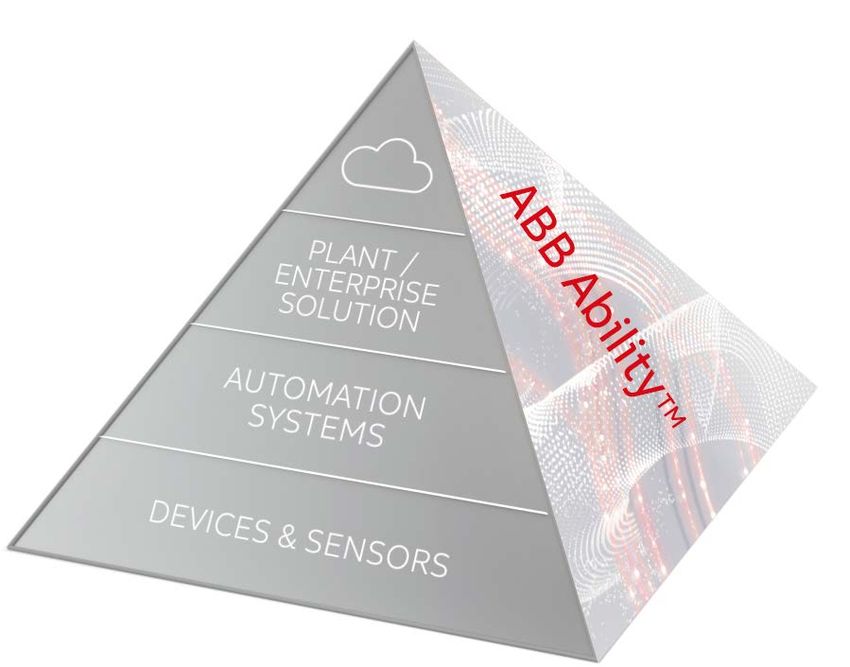
ABB AbilityTM – making a quantum leap in digital
210+ ABB AbilityTM solutions
Transportation
Utilities Industry
& Infrastructure
solutions solutions
solutions
Common technologies for device, edge and cloud
February 8, 2018 Slide 17—
Shifting ABB’s Center of Gravity
Driving competitiveness, growth, risk profile
Strengthening competitiveness
Software / digital: Machine & factory
ABB AbilityTM automation: B&R acquisition
Partnerships: Innovation: extending
Microsoft, IBM, HPE YuMi robot family
Expansion through
Service: leverage large
acquisitions, e.g. Keymile,
installed base & innovation
NUB3D (Robotics)
Expansion: driving growth
EPC business in attractive markets
model change (e.g. F&B, Africa)
HV cable business Penetration: investment
divestiture in SalesForce.com
GE-IS: more early-cycle
electrification business
Lowering risk Driving profitable growth
February 8, 2018 Slide 18—
Power Grids transformation well under way
Operational EBITA margin % Relentless execution
Shaping our leading portfolio
14% and business models
Future
range1
12%
New ABB AbilityTM -enabled services
Current
range
10% and software
10.2
8% 9.3
Delivering sustainable growth
7.2 in service
4.8 Driving world-class execution
Achieved target 10 – 14% margin
corridor on a pro-forma basis
2014 2015FY
2015 2016
2016 FY 2017FY
2017 2020
2020
old structure2 pro-forma3
‘Step change’ ‘Power Up’
1Effective2018
February 8, 2018 Slide 19 2Old structure of Power Grids including HV cables business
3Pro-forma to reflect new EPC business model effective in 2018, not comparable 2015 – 2016—
White Collar Productivity program target delivered
2014 – 2017 WCP program savings1 Highlights
$1.3+ bn End 2017 run-rate $1.3+ bn vs. initial $1.0 bn target
Organization streamlined
Lean business
$1.0 bn functions – 5 4 divisions
– 8 3 regions
– ~1000 ~500 HQ employees
– 60+ 2 global & 3 regional business service
centers
GBS2 & support
functions
Re-investments in digital, Salesforce.com, brand
Organization Program cost $300 mn lower than originally
simplification announced3
Initial End 2017
target run-rate
1Gross cost savings
February 8, 2018 Slide 20 2GBS: Global Business Services
3In comparison to lower end of CMD 2015 estimate $1,200 mn – $1,250 mn—
Linked strategy, performance and compensation
Base compensation Short-term incentives Long-term incentives2
As at 60% retention
Systematic change 100% Group scorecard
Jan. 2013 40% EPS
2018 Merit-driven 65% line-of-sight1 50% EPS
effective compensation change 35% “one level up”1 50% TSR
Driving stronger performance orientation in line with Next Level strategy
1Executive management and senior level employees
February 8, 2018 Slide 21 2Long Term Incentive Plan (LTIP) – executive management—
Attractive shareholder returns, disciplined capital allocation
Total shareholder return (TSR) 2017: +24%1 Capital allocation 2014 – 2017, $ bn
Normalized to 100
125 3.7 16.3
2.3
120 3.5
6.8
115
110 Dividend2
Share
Acquisitions Capex Total
buyback
105
Capital allocation priorities
100
Fund organic growth at attractive CROI
95
Steadily rising sustainable dividend
1-31-17
6-30-17
2-28-17
4-30-17
7-31-17
10-31-17
11-30-17
5-31-17
8-31-17
12-31-16
3-31-17
9-30-17
12-31-17
2017
Value-creating acquisitions
European peers US peers ABB CHF Returning additional cash to shareholders
1Calculated using ABB shares listed on SIX exchange; all TSR calculated in local currency on
gross dividend basis. European peers: Siemens, Legrand, Schneider. US peers: GE, Honeywell,
February 8, 2018 Slide 22
Rockwell, Emerson, Eaton. Source: Bloomberg – Total Return Index; 2Dividends distributed
during 2014-17—
ABB’s way forward
Living Next Level
Driving growth in four market-leading entrepreneurial divisions
Profitable Quantum leap in digital
Growth Value creating, strategic acquisitions and partnerships
Shifting the Center of Gravity: competitiveness, growth, risk
Relentless World-class operational excellence across the whole organization
Execution Linked strategy, performance management and compensation
Market focused and lean organization
Business-led
Continued leadership development
Collaboration
Strengthening the global ABB brand
February 8, 2018 Slide 23—
ABB: positioned for profitable growth
Summary
Market growth across sectors ABB base order growth, yoy, comparable
9%
Share of ABB total market 6%
>3% p.a. 3%
negative
0-1%
2017 1-3% p.a. p.a. 2%
0% 0%
>3% p.a.
2018 – 20 >3% p.a. 1-3% p.a. 0-1% -1%
p.a.
-6%
Q1 2016 Q4 Q1 2017 Q4
ABB better positioned in a better market
Portfolio and operations streamlined and strengthened
Focus on relentless execution
February 8, 2018 Slide 24—
Key figures Q4 2017
Q4 17 Q4 16 Change
$ mn unless ot herw ise ind icat ed $ Local currency Comp arab le
Ord ers 8,478 8,277 +2% -1% -3%
Ord er b acklog (end Decemb er) 22,414 22,981 -2% -8% -4%
Revenues 9,280 8,993 +3% 0% -1%
Op erat ional EBITA 1,021 1,057 -3% -7%
as % of op erat ional revenues 10.9% 11.7% -0.8 p t s
Income f rom op erat ions 612 678 -10%
as % of revenues 6.6% 7.5% -0.9 p t s
Net income at t rib ut ab le t o ABB 393 425 -8%
Basic earning s p er share ($) 0.18 0.20 -7%
Op erat ional earning s p er share ($) 0.33 0.33 -2% +2%
Cash f low f rom op erat ing act ivit ies 1,869 1,428 +31%
February 8, 2018 Slide 26—
Key figures FY 2017
FY 17 FY 16 Change
$ mn unless ot herw ise ind icat ed $ Local currency Comp arab le
Ord ers 33,387 33,379 0% 0% 0%
Ord er b acklog (end Decemb er) 22,414 22,981 -2% -8% -4%
Revenues 34,312 33,828 +1% +1% +1%
Op erat ional EBITA 4,130 4,191 -1% -2%
as % of op erat ional revenues 12.1% 12.4% -0.3 p t s
Income f rom op erat ions 3,434 2,987 +15%
as % of revenues 10.0% 8.8% +1.2 p t s
Net income at t rib ut ab le t o ABB 2,213 1,899 +17%
Basic earning s p er share ($) 1.04 0.88 +17%
Op erat ional earning s p er share ($) 1.25 1.29 -4% -1%
Cash f low f rom op erat ing act ivit ies 3,799 3,843 -1%
February 8, 2018 Slide 27—
Third-party base orders by division
Q4 17 Q4 16 % Change
Third-part y base orders $ mn Comparable
Elect rificat ion Product s 2,394 2,170 +8%
Robot ics and Mot ion 1,838 1,676 +5%
Indust rial Aut omat ion 1,638 1,304 +5%
Power Grids 1,994 1,691 +15%
Corporat e and Ot her 18 19 n.a.
Tot al Group 7,882 6,860 +9%
February 8, 2018 Slide 28—
FY 2017: performance by division
Key figures
$ bn Elect rificat ion Robot icsand
and Indust rial Power
Electrification Robotics Industrial
unless ot herwise ABB Group
ABB Group Power Grids
Products
Product s Motion
Mot ion Automation
Aut omat ion Grids
st at ed
Orders 33.4 10.1 8.5 6.6 9.6
Δ Comparable +0% +5% +8% +2% -11%
Base orders1 30.5 9.6 7.7 5.8 7.4
Δ Comparable +5% +5% +9% +3% +2%
Revenues 34.3 10.1 8.4 6.9 10.4
Δ Comparable +1% +2% +6% -3% -2%
Op. EBITA % 12.1% 15.0% 14.0% 13.9% 9.4%
Δ -0.3 pt s +0.3 pt s -1.5 pt s +0.5 pt s +0.1 pt s
February 8, 2018 Slide 29 1Third-party base orders—
Cash flow from operating activities by division
Q4 17 Q4 16 % Change
Cash f low f rom operat ing
act ivit ies $ mn
Elect rificat ion Product s 590 436 +35%
Robot ics and Mot ion 376 314 +20%
Indust rial Aut omat ion 373 212 +76%
Power Grids 515 542 -5%
Corporat e and Ot her 15 -76 n.a.
Tot al Group 1,869 1,428 +31%
February 8, 2018 Slide 30—
Order backlog by division
Q4 17 Q4 16 % Change
Order backlog
$ Comparable
(end December) $ mn
Elect rificat ion Product s 3,098 2,839 +9% +5%
Robot ics and Mot ion 3,961 3,660 +8% +1%
Indust rial Aut omat ion 5,376 5,409 -1% -10%
Power Grids 11,330 11,638 -3% -7%
Corporat e and Ot her -1,351 -565 n.a. n.a.
Tot al Group 22,414 22,981 -2% -4%
February 8, 2018 Slide 31—
Operational EPS analysis
Q4 17 Q4 16 1
$ mn, except per share dat a in $ EPS EPS
Net income (at t ribut able t o ABB) 393 0.18 425 0.20 -7%
Operat ional adjust ment s:
Acquisit ion–relat ed amort izat ion 75 67
Rest ruct uring and rest ruct uring-relat ed
139 68
expenses 2
Non-operat ional pension cost -8 38
Changes in ret ained obligat ions of divest ed
0 0
businesses
Changes in pre-acquisit ion est imat es 8 92
Gains and losses on sale of businesses 78 0
Acquisit ion-relat ed expenses and cert ain
88 127
non-operat ional it ems
FX / commodit y t iming dif f erences in income
29 -13
f rom operat ions
Tax on operat ional adjust ment s 3 -104 -93
Operat ional net income / Operat ional EPS 698 0.33 711 0.33 +2% 4
1 Calculatedon earnings per share before rounding; 2 Including White Collar Productivity implementation costs; 3 Tax
amount is computed by applying the Adjusted Group effective tax rate to the operational adjustments, except for
February 8, 2018 Slide 32 gains and losses from sale of businesses for which the actual provision for taxes resulting from the gain or loss has
been computed; 4 Operational EPS growth rate is in constant currency (2014 foreign exchange rates)—
Operational EPS analysis – full-year
FY 17 FY 16 1
$ mn, except per share dat a in $ EPS EPS
Net income (at t ribut able t o ABB) 2,213 1.04 1,899 0.88 +17%
Operat ional adjust ment s:
Acquisit ion–relat ed amort izat ion 264 279
Rest ruct uring and rest ruct uring-relat ed
363 543
expenses 2
Non-operat ional pension cost -42 38
Changes in ret ained obligat ions of divest ed
94 0
businesses
Changes in pre-acquisit ion est imat es 8 131
Gains and losses on sale of businesses -252 10
Acquisit ion-relat ed expenses and cert ain
322 163
non-operat ional it ems
FX / commodit y t iming dif f erences in income
-61 40
f rom operat ions
Tax on operat ional adjust ment s 3 -242 -320
Operat ional net income / Operat ional EPS 2,667 1.25 2,783 1.29 -1% 4
1 Calculatedon earnings per share before rounding; 2 Including White Collar Productivity implementation costs; 3 Tax
amount is computed by applying the Adjusted Group effective tax rate to the operational adjustments, except for
February 8, 2018 Slide 33 gains and losses from sale of businesses for which the actual provision for taxes resulting from the gain or loss has
been computed; 4 Operational EPS growth rate is in constant currency (2014 foreign exchange rates)—
Regional share of total orders and revenues by division
Q4 2017
Elect rificat ion Robot ics and Indust rial Power
Electrification
Product s Robotics and
Mot ion AutIndustrial
omat ion Power
Grids
Products Motion Automation Grids
23%
28% 32% 32%
34% 35% 34%
Orders
36%
38% 36% 42% 30%
25% 21%
28%
Revenues
33% 31%
37% 36%
42%
38% 36% 43% 30%
February 8, 2018 Slide 34 Europe Americas Asia, Middle East
and Africa—
Electrification Products
Q4 2017
In $ mn, y-o-y change comparable
+10% Total orders were 10 percent higher, as all regions and end
markets showed strong demand, in particular for data
Orders
center, food and beverage and electric vehicle fast-charging
2,556 2,276 solutions.
Third-party base orders increased 8 percent.
Q4 17 Q4 16
Revenues declined 1 percent, as increases in short-cycle
-1%
Revenues
revenues were not enough to offset lower system revenues.
2,696 2,633
Q4 17 Q4 16
Operational EBITA margin of 14.7 percent was aided by cost
Op. EBITA &
14.7% 13.3%
savings and improved pricing despite ongoing commodity
margin
price headwinds.
398 351
Q4 17 Q4 16
February 8, 2018 Slide 35—
Robotics and Motion
Q4 2017
In $ mn, y-o-y change comparable
+6% Total orders improved 6 percent, growing in all regions. The
division saw improved demand from process end markets,
Orders
whilst large orders declined due to the timing of tender
2,040
awards.
1,856
Third-party base orders grew 5 percent.
Q4 17 Q4 16
+6% Revenues were 6 percent higher on strong execution of the
Revenues
order backlog.
2,187 1,993
Q4 17 Q4 16
Operational EBITA margin of 10.8 percent was primarily
Op. EBITA &
10.8% 13.9%
impacted by the charges related to the EPC business and
margin
continued higher material costs. These EPC charges
278
236 negatively impacted the operational EBITA margin by 300
basis points.
Q4 17 Q4 16
February 8, 2018 Slide 36—
Industrial Automation
Q4 2017
In $ mn, y-o-y change comparable
Third-party base orders continued to be positive at 5 percent
-1% on continued operational investment by process customers;
Orders
total orders were 1 percent lower. Some selective capital
expenditure was seen in mining and specialty vessels.
1,796 1,544
Including B&R the total reported order growth was 12 percent
in local currency.
Q4 17 Q4 16
0% Revenues were steady reflecting the strong book and bill
Revenues
within the quarter.
Revenue growth including B&R was 10 percent in local
2,012 1,749 currency.
Q4 17 Q4 16
Operational EBITA margin of 14.8 percent reflects
Op. EBITA &
14.8% 15.2%
investments in digital and negative business mix.
margin
The joint venture completed with Arkad was established
299 264 before the end of the year. The results of that divested
business have been excluded from the results of the
Q4 17 Q4 16
division.
February 8, 2018 Slide 37—
Power Grids
Q4 2017
In $ mn, y-o-y change comparable
-16%
Orders
Third-party base orders grew 15 percent mainly driven by
industry, particularly in transportation and infrastructure.
2,493 2,868 Total orders declined 16 percent due to the exceptionally
large UHVDC order that was awarded in India in 2016.
Q4 17 Q4 16
-7% Revenues were 7 percent lower due to the lower order
Revenues
backlog, primarily in EPC.
2,809 2,952
Q4 17 Q4 16
Operational EBITA margin of 7.8 percent was impacted by
Op. EBITA &
7.8% 10.7% charges related to the EPC business. Excluding this charge,
margin
the division’s margin would have been 240 basis points
317
higher.
222
The division’s ‘Power Up’ program, driving its
Q4 17 Q4 16 transformation and value creation, is underway.
February 8, 2018 Slide 38—
2016 full-year figures
Pro-forma reflecting EPC business model change
Electrification Robotics and Industrial Power Corporate and
Approx. Total
Products Motion Automation Grids other
Before After Before After Before After Before After Before After
Orders
($ bn)
9.8 9.8 7.9 7.9 6.0 6.0 10.8 10.5 -1.2 -0.8 33.4
Third-party
base orders 9.2 9.2 7.0 7.0 5.2 5.2 7.3 7.1 0.1 0.4 28.9
($ bn)
Revenues
($ bn)
9.9 9.9 7.9 7.9 6.7 6.7 10.7 10.0 -1.2 -0.7 33.8
Op. EBITA
1.5 1.5 1.2 1.2 0.9 0.9 1.0 1.0 -0.4 -0.4 4.2
($ bn)
Op. EBITA
margin 14.7 14.7 15.5 15.6 13.4 13.4 9.3 10.1 n.a. n.a. 12.4
(%)
February 8, 2018 Slide 39—
Q4 2017 figures
Pro-forma reflecting EPC business model change
Electrification Robotics and Industrial Power Corporate and
Approx. Total
Products Motion Automation Grids other
Before After Before After Before After Before After Before After
Orders
($ bn)
2.6 2.6 2.0 2.0 1.8 1.8 2.5 2.4 -0.4 -0.3 8.5
Third-party
base orders 2.4 2.4 1.8 1.8 1.6 1.6 2.0 2.0 0.0 0.1 7.9
($ bn)
Revenues
($ bn)
2.7 2.7 2.2 2.2 2.0 2.0 2.8 2.7 -0.4 -0.3 9.3
Op. EBITA
0.4 0.4 0.2 0.3 0.3 0.3 0.2 0.3 -0.1 -0.3 1.0
($ bn)
Op. EBITA
margin 14.7 14.7 10.8 13.8 14.8 14.8 7.8 10.4 n.a. n.a. 10.9
(%)
February 8, 2018 Slide 40—
2017 full-year figures
Pro-forma reflecting EPC business model change
Electrification Robotics and Industrial Power Corporate and
Approx. Total
Products Motion Automation Grids other
Before After Before After Before After Before After Before After
Orders
($ bn)
10.1 10.1 8.5 8.5 6.6 6.6 9.6 9.2 -1.4 -1.0 33.4
Third-party
base orders 9.6 9.6 7.7 7.7 5.8 5.8 7.4 7.3 0.1 0.1 30.5
($ bn)
Revenues
($ bn)
10.1 10.1 8.4 8.4 6.9 6.9 10.4 10.0 -1.5 -1.1 34.3
Op. EBITA
1.5 1.5 1.2 1.3 1.0 1.0 1.0 1.0 -0.5 -0.7 4.1
($ bn)
Op. EBITA
margin 15.0 15.0 14.0 15.0 13.9 13.9 9.4 10.2 n.a. n.a. 12.1
(%)
February 8, 2018 Slide 41—
More information available at ABB Investor Relations
Name Telephone Email
Jessica Mitchell
+41 43 317 3832 jessica.mitchell@ch.abb.com
Head of Investor Relations
Beat Fueglistaller +41 43 317 4144 beat.fueglistaller@ch.abb.com
Benita Barretto +41 43 317 3876 benita.barretto@ch.abb.com
Ruth Jaeger +41 43 317 3808 ruth.jaeger@ch.abb.com
February 8, 2018 Slide 42You can also read