Harbor 2021 Market Outlook - December 2020
←
→
Page content transcription
If your browser does not render page correctly, please read the page content below
Harbor 2021 Market Outlook
                                                                         December 2020

For Institutional Use Only. Not for Distribution to the Public.
Harbor Overview

      A 35-year-old investment manager focused on offering talented, institutional-caliber asset managers and solutions
            • Fiduciary culture
            • Advocates of active management
            • Focused on delivering investment solutions

      Key Attributes
            • Experienced manager research team combining deep quantitative skills, a well-balanced approach with proven qualitative judgment
            • Strong relationships with subadvisory partners allows for a high degree of transparency, understanding of their capabilities, and to
              capture diverse points of view on relevant topics.
            • Harbor Lens provides the ability to share objective and impartial perspectives for clients.

       Harbor at a Glance

                             18                            29                             17                            $55B
                     Subadvisory Partners               Commingled                  Asset Classes and                  Assets Under
                   (avg. partnership >8 yrs.)            Products                  Emerging Multi Asset                Management
                                                                                       Capabilities
As of 09/30/2020
                                                                                                                                                     2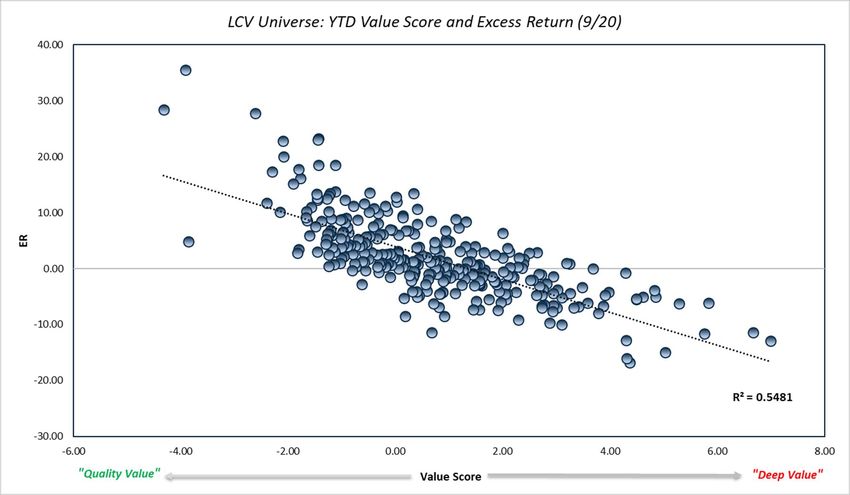
Speakers

 Ross Frankenfield, CFA               Andrew Prewitt               Sonya Morris, CFA                Jeffery Markarian
      Managing Director               Managing Director               Managing Director               Managing Director
  Harbor Capital Advisors, Inc.   Harbor Capital Advisors, Inc.   Harbor Capital Advisors, Inc.   Harbor Capital Advisors, Inc.

                                                                                                                                  3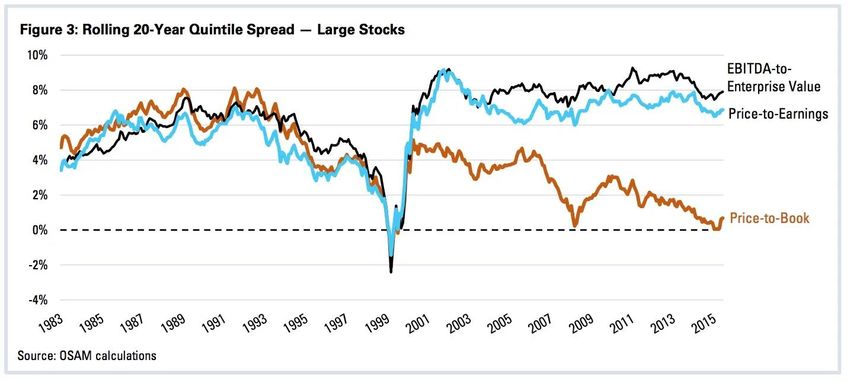
Objectives & Agenda

                                                2020 Recap / Overview
                          Growth
                                                Topical Areas of discussion for 2021
                                                   • Value Outlook
                                                   • International Equities Outlook
                                                   • Growth Outlook

                                                Importance of Diversification across these three areas in 2021
                      Diversification

      International                     Value

                                                                                                                 4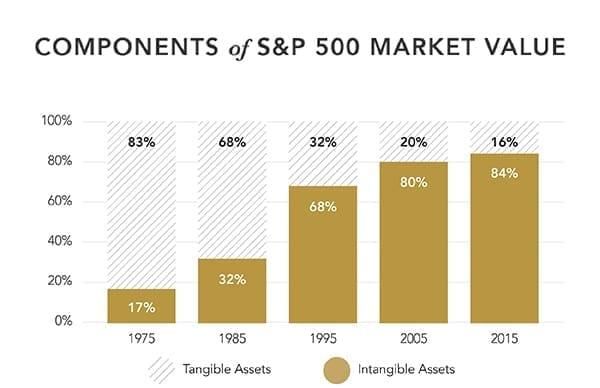
2020 Will be Remembered as a Year of Extreme Volatility

                          Volatility within Equity Markets

                          Volatility within Fixed Income Markets

                          Volatility on Main Street within the Real Economy

                                                                              5
2020: A Year of Heightened Volatility

                                                                                              VIX Daily Levels Ranked
                                                                                                  (11/16/1990 - 11/16/2020)

                          90

                          80

                          70

                          60
              VIX Level

                          50
                                                                                                                              Average VIX Since 2/20/2020,
                                                                                                                                33.14, ranking in the 94th
                          40                                                                                                            percentile

                          30

                          20

                          10

                           0
                                0%

                                3%
                                1%

                                4%
                                5%
                                6%
                                8%
                                9%

                               14%

                               17%

                               19%

                               22%

                               31%

                               34%

                               36%

                               39%

                               50%

                               53%

                               55%

                               67%

                               70%

                               72%

                               84%

                               86%

                               89%
                               10%
                               12%
                               13%

                               15%

                               18%

                               21%

                               23%
                               25%
                               26%
                               27%
                               28%
                               30%

                               32%

                               35%

                               37%

                               40%
                               41%
                               43%
                               44%
                               45%
                               46%
                               48%
                               49%

                               52%

                               54%

                               57%
                               58%
                               59%
                               61%
                               62%
                               63%
                               65%
                               66%

                               68%

                               71%

                               74%
                               75%
                               76%
                               77%
                               79%
                               80%
                               81%
                               83%

                               85%

                               88%

                               90%
                               92%
                               93%
                               94%
                               96%
                               97%
                               98%
                               99%
                                                                                                              VIX Rank

Source: FactSet, November 2020. All charts and tables are shown for illustrative purposes only.                                                              6
Active Management Matters Again

                                                                                                                                                                           Active Matters Again:
                                                                                                                                                                           Big opportunity to pick winning
                                                                                                Morningstar Categories                                                     managers this year and to make
                                                                                                                                                                           large impact on investment results
                                                                      20.00%
                                                                                                                                                                           (in these asset classes)
                                                                                                                                                           Small Cap Growth, 2020
                                                                      18.00%
             Dispersion of returns between 25th and 75th percentile

                                                                      16.00%

                                                                      14.00%                         Large Cap Growth, 2020
                                                                                                                                                                  Foreign Large Cap, 2020
                                                                      12.00%

                                                                      10.00%

                                                                      8.00%

                                                                      6.00%                                                                                                 Prior 20-Year Opportunity Set:
                                                                                                                                                                            more limited for active manager
                                                                      4.00%                                                                                                 decisions pick to make large
                                                                                                                                                                            impact on investment results
                                                                      2.00%                                                                                                 (in these asset classes)

                                                                      0.00%
                                                                               0%   10%   20%                    30%              40%          50%   60%             70%
                                                                                                      % of managers outperforming Benchmark

                                                                                                Avg. rolling over 20 years   YTD (9/30/2020)

Source: Morningstar, November 2020. All charts and tables are shown for illustrative purposes only.                                                                                                             7
Value Outlook

Poll Question
What are the biggest risks to Value investing going into 2021?
A. Continued Monetary Stimulus – persistent low rates and an accommodative Fed not good
for Value investing
B. Behavioral Biases – greed, overconfidence, and over-extrapolation continue to bid up U.S.
Information Technology Growth and Momentum Mega Cap stocks
C. Regulation – increased regulation of Value-specific industries under a Biden administration
D. Pandemic-related – increased lockdowns; vaccine efficacy, adoption, and distribution
E. Intangibles – technological revolution and digital age make traditional measures of Value
obsolete
F. Earnings Growth – value stocks will not deliver on expected earnings growth
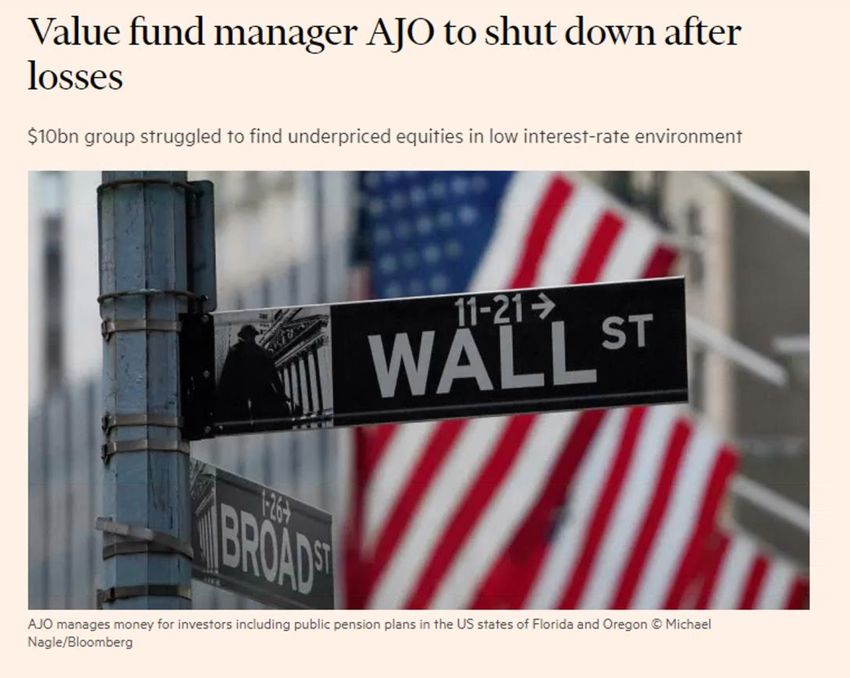
9The Death of Value Investing? Source: Morningstar, September 2020. All charts and tables are shown for illustrative purposes only. Source: Pensions&Investments May 1, 2020. Source: Financial Times October 14, 2020. 10
Why Value Investing is Not Dead

                              • Be wary of “this time, things are different”

                              • Not all Value styles or managers are created equal

                              • Diversification benefits, especially today

                                                                                     11
Not all Value Styles are Created Equal
There is a wide spectrum of value investing – from deep value through quality value
Deep Value Quality Value
Different styles of value investing can result in materially different portfolio characteristics
Source: Style Analytics, September 2020. All charts and tables are shown for illustrative purposes only. 12Quality Value has Materially Outperformed Deep Value
These unique portfolio characteristic have resulted in very different outcomes.
Source: eVestment, September 2020. All charts and tables are shown for illustrative purposes only. 13Not All Value Managers are Created Equal
• Price-to-book has been the real
Value laggard
• Book value may not fully capture
the economic value of
intangible assets
• Sophisticated active
managers can take advantage
of these opportunities
Source: Ocean Tomo, Intangible Asset Market Value Study, 2017. All charts and tables are shown for illustrative purposes only. 14Value is One of Your Few Diversifying Equity Investments Today
• Momentum and Value are
often negatively correlated…
• ..this relationship is at an
extreme today… Factors Total Return vs S&P 500
2/2009 - 1/2010
60.00%
50.00%
S&P 500 +49.00%
• …and holding some Value can 40.00%
be an important hedge if the 30.00%
Momentum trade continues to 20.00%
unwind. 10.00%
0.00%
-10.00%
Momentum -18.87%
-20.00%
-30.00%
Feb-09 Mar-09 Apr-09 May-09 Jun-09 Jul-09 Aug-09 Sep-09 Oct-09 Nov-09 Dec-09 Jan-10
Source: FactSet, September 2020. Morningstar, September 2020. All charts and tables are shown for illustrative purposes only. 15Catalysts to Potentially Unlock the Value Opportunity
• Expectations for growth companies too high
• Fundamentals of value coming through and
converging with growth
• Macro considerations
16Macro Events that Could Benefit Value Investing
MTD S&P 500 Factor Indexes Return
• Vaccine – successful efficacy,
distribution, and adoption 16.0%
14.0%
12.9 Value
12.0%
Pfizer News – 11/9
• Ripple effects of unprecedented
stimulus 10.0%
9.8 Quality
9.7 Growth
8.0%
7.1 Momentum
6.2 Low Vol
• Future government policies 6.0%
benefitting Value sectors 4.0%
2.0%
0.0%
Source: Morningstar, November 2020. All charts and tables are shown for illustrative purposes only. 17Risks to Value Investing in 2021
We believe that even if inflation and interest rates stay low, there is precedent for
Value still outperforming.
• Continued monetary stimulus and
perpetually low interest rates Total Return MSCI Japan Indexes
1/1990 - 9/2020
• Behavioral biases 120.0%
• Over and under-reaction 100.0%
75.2%
• Overconfidence and greed
80.0%
• Increased regulation under a Biden 60.0%
administration
• Financials
40.0%
18.8%
• Energy 20.0%
• Pandemic 0.0%
• Increased lockdowns -20.0% -24.1%
• Vaccine efficacy, distribution, and
-40.0%
adoption risks
-60.0%
-80.0%
-100.0%
MSCI Japan Growth MSCI Japan Value MSCI Japan
Source: Morningstar, November 2020. All charts and tables are shown for illustrative purposes only. 18International Equities Outlook
Poll Question

       What are the biggest concerns about International Equity Investing going
       into 2021?
       A. Currency volatility

       B. China’s growing influence on international markets

       C. Disruption of “old economy” companies, which are more prevalent overseas

       D. Reduced diversification benefits because of high correlations and/or because U.S.-based
          multinationals provide very similar diversification properties.

                                                                                                    20
International Equities Offer Attractive Diversification Benefits
Investors gain exposure to a wider variety of economic forces when they include international stocks in their
portfolios. Non-U.S. markets have very different sector and market-cap compositions and are exposed to different
factors.
We think there is a reasonable chance that correlations could decline in the future, which would further enhance the
diversification benefits of foreign equities.
Currencies have not contributed to significant additional volatility and they provide an extra measure of
diversification, something that is often not gained by investing in U.S. based multinationals.
Non-U.S. stocks are particularly attractive diversifiers for income-oriented portfolios.
Active strategies arguably provide more diversification benefits than passive strategies.
212020 Returns – Significant Dispersion Between Countries
Developed Markets ex-US Emerging Markets
MSCI EAFE NR USD 3.03 MSCI EM NR USD 10.20
Japan 9.95 China 26.01
-15.10 UK Taiwan 27.61
France 1.20 Korea 24.10
Switzerland 6.44 India 4.87
Germany 5.19 -28.71 Brazil
-35.00 -25.00 -15.00 -5.00 5.00 15.00 25.00 35.00 -35.00 -25.00 -15.00 -5.00 5.00 15.00 25.00 35.00
Source: Morningstar, November 2020. All charts and tables are shown for illustrative purposes only. 22Value/Growth Dispersion Was Universal And Extreme
Growth-Value Indexes Dispersion of Returns
Calendar Years: 2000-2020 US EAFE EM
40.0%
Largest dispersion of returns over the last 20 years 30.0%
20.0%
10.0%
0.0%
-10.0%
-20.0%
-30.0%
-40.0%
2000 2001 2002 2003 2004 2005 2006 2007 2008 2009 2010 2011 2012 2013 2014 2015 2016 2017 2018 2019 YTD
Source: Morningstar, October 2020. All charts and tables are shown for illustrative purposes only. 23Dispersion Between Sectors Was Also High
MSCI EAFE Dispersion Top/Bottom Sector
Annually 2000-2020
70.0%
Highest sector dispersion in the last 10 years
60.0% Avg 20yrs dispersion: 34.06%
51.35%
50.0%
40.0%
30.0%
20.0%
10.0%
0.0%
2000 2001 2002 2003 2004 2005 2006 2007 2008 2009 2010 2011 2012 2013 2014 2015 2016 2017 2018 2019 YTD
Source: Morningstar, October 2020. All charts and tables are shown for illustrative purposes only. 24Benchmark Concentration in Emerging Markets (EM)
The MSCI EM Index has developed big concentrations
% Weight in Top 5
MSCI EM
3/31/2015-10/31/2020
30
25
20
Weight, %
15
10
5
0
Source: FactSet, October 2020. All charts and tables are shown for illustrative purposes only. 25Benchmark Concentration in EM
MSCI EM COUNTRY WEIGHTS MSCI EM COUNTRY WEIGHTS
10/31/2015 10/31/2020
Other
China 20%
24%
Other
31%
Brazil China
4% 43%
India
8%
Korea
16%
South Africa
8%
Korea
12%
India
9% Taiwan Taiwan
12% 13%
Source: FactSet, October 2020. All charts and tables are shown for illustrative purposes only. 26In EM, China Positioning Was Key For Active Managers
Dispersion of Returns 25% and 75% Percentiles
Diversified Emerging Markets
14.0%
11.6% 12.0%
Largest dispersion of returns over the last 20 years
10.0%
8.0%
6.0%
4.0%
2.0%
0.0%
2000 2001 2002 2003 2004 2005 2006 2007 2008 2009 2010 2011 2012 2013 2014 2015 2016 2017 2018 2019 YTD
Source: Morningstar, October 2020. All charts and tables are shown for illustrative purposes only. 27Potential Catalysts – Rotation Toward Cyclical Sectors
Index Sector Weights
10/31/2020
30.00
25.00
20.00
15.00
10.00
5.00
--
Communication Consumer Consumer Staples Energy Financials Health Care Industrials Information Materials Real Estate Utilities
Services Discretionary Technology
S&P 500 MSCI EAFE MSCI EAFE Small Cap MSCI EM
Source: Factset, October 2020. All charts and tables are shown for illustrative purposes only. 28Potential Catalysts – Weakening U.S. Dollar
The U.S. dollar is coming off the multi-year high reached in the 1Q20 selloff. Further weakening
would provide a tailwind for foreign equities
Trade Weighted U.S. Dollar Index: Broad Goods and Services
Source: Federal Reserve as of October 30, 2020. All charts and tables are shown for illustrative purposes only. 29Potential Catalysts – The Need For Income
International stocks have had higher payouts than U.S. stocks, meaning they can be a useful source
of diversification for income-oriented portfolios
Dividend Yield and % Stocks Paying Dividend
12/31/2000-10/31/2020
5.0 100%
4.5 90%
4.0 80%
3.5 70%
% Stocks Paying Dividend
3.0 60%
Dividend Yield
2.5 50%
2.0 40%
1.5 30%
1.0 20%
0.5 10%
-- 0%
2000 2001 2002 2003 2004 2005 2006 2007 2008 2009 2010 2011 2012 2013 2014 2015 2016 2017 2018 2019 2020
MSCI EAFE Yield S&P 500 Yield MSCI EAFE S&P 500
Source: FactSet, November 2020. All charts and data are shown for illustrative purposes only. 30Trailing P/CF Discount
10%
20%
30%
0%
-60%
-50%
-40%
-30%
-20%
-10%
12/31/2004
3/31/2005
6/30/2005
9/30/2005
12/30/2005
3/31/2006
6/30/2006
9/29/2006
12/29/2006
3/30/2007
Valuation Opportunities
6/29/2007
9/28/2007
12/31/2007
3/31/2008
6/30/2008
9/30/2008
12/31/2008
3/31/2009
6/30/2009
9/30/2009
12/31/2009
3/31/2010
6/30/2010
9/30/2010
Source: Morningstar, October 2020. All charts and tables are shown for illustrative purposes only.
MSCI EAFE Trailing P/CF Discount vs. S&P 500
12/31/2010
3/31/2011
6/30/2011
9/30/2011
12/30/2011
3/30/2012
6/29/2012
9/28/2012
12/31/2012
3/29/2013
6/28/2013
9/30/2013
12/31/2013
3/31/2014
6/30/2014
9/30/2014
12/31/2014
3/31/2015
6/30/2015
9/30/2015
12/31/2015
3/31/2016
6/30/2016
9/30/2016
12/30/2016
3/31/2017
6/30/2017
9/29/2017
12/29/2017
3/30/2018
6/29/2018
9/28/2018
12/31/2018
3/29/2019
6/28/2019
9/30/2019
12/31/2019
3/31/2020
6/30/2020
9/30/2020
Avera ge
- 1 s ta ndard deviation
+ 1 s ta ndard deviation
31International Stocks Have Been In And Out Of Favor
80s 90s 00s 10s
S&P 500 17.55 18.21 -0.95 13.56
Rolling 5 Year Excess Return MSCI EAFE 21.99 7.01 1.17 5.50
EAFE vs. S&P 500 MSCI EM NA 9.77 9.78 3.68
1/1/1970-9/30/2020
MSCI EAFE Small Cap NA NA 6.45 8.74
25
20
15
10
5
Return, %
0
-5
-10
-15
-20
-25
MSCI EAFE-ND S&P 500
Source: FactSet, October 2020. All charts and tables are shown for illustrative purposes only. 32Growth Outlook
Poll Question

       What are the biggest risks to Growth stocks maintaining their leadership
       position going into 2021?
       A. Valuations become too stretched and investor sentiment turns

       B. Growth stocks fail to deliver on heightened earnings growth expectations

       C. Regulation under a democratic administration (Information Tech, Anti Trust)

       D. Increased competition in many growth areas like Software and Related Services leads to an erosion
          of profits

                                                                                                              34
Growth Stocks Now vs. Tech Bubble
S&P 500 Technology Sector
Tech Bubble & Today
Valuation Ratios & Margins
8/31/2000 11/30/2020
60.0 57.2
55.0
Earnings and FCF Multiples Book and Sales Multiples are
11.0
are ~40% lower today than in 10.5 ~6% lower today than in the
50.0 the tech bubble 9.9 tech bubble
10.0
44.5
Weighted Harmonic Average
45.0
9.0
Weighted Harmonic Average
40.0
34.4 8.0
35.0 7.6
7.0
30.0 7.0
24.2
25.0
6.0
20.0
30.0 5.0
15.0 28.03
10.0 4.0
25.0 Price / Book Price/ Sales
Price/ Earnings Price/ Cash Flow 22.98 23.21
Weighted Average
20.0
Growth companies are
significantly more profitable
15.0
today with operating margins
10.56 near 30% and net margins that
10.0 have more than doubled
5.0
Operating Margin Net Margin
Source: FactSet, November 2020. All charts and tables are shown for illustrative purposes only. 35Index Concentration
Russell 1000 Growth Index
Top 5 Concentration
10/31/2020
Apple Inc.
12.17%
Microsoft Corporation
Remaining 428 Top 5 9.73%
61.26% 38.74%
Amazon.com, Inc.
8.43%
Alphabet Inc. Class A/C
4.35%
Facebook, Inc. Class A
4.06%
Source: FactSet, December 2020. All charts and tables are shown for illustrative purposes only. 36Index vs. Active Performance After Concentration
Average 5 Year Forward Return and Rank - Concentration Quartiles
Morningstar Active Large Cap Growth
(#) Monthly Observations
12/31/1990-8/31/2020
Return Rank
20% 0%
18% 10%
16% 20%
21%
25%
14% 30%
12% 40%
Average Return
Average Rank
48%
10% 50%
8% 16.46% 60% 60%
6% 70%
10.74%
9.55%
4% 80%
2% 90%
1.87%
0% 100%
Quartile 1 Quartile 2 Quartile 3 Quartile 4
0 - 15.54% 15.54 - 17.35% 17.35 - 20.22% 20.22 - 29.10%
(75) (74) (74) (74)
Russell 1000 Growth % in Top 5
Source: Morningstar, August 2020. All charts and tables are shown for illustrative purposes only. 37Passive and Innovation: Tesla
Passive Innovation Participant
6/30/2020 - 11/30/2020
14000.00% 2.50%
Weight in Russell 1000 Cumulative Return
Nov 2020,
11809.36%
12000.00%
2.00%
10000.00%
1.50%
Cumulative Return
8000.00%
Index Weight
1.23%
6000.00%
1.00%
Feb 2020
4000.00% 2703.15%
0.32%
Jun 2017,
1417.46%
0.50%
Feb 2014,
2000.00% 927.32% 0.20%
0.11%
0.00% 0.00%
Jul 2010 Jan 2011 Jul 2011 Jan 2012 Jul 2012 Jan 2013 Jul 2013 Jan 2014 Jul 2014 Jan 2015 Jul 2015 Jan 2016 Jul 2016 Jan 2017 Jul 2017 Jan 2018 Jul 2018 Jan 2019 Jul 2019 Jan 2020 Jul 2020
Source: Morningstar, FactSet, December 2020. All charts and tables are shown for illustrative purposes only. 38Change Creates Opportunity
We believe selectively investing in leading growth businesses is now more important than ever.
COVID-19 will likely have a lasting impact on economies, business spaces, behaviors, and geopolitics. It’s
accelerating existing trends, ending others, and we expect, will widen the gap between winners and losers.
Leadership, innovation, and competitive advantage will likely distinguish the winning businesses even
more in the years ahead.
39Summary
2020 has been a year of extreme volatility, but increased dispersion has created opportunities for active
management going into 2021.
Not all value approaches have struggled, and value remains an important diversifier to growth. Outcomes
from vaccine development, ripple effects from stimulus, and future government policy may be favorable for
value investing going forward.
International equities can offer attractive diversification and income benefits. Attractive valuations relative to
U.S. stocks combined with the highly volatile and uncertain environment create a fertile environment for active
management.
While growth valuations appear high, they are largely supported by fundamentals, and growth has provided
excess returns during recent market drawdowns. As the pandemic accelerates existing trends, it is
increasingly important to focus on innovative and disruptive growth businesses.
40Questions
Please submit your questions
using the Q&A box
(866) 313-5549
info@harborfunds.com
www.harborfunds.com
41Legal Notices & Disclosures
The views expressed herein are those of Harbor Capital Advisors, Inc. investment professionals at the time the comments were made. They may not be reflective of their current opinions, are
subject to change without prior notice, and should not be considered investment advice. The information provided in this presentation is for informational purposes only.
The information provided in this presentation should not be considered as a recommendation to purchase or sell a particular security. The weightings, holdings, industries, sectors, and countries mentioned
may change at any time and may not represent current or future investments.
© [2020] Morningstar, Inc. All rights reserved. The information contained herein: (1) is proprietary to Morningstar and/or its content providers; (2) may not be copied or distributed; and (3) is not warranted to be
accurate, complete, or timely. Neither Morningstar nor its content providers are responsible for any damages or losses arising from any use of this information. Past performance is no guarantee of future
results.
Past performance is no guarantee of future results.
The information shown relates to the past. Past performance is not a guide to the future. The value of an investment can go down as well as up. Investing involves risks including loss of principal.
The Russell 1000® Index is an unmanaged index generally representative of the U.S. market for larger capitalization stocks. This unmanaged index does not reflect fees and expenses and is not available for
direct investment. The Russell 1000® Index and Russell® are trademarks of Frank Russell Company.
The Russell 1000® Growth Index is an unmanaged index generally representative of the U.S. market for larger capitalization growth stocks. This unmanaged index does not reflect fees and expenses and are
not available for direct investment. The Russell 1000® Growth Index and Russell® are trademarks of Frank Russell Company.
The Russell 1000® Value Index is an unmanaged index generally representative of the U.S. market for larger capitalization value stocks. This unmanaged index does not reflect fees and expenses and is not
available for direct investment. The Russell 1000® Value Index and Russell® are trademarks of Frank Russell Company.
The MSCI EAFE (ND) Index is an unmanaged index generally representative of major overseas stock markets. This unmanaged index does not reflect fees and expenses and is not available for direct
investment.
The MSCI Emerging Markets (ND) Index is a market capitalization weighted index of equity securities in more than 20 emerging market economies. This unmanaged index does not reflect fees and expenses
and is not available for direct investment.
The MSCI Japan Index is an unmanaged index generally representative of the large and mid cap segments of the Japanese market. The Index covers approximately 85% of the free float-adjusted market
capitalization in Japan. This unmanaged index does not reflect fees and expenses and is not available for direct investment.
The MSCI Japan Growth Index is an unmanaged index generally representative of the large and mid cap securities exhibiting overall growth style characteristics in Japan. This unmanaged index does not
reflect fees and expenses and is not available for direct investment.
The MSCI Japan Value Index is an unmanaged index generally representative of the large and mid cap Japanese securities exhibiting overall value style characteristics. This unmanaged index does not reflect
fees and expenses and is not available for direct investment.
The S&P 500 Index is an unmanaged index generally representative of the U.S. market for large capitalization equities. This unmanaged index does not reflect fees and expenses and is not available for direct
investment.
The MSCI EAFE Small Cap (ND) Index is an equity index which captures small cap representation across developed market countries around the world, excluding the U.S. and Canada. This unmanaged
index does not reflect fees and expenses and is not available for direct investment.
42
1435111-20201208You can also read