The Outperformance of Growth vs. Value - And why Value-oriented stocks will likely outperform dramatically! - Highgate Securities ...
←
→
Page content transcription
If your browser does not render page correctly, please read the page content below
The Outperformance of
    Growth vs. Value
  What is behind it, what does it mean and how long will it last?
And why Value-oriented stocks will likely outperform dramatically!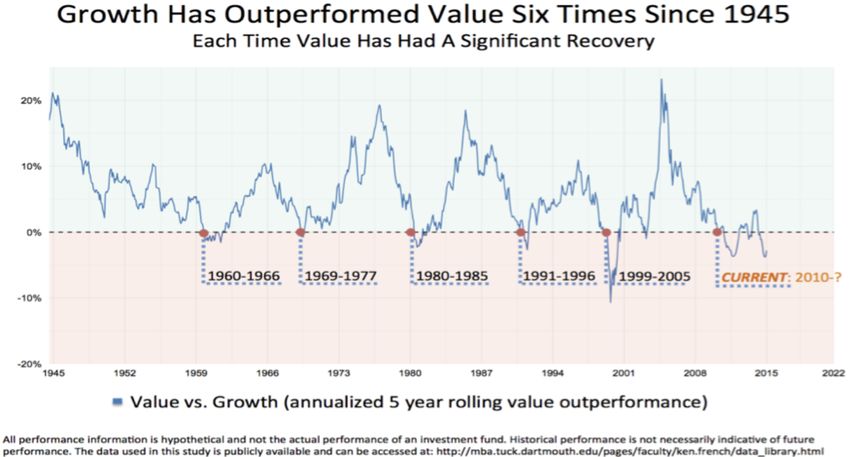
Highgate Background
• Company formed late 2016 to invest in publicly traded securities for
  high net worth individuals and apply a consistent, rigorous process
  with the goal of providing safety of principle without sacrificing equity
  returns.
• John Goltermann, CFA (29 years experience) – former global equities
  manager for Obermeyer Asset Management during its growth phase
  2001 – 2014 prior to its merger with Wood Investment Counsel
• Drew Hayworth, CFA (26 years experience) – founder of Madison
  Street Partners, fundamental long/short equity hedge fund, portfolio
  manager Gallacher Capital Management
‘Growth’ and ‘Value’
• From Grant’s Interest Rate Observer:

• Value Stocks - “desirable because underpriced”
   • Low price-to-earning, low price-to-book ratios, low price-to-sales
   • Out of favor, overlooked, challenged, slow growth, boring
• Growth Stocks - “desirable because fast-growing, big, cash-
  generative, popular, world-beating and transformative.”
   • High multiples
   • Newer businesses, new technology, high revenue growth, market
     share over profit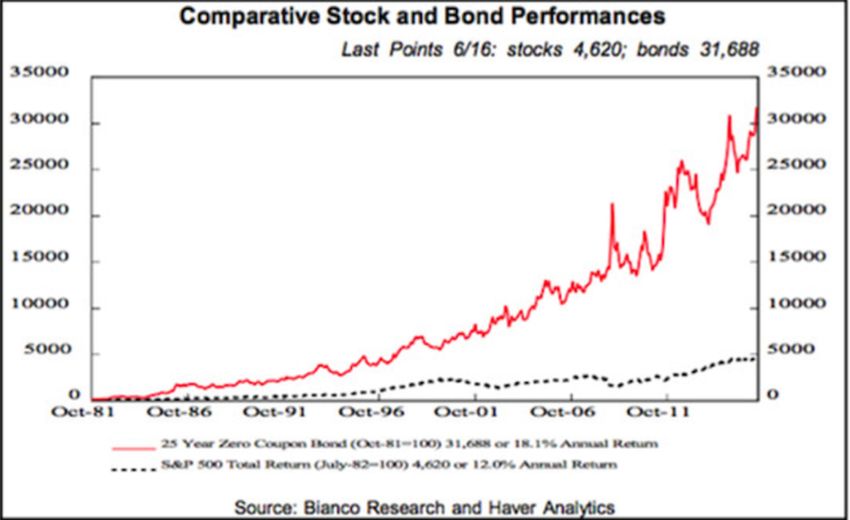
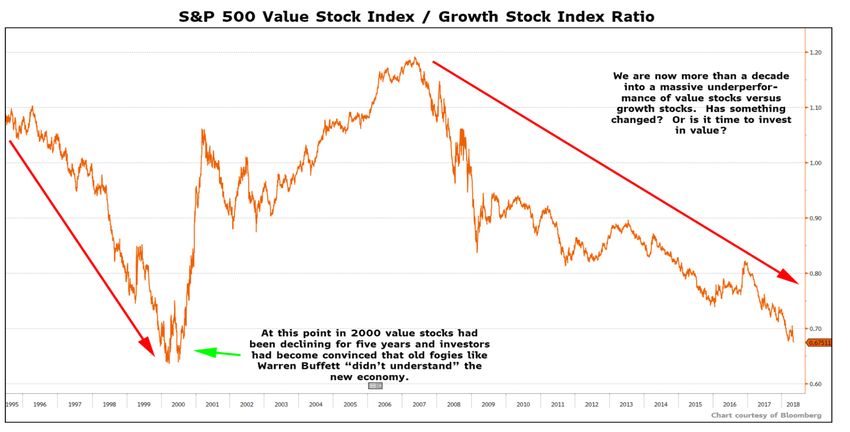
The Outperformance of Growth vs.
          Value Stocks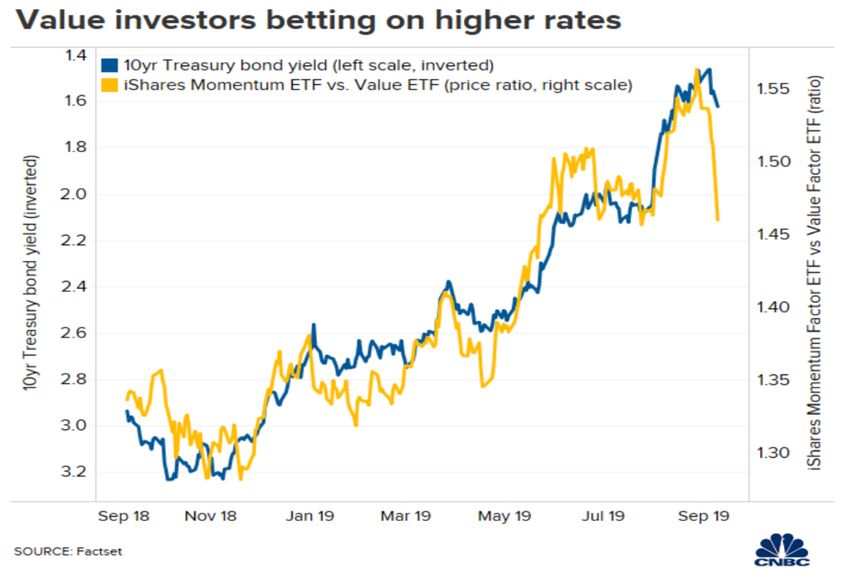
13 Years of Growth Stock
  Outperformance
More exaggerated
 outside of US
Do Profits Matter?
Factors Behind ‘Growth’
                 Huge Outperformance

• Low Interest Rates
• Slow Overall Economic Growth
• Higher Relative Growth in US vs. ROW
• Psychology
• Market Factors
• Economic Factors
• Performance Derby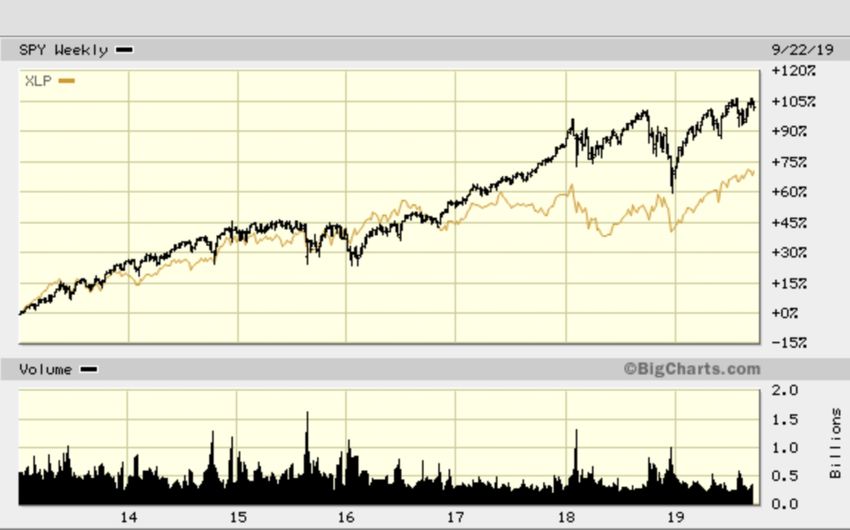
Low Interest Rates

• Appetite for Duration – Long bonds have crushed short bonds for 38
  years. Growth stocks, by definition, have the economics of their
  businesses far out in the future, value stocks are nearer term.
• This has caused long duration assets such as high growth companies
  where earnings power is far in the future to dominate the investment
  landscape. Investors have been willing to pay more for future growth
  because the opportunity cost of today’s growth is lower.
Low Interest Rates
Low Interest Rates
Slow Economic Growth

• Fed-sponsored liquidity has encouraged more speculative
  investments where there is a perception of growth.
• In the wake of the bursting of the dot.com bubble, value was a
  refuge. By 2007, people were buying hedge funds that were long
  value/short growth. The financial crisis was a crash in ‘Value’
• Scarcity. In 1996 there were about 8,025 companies listed in US
  exchanges. At the end of 2018, there were about 4,397. Fewer capital
  seekers, more capital suppliers = multiple expansion.
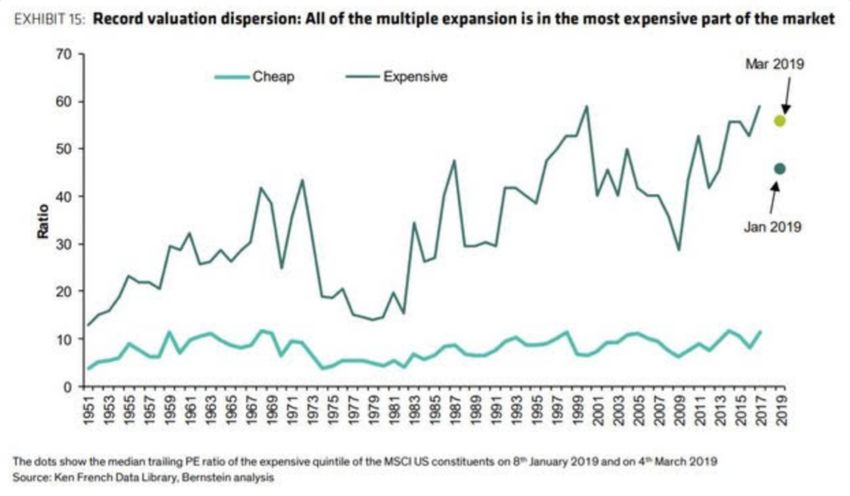
Multiple Expansion has
led Top Stocks Higher
High Relative US Growth

• Trade friction, tariffs, and politics around China has investors
  projecting slower growth in the markets outside US
• Strong dollar environment brings capital to investments that have
  costs denominated abroad and revenues generated in the U.S.
  Technology is the leader in this set-up – a situation akin to 1995-2000.
• Negative interest rates abroad drag down US rates from foreign
  investors buying US bonds and causes a strong dollar
High Relative US Growth
Psychology
• Investors no longer demand a path to profitability in a short time frame.
  Instead investment thesis are around “platform effects” and “total
  addressable markets” to justify continued financing.
• The unicorns (Uber, Lyft, WeWork) had an almost cult-like following before
  the bust. Cocktail party effect.
• Confirmation bias - Investors attitudes changed from determining an
  appropriate price to pay to buy growth companies to simply buying
  because they are going higher. Higher prices validates high price paid.
• Most institutional investor’s allocate capital based on “performance” and
  avoid what has not performed. Career risk: No one will lose their job being
  wrong with the crowd, but they will if they are wrong alone.
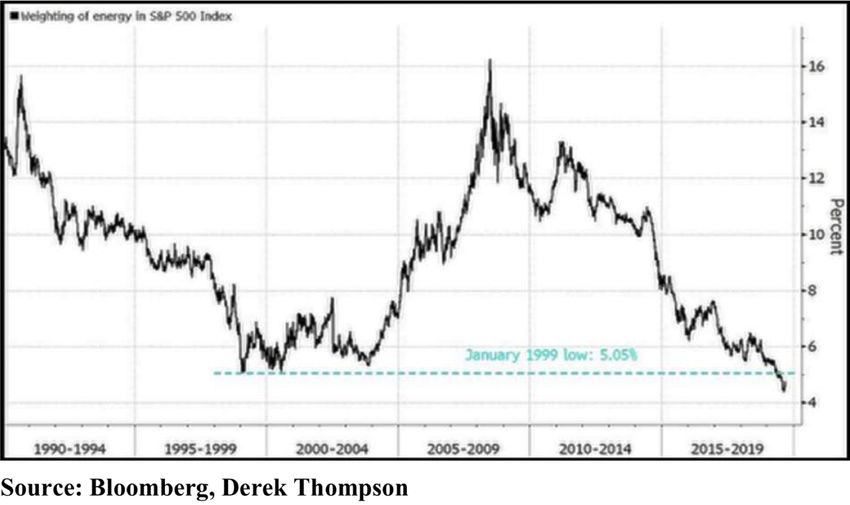
Market Factors

• Sector drags: Energy, Consumer Staples and Financials make up more
  than half of value indices
• Proliferation of passive (unthinking) investments
• Growth became concentrated with industry leaders who were able to
  use technology and unlimited access to credit to dominate their
  industries
• Liquidity preference for US equities post-2008
• Stock Buybacks
Market Factors
• Sector drags: Consumer Staples facing cost pressure
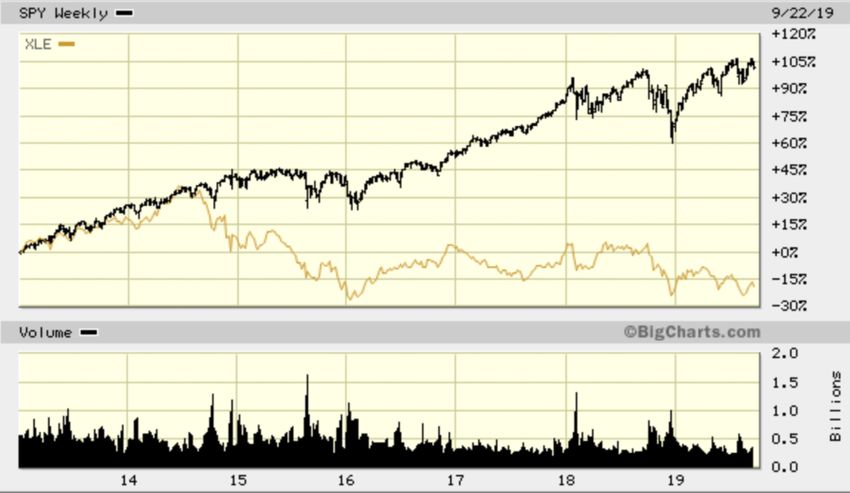
Market Factors
• Sector drags: Energy - Technological efficiency, increased leverage and
  slower global growth pressuring the economics of the energy
  business
Market Factors
• Sector drags: Energy – Percent weight of energy sector of the S&P
  500 is now at all-time lows. ESG investors disinvesting energy due to
  political/optical motivation
Market Factors
• Sector drags: Banking and financial services – a flat yield curve
  pressures their business
Market Factors
• Proliferation of ETFs – more passive products by number and by
  assets as of Aug. 31, 2019 (WSJ)
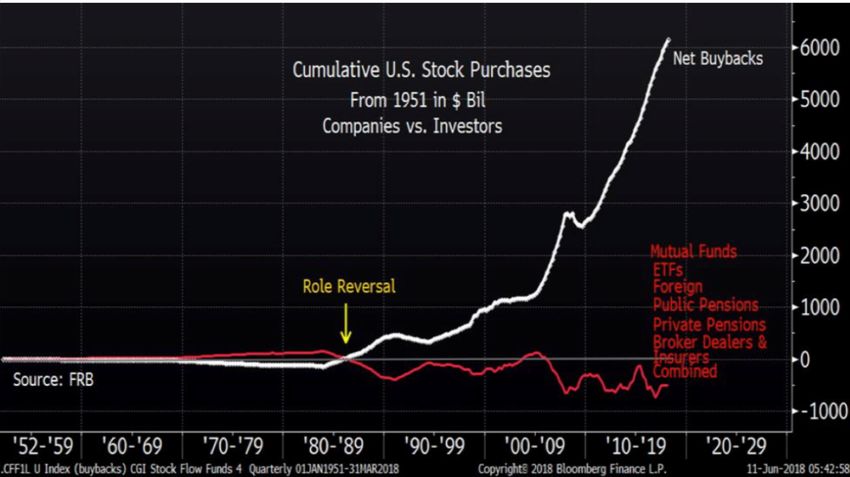
Market Factors
• Stock buybacks have been the driver of market liquidity
Economic Factors

• Development/installation vs. Deployment
  • Early stages of new transformative technologies bring optimism. Deployment
    of actual technologies see regulatory burdens, as well as costs and risk rise.
• Underfunded pensions
  • Low rates inflating pension liabilities, forcing pensions to invest for duration
    and up the risk curve
Performance Derby • Technology companies have become attractive due to their perceived scalability in a non-capital intensive, high margin business. Technology ”makes the world a better place.” Many ESG (Environmental, Social, Governance) investors gravitate to technology companies for this “feel good” effect. • There is intense competition in the investment business for “performance”, so capital goes where there is a perception of the greatest reward the soonest. • 6 of 10 mutual funds now have private equity in their portfolios vs. 3 of 10 in 2014.
Implication for Investors

• Benchmarks are concentrated portfolios (that investors compete
  against). In 2013, 5.2% of S&P was FAANG stocks, today 16.8%;
• Growth stocks are richly valued by historical standards (P/E north of
  55 for top quintile);
• According to JP Morgan, 80% of equity trade is ‘algorithmically
  generated’, 10% is market making, and 10% is fundamental/long-term
  investors (people are competing against machines);
• Mean reversion happens. Timing it is impossible.
Implication for Investors

• Both Dodd-Frank and the Volker Rule have dramatically reduced
  market-making and proprietary trading desks. Potential to create a
  negative momentum effect. The traditional buffers to price volatility
  have disappeared.
• For those that measure their returns in years instead of quarters, and
  want to avoid downside risk...the underperformance of value versus
  growth stocks is one of the rare opportunities today.
• “That which cannot go on forever, will stop”- Herb Stein
What will turn it around?

• Time (mean reversion happens in markets)
• Supply chain disruptions and ability to source cheap labor and material
  abroad
• Political pressure on big tech from privacy concerns and monopolies
• Higher longer-term interest rates
• Less Fed intervention in markets from QE, Operation Twist, etc.
• Investor impatience with lack of profit growth
• Loss of popularity of indexation (from value distortions, concentration, etc.)
• Broad desire to reduce risk - risk for long-term investors is really just two
  things...bankruptcy and overvaluation
What will turn it around?

• “Normalcy is only a recession or an election or an equity bear market or a supply
  shock or a bond liquidation away” – Jim Grant
• IPO Market Rollover (perhaps this has started)
• Fewer stock buybacks (the EPS optical benefit of buybacks declines with higher
  returns on cash)
• Law of large numbers: Priced in that next 10 years of profit growth will look like
  the last. Highly unlikely.
• Bear market in ‘growth’
• A decreased ability for the US government to add to debt
• The valuation difference all by itself
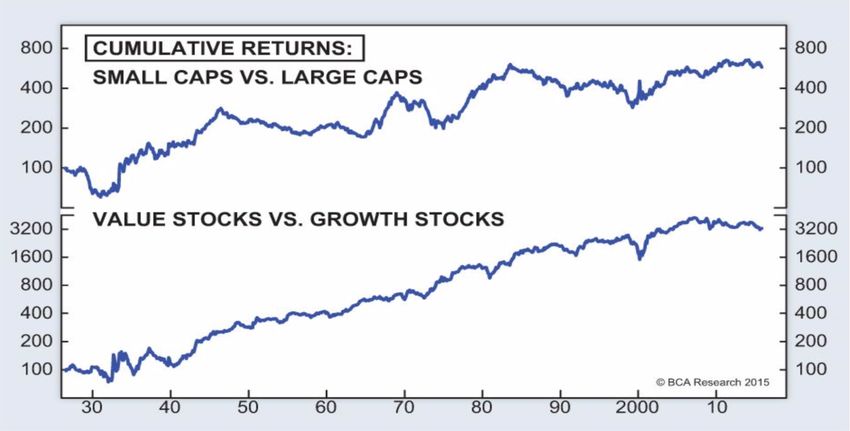
Does it matter?
• Value beat growth by 3.8% per annum since 1926
• Value beat growth by 1.3% per month in months the
  market was down, underperformed by 0.4% per month in
  months market is up
Mohawk Industries (MHK)
• Enterprise Value:                    $11.9B
• Market Cap:                          $8.984B
• 10 year high:                        $275.90 (10/1/2017)
• 52 week low:                         $111.34 (8/12/2019)
• Last Price:                          $125.25 (10/15/2019)
• Current Forward P/E:                 11.3X (2020 est) vs. 16.67X last 5-year average
• Current Forward EV/EBITDA:           7.3X (2020 est.) vs. 10.64X last 5-year average
• 2020 EPS estimate:                   $10.98/share
• 2020 EBITDA estimate:                $1.628B
• Mohawk is the world’s leader in flooring including carpet, rugs, tile, laminate, wood, stone and
  luxury vinyl for both residential and commercial properties
• CEO Jeffrey Lorerbaum and family owns 15% of stock and has served as CEO since 2001
• Stock has been weak due to combination of higher costs (freight, lumber, commodities) and
  stronger dollar which negatively impacts their global business (59.6% of total revenues)
Mohawk cont…
• 5-year Average Return on Invested Capital (ROIC) = 10.32%. Current ROIC 7.74%
• 5-year Average Net Operating Profit After Tax (NOPAT) = 9.94%
• Stock price to Economic Book Value < 1.0 in which market is implying a permanent decline in profitability
  which seems unlikely.
• Using a modest revenue growth rate of 2.6% and maintaining their current depressed ROIC the stock is
  worth around $178 per share today or about 42% higher.
• Any abatement to costs trends and stronger dollar will boost profitability, have the potential to get closer to
  their 5-year average ROIC and increase ultimate shareholder value
• Company continues to benefit from strong residential trends both single family and multi-family plus a
  robust commercial building cycle.
• Company repurchased $274M of stock in 2018 taking advantage of depressed stock price.
• Low expectations built into valuation even though the long-term company and industry dynamics continue
  to be favorable
• Strong free cash flow generation
Mohawk cont…
Disclosure
• Copyright 2020© Highgate Securities Investments. All rights reserved. John Goltermann is the president of
  Highgate Securities Investments. For more information about Highgate, please visit www.highgatesi.com or
  call 303-968-1230. Past performance may not be indicative of future results. Different types of investments
  involve varying degrees of risk, and there can be no assurance that the future performance of any specific
  investment, investment strategy, or product (including the investments and/or investment strategies
  recommended or undertaken by Highgate Securities Investments, LLC), or any non-investment related
  content will be profitable, equal any corresponding indicated historical performance level(s), be suitable for
  your portfolio or individual situation, or prove successful. Due to various factors, including changing market
  conditions and/or applicable laws, the content may no longer be reflective of current opinions or positions.
  Moreover, you should not assume that any discussion or information contained in this newsletter serves as
  the receipt of, or as a substitute for, personalized investment advice from Highgate Securities Investments,
  LLC. To the extent that a reader has any questions regarding the applicability of any specific issue discussed
  above to his/her individual situation, he/she is encouraged to consult with the professional advisor of
  his/her choosing. Highgate Securities Investments, LLC is neither a law firm nor a certified public accounting
  firm and no portion of the newsletter content should be construed as legal or accounting advice. A copy of
  the Highgate Securities Investments, LLC’s current written disclosure statement discussing our advisory
  services and fees is available upon request. If you are a Highgate Securities Investments, LLC client, please
  remember to contact Highgate Securities Investments, LLC, in writing, if there are any changes in your
  personal/financial situation or investment objectives for the purpose of reviewing/evaluating/revising our
  previous recommendations and/or services.
You can also read