Investor Presentation - July 2020 - Rogers Corporation
←
→
Page content transcription
If your browser does not render page correctly, please read the page content below

Investor Presentation
July 2020

Forward-looking statements
Safe Harbor Statement
This presentation contains forward-looking statements, which concern our plans, objectives, outlook, goals, strategies, future events, future net sales or
performance, capital expenditures, future restructuring, plans or intentions relating to expansions, business trends and other information that is not historical
information. All forward-looking statements are based upon information available to us on the date of this release and are subject to risks, uncertainties and other
factors, many of which are outside of our control, which could cause actual results to differ materially from the results discussed in the forward-looking
statements. Risks and uncertainties that could cause such results to differ include: the duration and impacts of the novel coronavirus global pandemic and efforts
to contain its transmission, including the effect of these factors on our business, our customers and economic conditions generally; failure to capitalize on,
volatility within, or other adverse changes with respect to the Company's growth drivers, including advanced mobility and advanced connectivity, such as delays in
adoption or implementation of new technologies; uncertain business, economic and political conditions in the United States and abroad, particularly in China,
South Korea, Germany, Hungary and Belgium, where we maintain significant manufacturing, sales or administrative operations; the trade policy dynamics
between the U.S. and China reflected in trade agreement negotiations and the imposition of tariffs and other trade restrictions, including trade restrictions on
Huawei Technologies Co., Ltd.; fluctuations in foreign currency exchange rates; our ability to develop innovative products and the extent to which our products are
incorporated into end-user products and systems and the extent to which end-user products and systems incorporating our products achieve commercial success;
the ability of our sole or limited source suppliers to deliver certain key raw materials, including commodities, to us in a timely and cost-effective manner; intense
global competition affecting both our existing products and products currently under development; business interruptions due to catastrophes or other similar
events, such as natural disasters, war, terrorism or public health crises; failure to realize, or delays in the realization of anticipated benefits of acquisitions and
divestitures due to, among other things, the existence of unknown liabilities or difficulty integrating acquired businesses; our ability to attract and retain
management and skilled technical personnel; our ability to protect our proprietary technology from infringement by third parties and/or allegations that our
technology infringes third party rights; changes in effective tax rates or tax laws and regulations in the jurisdictions in which we operate; failure to comply with
financial and restrictive covenants in our credit agreement or restrictions on our operational and financial flexibility due to such covenants; the outcome of
ongoing and future litigation, including our asbestos-related product liability litigation; changes in environmental laws and regulations applicable to our business;
and disruptions in, or breaches of, our information technology systems. For additional information about the risks, uncertainties and other factors that may affect
our business, please see our most recent annual report on Form 10-K and any subsequent reports filed with the Securities and Exchange Commission, including
quarterly reports on Form 10-Q. Rogers Corporation assumes no responsibility to update any forward-looking statements contained herein except as required by
law.

                                                                                                                                                                          2
Non-GAAP Information
This presentation includes the following financial measures that are not presented in accordance with generally accepted accounting principles in the United
States of America (“GAAP”):
   (1) Adjusted earnings per diluted share, which the Company defines as earnings per diluted share excluding amortization of acquisition intangible assets and
        discrete items, such as acquisition and related integration costs, asbestos-related charges, environmental accrual adjustment, gains or losses on the sale or
        disposal of property, plant and equipment, pension settlement charges, restructuring, severance, impairment and other related costs, and the related
        income tax effect on these items (collectively, “discrete items”) and transition services, net;
   (2) Adjusted operating income, which the Company defines as operating income excluding amortization of acquisition intangible assets and discrete items
        above excluding pension settlement charges and transition services, net;
   (3) Adjusted operating margin, which the Company defines as operating margin excluding amortization of acquisition intangible assets and discrete items
        above excluding pension settlement charges and transition services, net;
   (4) Adjusted EBITDA, which the Company defines as net income excluding interest expense, net, income tax expense, depreciation and amortization, stock-
        based compensation expense, transition services lease income and discrete items;
   (5) Adjusted EBITDA margin, which the Company defines as net income margin excluding interest expense, income tax expense, depreciation and
        amortization, stock-based compensation, transition services lease income and discrete items;

Management believes that adjusted earnings per diluted share, adjusted operating income, adjusted operating margin, adjusted EBITDA and adjusted EBITDA
margin, are useful to investors because they allow for comparison to the Company’s performance in prior periods without the effect of items that, by their nature,
tend to obscure the Company’s core operating results due to potential variability across periods based on the timing, frequency and magnitude of such items. As a
result, management believes that these measures enhance the ability of investors to analyze trends in the Company’s business and evaluate the Company’s
performance relative to peer companies. However, non-GAAP financial measures have limitations as analytical tools and should not be considered in isolation
from, or solely as alternatives to, financial measures prepared in accordance with GAAP. In addition, these non-GAAP financial measures may differ from similarly
named measures used by other companies. Reconciliations of the differences between these non-GAAP financial measures and their most directly comparable
financial measures calculated in accordance with GAAP are set forth in the appendix.

                                                                                                                                                                        3
Rogers at a Glance
Rogers (NYSE: ROG) is a global leader in materials technology focused on delivering innovative
    high-performance solutions in Advanced Mobility, Advanced Connectivity and more

  Established                                      Employees         2019 Sales   Non-U.S. Sales   2019 Adjusted EPS*

     1832                                             3,600      z

                                                                     $898M          ~70%               $6.14
  *See appendix for reconciliation of adjusted EPS to EPS.
                                                                                                                        4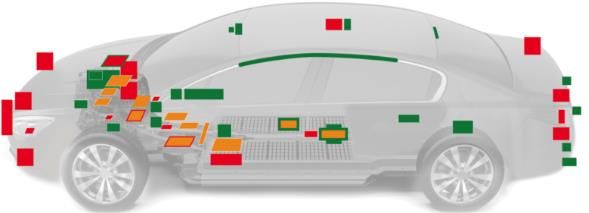
What We Do
                        Products                                              Markets
 Advanced Connectivity
Advanced  Connectivity Systems
                       Solutions(ACS)
                                 (ACS)                  Advanced Connectivity
• High frequency circuit materials                      • Wireless infrastructure (4G & 5G)
                                                        • Portable Electronics

 Power Electronics Solution (PES)                       Advanced Mobility
• Ceramic substrates used in power modules              • ADAS
• Laminated busbars                                     • EV/HEV

 Elastomeric Material Solutions (EMS)                   Other
                                                        • Aerospace & Defense
• Polyurethane and silicone materials for cushioning,
                                                        • General Industrial
     sealing and vibration management
                                                        • Mass Transit
                                                        • Renewable Energy

    .
                                                                                              5
The Rogers Opportunity
Strong Secular Tailwinds Growth Drivers: EV/HEV, ADAS, 5G
Market & Technology
Focused strategy driving market leadership in high growth areas
Leadership
High single digit sales growth*
Proven Track Record
570 bps increase in Adjusted Operating Margin*
Strong Balance Sheet $76M net cash position at Q2’20**
Strategy Targeted to Enable Profitable Growth Through
Market-focused Innovation, M&A and Operational Excellence
*Net sales CAGR from 2012 to 2019. Adjusted operating margin improvement from 2012 to 2019. See appendix for reconciliation of operating margin to adjusted operating margin 6
**Net cash defined as cash and cash equivalents in excess of total debtGrowth Drivers
Advanced Connectivity Advanced Mobility
Today’s Markets
4G & 5G wireless Portable ADAS EV/HEV Power Modules
infrastructure Electronics EV Batteries
New Opportunities
Low Earth Orbit Advanced Antenna Semi & Fully Vehicle-to-Vehicle
(LEO) Broadband Materials & Components Autonomous Vehicles Communications
7Advanced Mobility Update
EV/HEV - PES EV/HEV - EMS ADAS - ACS
Substrates for Power Semi Packaging Cell Pads & Other Solutions High Frequency Circuit Materials
• EV market growth expected to • Strong pipeline of design wins with • Strong market position across all major
accelerate in spite of COVID-19 impacts leading automakers & battery suppliers Tier I suppliers
• Content opportunity across entire • Content opportunity across all battery • Growth opportunity driven by higher
EV/HEV market types penetration & shift to autonomous
driving
Electric & Hybrid Electric Vehicles1 Electric & Hybrid Electric Batteries2 Auto Radar Sensors3
(in millions) (units in millions) (units in millions)
HEV - Mild Pouch
HEV - Full Prismatic 188
11
Cylinder 172
EV 9 155
24 139
10
7 20 119
9
5 16
8 81
4 7 12
5 21 9
2 16 13 16
4 8 11 6 9
4 6 3 5 7
2020 2021 2022 2023 2024 2025 2020 2021 2022 2023 2024 2025 2020 2021 2022 2023 2024 2025
1 – IHSMarkit July 2020 LVP forecast; 2 – IHSMarkit June 2020 E-Mobility Battery Cell Forecast 3 - IHSMarkit June 2020 Auto Sensor forecast
8Advanced Connectivity Update
• Limited visibility and challenges from trade restrictions.
Wireless Infrastructure • Trade and competitive factors moderating 5G opportunity
• 5G smartphones expected to comprise ~15% of 2020 units.
Portable Electronics Volumes forecast to double in 2021, as non-5G sales decline.
• Rogers content opportunity higher in 5G smartphones
• Low Earth Orbit
Emerging Opportunities • Advanced Antenna Materials and Components
• High Speed Digital
9Focused Strategy Driving Market Leadership
Profitable
Growth
Market-Driven Innovation Leadership Synergistic M&A Operational Excellence
• Global growth driver focus • 4 global innovation centers • Focus on ‘Top of Pyramid’ • Optimize utilization
developing leading edge • Market & technology
• Strong, collaborative, technology leadership • Improve productivity &
solution oriented • Strong financial profile yields to improve GM
customer relationships • Highly-engineered
materials & solutions for • 4 acquisitions since 2015
35.0%
markets that demand
performance & reliability 31.8%
• Enabling technology
roadmaps 2012 2019
Company Gross Margin
10Rogers Business Overview
Key Business Metrics 2% Sales by business unit Portfolio Highlights
Full year 2019 Advanced Connectivity Solutions
22%
Elastomeric Material Solutions
• High-performance materials
35%
Power Electronics Solutions
• Mission-critical applications
$898M 2019
Other
• Technology innovation and
Net Sales leadership
2.2% increase vs 2018 40% • Strong, collaborative
21%
customer relationships
• Engineer-to-engineer sales
15.7% Regional sales (“Ship to“)
APAC
2019 49%
• Global sales, manufacturing
Adjusted Operating Margin* AMERICAS and technology footprint
31%
EMEA
10 bps decrease vs 2018
Strong growth profile with margin expansion opportunities
*See reconciliation of adjusted operating margin to operating margin in the appendix. Numbers may not sum due to rounding 11Rogers 2019 Revenues by Market
Advanced Advanced
Mobility ADAS Wireless
Connectivity
24% 7% Infrastructure
e-Mobility 27%
14%
9%
Portable
Mass Transit Electronics
8% 12%
Other
A&D
12%
8%
Clean
Industrial Energy
19% 9%
Market-driven innovation leading to growth in diverse global markets
Market percentages are approximate and based on company estimates 12ACS Business Overview
Key Business Metrics Strategy
Other
Consumer
6% • Leverage innovation to
2019 electronics capitalize on market
10% Wireless opportunities in key areas:
Net Sales $317M infrastructure
33% • Automotive safety
Adjusted sensors
Op Margin** 18.4% ADAS
Markets*
20% • Aerospace & Defense
YTD 2020
• Maximize opportunity in
Net Sales $135M global 5G rollout
Aerospace &
defense
Adjusted
Op Margin** 17.1% 31%
YTD 2020
Leveraging innovative technologies in existing and emerging markets
*Market percentages are approximate and based on company estimates 13
**See reconciliation of adjusted operating margin to operating margin in the appendix.EMS Business Overview
Key Business Metrics Portfolio Highlights
Other • Capitalize on the large
2019 Consumer 7% emerging market
6%
opportunity for EV/HEV
Net Sales $362M Automotive battery pads and battery
8%
General pack sealing solutions
Adjusted Industrial
Op Margin** 20.1% Markets* 44% • Maintain leadership in
Mass Transit
10% portable electronics,
YTD 2020 general industrial and
aerospace markets
Net Sales $155M Portable • Optimize acquisitions to
Electronics expand profitable growth
Adjusted 25%
Op Margin** 15.8%
YTD 2020
Focusing on growth opportunities in Advanced Connectivity and Advanced Mobility
*Market percentages are approximate and based on company estimates 14
**See reconciliation of adjusted operating margin to operating margin in the appendix.PES Business Overview
Key Business Metrics Strategy
Industrial
• Leverage our proven
2019 8%
technology to capitalize on
Mass Transit strong market growth
Net Sales $199M 12%
e-Mobility opportunities in Advanced
38% Mobility applications
Adjusted
Op Margin** 2.2% Markets* • Invest in capacity to
support accelerating
demand for EV/HEV
YTD 2020 applications
Net Sales $92M • Continue to execute
Clean Energy
42%
on business
Adjusted improvement
Op Margin** 2.4% initiatives to increase
YTD 2020 profitability
Focusing on EV/HEV opportunity and continuing operating performance improvements
*Market percentages are approximate and based on company estimates 15
**See reconciliation of adjusted operating margin to operating margin in the appendix.Financial Track Record
Double Digit Revenue Growth Increasing Profitability Improving Cash Generation
Net Sales ($M) Adjusted Operating Margin* Operating Cash Flow ($M)
$898
15.7% $161
$499 10.0%
$40
2012 2019 2012 2019 2012 2019
Strong Financial Performance Driven by Focused Multi-Year Strategy
*See reconciliation in the appendix of adjusted operating margin to operating margin and earnings per share to adjusted earnings per share. 16Financial Overview
Q2 2020 Financial Highlights
     ($ in millions, except EPS)                                                                                         Q2-2020                                Q1-2020                              Q2-2019
     Net sales                                                                                                              $191.2                                $198.8                              $242.9
     Gross margin                                                                                                           $70.0                                  $65.6                              $85.8
         Gross margin %                                                                                                      36.6%                                 33.0%                              35.3%

     Operating income                                                                                                       $21.1                                  $17.5                              $33.2
         Operating margin %                                                                                                  11.0%                                  8.8%                              13.7%

     Adjusted operating income*                                                                                             $29.5                                  $22.6                              $41.7
         Adjusted operating margin %*                                                                                        15.4%                                 11.3%                              17.2%

     Net income                                                                                                             $14.5                                  $13.3                              $24.3
         Net income % of net sales                                                                                            7.6%                                  6.7%                              10.0%

     Adjusted EBITDA*                                                                                                       $42.5                                  $33.4                              $53.1
         Adjusted EBITDA margin %*                                                                                           22.2%                                 16.8%                              21.9%

     EPS                                                                                                                    $0.78                                  $0.71                              $1.30
     Adjusted EPS*                                                                                                          $1.13                                  $0.92                              $1.64

                           Revenue within guidance but lower sequentially;
             Gross Margin and Adjusted EPS exceeded guidance despite topline headwinds
*See reconciliations to adjusted metrics in the appendix: adjusted operating income to operating income, adjusted operating margin to operating margin, adjusted EBITDA to net income and adjusted
earnings per diluted share to earnings per diluted share.                                                                                                                                                      18
2019 Financial Highlights
($ in millions, except EPS) FY-2019 FY-2018
Net sales $898.3 $879.1
Gross margin $314.3 $310.8
Gross margin % 35.0% 35.4%
Operating income $110.5 $112.7
Operating margin % 12.3% 12.8%
Adjusted operating income* $141.4 $138.9
Adjusted operating margin %* 15.7% 15.8%
Net income $47.3 $87.7
Net income % of net sales 5.3% 10.0%
Adjusted EBITDA* $188.2 $184.8
Adjusted EBITDA margin %* 21.0% 21.0%
EPS $2.53 $4.70
Adjusted EPS* $6.14 $5.77
Strong first half tempered by soft market demand in second half of 2019
Profitability impacted by PES operational challenges;
*See reconciliations to adjusted metrics in the appendix: adjusted operating income to operating income, adjusted operating margin to operating margin, adjusted EBITDA to net income and adjusted
earnings per diluted share to earnings per diluted share. Adjusted EBITDA for 2018 has been recast to reflect the add-back of stock-based compensation expense. 19Appendix
Q2-2020: Adjusted operating margin reconciliation
($ in millions)                                                  Q2-19($) Q2-19(%) Q1-20($) Q1-20(%) Q2-20($) Q2-20(%)
GAAP operating margin                                            $32.2   13.7%     $17.5    8.8%     $21.1    11.0%
  Restructuring, severance, impairment and other related costs    $3.7   1.5%      $1.1     0.5%      $0.6     0.3%
  Acquisition and related integration costs                       $0.3   0.1%      $0.4     0.2%      $0.4     0.2%
  Asbestos-related charges                                        $0.1   0.0%        -        -        -         -
  Environmental accrual adjustment                                 -       -         -        -      ($0.2)   (0.1%)
  Loss on sale or disposal of property, plant and equipment        -       -         -        -       $0.1     0.0%
     Total discrete items                                         $4.1   1.7%      $1.5     0.7%      $0.9     0.5%
Operating margin adjusted for discrete items                     $37.3   15.4%     $18.9    9.5%     $22.0    11.5%
  Acquisition intangible amortization                             $4.4   1.8%      $3.6     1.8%      $7.5     3.9%
Adjusted operating margin                                        $41.7   17.2%     $22.6   11.3%     $29.5    15.4%

Note: percentages and dollars may not add due to rounding.                                                               21
Q2-2020: Adjusted EBITDA and adjusted EBITDA margin reconciliation ($ in millions) Q2-19($) Q2-19(%) Q1-20($) Q1-20(%) Q2-20($) Q2-20(%) GAAP net income $24.3 10.0% $13.3 6.7% $14.5 7.6% Interest expense, net $2.0 0.8% $1.2 0.6% $1.8 0.9% Income tax expense $7.2 3.0% $3.4 1.7% $6.4 3.3% Depreciation $7.7 3.2% $7.3 3.7% $7.4 3.8% Amortization $4.4 1.8% $3.7 1.8% $7.6 4.0% Stock-based compensation expense $3.7 1.5% $3.1 1.6% $3.9 2.0% Restructuring, severance, impairment and other related costs $3.7 1.5% $1.1 0.5% $0.6 0.3% Acquisition and related integration costs $0.3 0.1% $0.4 0.2% $0.4 0.2% Asbestos-related charges $0.1 0.0% - - - - Environmental accrual adjustment - - - - ($0.2) (0.1%) Transition services lease income ($0.3) (0.1%) - - - - Loss on sale or disposal of property, plant and equipment - - - - $0.1 0.0% Adjusted EBITDA $53.1 21.9% $33.4 16.8% $42.5 22.2% Note: percentages and dollars may not add due to rounding. 22
Q2-2020: Adjusted EPS reconciliation
                                                                 Q2-19 ($)   Q1-20 ($)   Q2-20 ($)
GAAP earnings per diluted share                                   $1.30       $0.71       $0.78
  Restructuring, severance, impairment and other related costs    $0.15       $0.04       $0.02
  Acquisition and related integration costs                       $0.01       $0.02       $0.02
    Environmental accrual adjustment                                 -           -       ($0.01)
       Total discrete items                                       $0.16       $0.06       $0.04
Earnings per diluted share adjusted for discrete items            $1.46       $0.77       $0.82
   Acquisition intangible amortization                            $0.18       $0.15       $0.31
Adjusted earnings per diluted share                               $1.64       $0.92       $1.13

Note: dollars may not add due to rounding.
                                                                                                     23
YTD 2020: Segment adjusted operating income and operating margin reconciliation
ACS EMS PES
($ in millions)
YTD-20 ($) YTD-20 (%) YTD-20 ($) YTD-20 (%) YTD-20 ($) YTD-20 (%)
Operating income and operating margin $21.1 15.6% $14.5 9.4% $ 0.8 0.8%
Restructuring, severance, impairment & other related costs $0.8 0.6% $0.3 0.2% $ 0.5 0.6%
Acquisition and related integration costs $0.8 0.6% $0.0 0.0% $0.0 0.0%
Environmental accrual adjustment ($0.1) -0.1% ($0.1) 0.0% ($0.1) -0.1%
Loss on sale of disposal of property, plant and equipment $0.0 0.0% $0.0 0.0% - -
Operating income and operating margin, adjusted for discrete items $22.7 16.7% $14.8 9.6% $1.2 1.4%
Acquisition intangible amortization $0.5 0.4% $9.7 6.2% $1.0 1.1%
Adjusted operating income and operating margin $23.2 17.1% $24.5 15.8% $2.2 2.4%
Note: percentages and dollars may not add due to rounding. 242019: Adjusted operating income and operating margin reconciliation
($ in millions) FY-18($) FY-18(%) FY-19($) FY-19(%)
Operating income and operating margin $112.7 12.8% $110.5 12.3%
Restructuring, severance, impairment and other related costs $9.0 1.0% $7.7 0.9%
Acquisition and related integration costs $2.6 0.3% $1.9 0.2%
Purchase accounting inventory adjustment $0.3 - - -
Asbestos-related charges $0.7 0.1% $1.7 0.2%
Environmental accrual adjustment - - $0.8 0.1%
Transition services, net $2.6 0.3% $0.9 0.1%
Loss (gain) on sale or disposal of property, plant and equipment ($0.4) (0.1%) $0.6 0.1%
Gain from indemnity claim and antitrust litigation settlements ($4.9) (0.6%) ($0.7) (0.1%)
Change in foreign jurisdiction tax regulation on equity awards
attributable to a prior period - - $0.5 0.1%
Total discrete items $9.9 1.2% $13.4 1.5%
Operating income and operating margin, adjusted for discrete items $122.6 14.0% $123.9 13.8%
Acquisition intangible amortization $16.3 1.8% $17.6 2.0%
Adjusted operating income and operating margin $138.9 15.8% $141.4 15.7%
Note: percentages and dollars may not add due to rounding. 252019: Segment adjusted operating income and operating margin reconciliation
ACS EMS PES
($ in millions)
FY-19 ($) FY-19 (%) FY-19 ($) FY-19 (%) FY-19 ($) FY-19 (%)
Operating income and operating margin $48.7 15.4% $57.1 15.8% $(1.4) -0.7%
Restructuring, severance, impairment & other related costs $3.1 1.0% $2.1 0.6% $2.5 1.3%
Acquisition and related integration costs $1.4 0.4% $0.5 0.1% $ - 0.0%
Asbestos-related charges $0.8 0.2% $0.5 0.1% $0.4 0.2%
Environmental accrual adjustment $0.4 0.1% $0.2 0.1% $0.2 0.1%
Transition services, net $0.9 0.3% - 0.0% - 0.0%
Loss (gain) on sale of disposal of property, plant and equipment $0.0 0.0% $0.6 0.2% - 0.0%
Gain from indemnity claim and antitrust litigation settlements $(0.3) -0.1% $(0.2) -0.1% $(0.2) -0.1%
Change in foreign jurisdiction tax regulation on equity awards
$0.2 0.1% $ 0.1 0.0% $0.1 0.1%
attributable to a prior period
Operating income and operating margin, adjusted for discrete items $55.1 17.4% $60.9 16.8% $1.7 0.9%
Acquisition intangible amortization $3.3 1.0% $11.6 3.2% $2.7 1.4%
Adjusted operating income and operating margin $58.3 18.4% $72.5 20.1% $4.4 2.2%
Note: percentages and dollars may not add due to rounding. 262019: Adjusted EBITDA and adjusted EBITDA margin reconciliation ($ in millions) FY-18($) FY-18(%) FY-19($) FY-19(%) Net Income $87.7 10.0% $47.3 5.3% Interest expense, net $6.6 0.8% $6.9 0.8% Income tax expense $22.9 2.6% $7.8 0.9% Depreciation $33.5 3.8% $31.4 3.5% Amortization $16.5 1.9% $17.8 2.0% Stock-based compensation expense $11.2 1.3% $12.3 1.4% Restructuring, severance, impairment and other related costs $9.0 1.0% $7.7 0.9% Acquisition and related integration costs $2.6 0.3% $1.9 0.2% Purchase accounting inventory adjustment $0.3 - - - Asbestos-related charges $0.7 0.1% $1.7 0.2% Environmental accrual adjustment - - $0.8 0.1% Transition services lease income ($0.9) (0.1%) ($1.0) (0.1%) Loss (gain) on sale or disposal of property, plant and equipment ($0.4) (0.1%) $0.6 0.1% Gain from indemnity claim and antitrust litigation settlements ($4.9) (0.6%) ($0.7) (0.1%) Pension settlement charges - - $53.2 5.9% Change in foreign jurisdiction tax regulation on equity awards attributable to a prior period - - $0.5 0.1% Adjusted EBITDA* $184.8 21.0% $188.2 21.0% Note: percentages and dollars may not add due to rounding *Adjusted EBITDA for 2018 has been recast to reflect the add-back of stock-based compensation expense. 27
2019: Adjusted EPS reconciliation
                                                                       FY-18 ($)   FY-19 ($)
GAAP earnings per diluted share                                         $4.70       $2.53
  Restructuring, severance, impairment and other related costs          $0.37       $0.31
     Acquisition and related integration costs                          $0.11       $0.08
     Purchase Accounting inventory adjustment                           $0.01         -
     Asbestos-related charges                                           $0.03       $0.07
     Environmental accrual adjustment                                     -         $0.03
     Transition services, net                                           $0.11       $0.04
    Loss (gain) on sale or disposal of property, plant and equipment   ($0.02)     $0.03
    Gain from indemnity claim and antitrust litigation settlement      ($0.20)     ($0.03)
    Pension settlement charges                                            -         $2.35
    Change in foreign jurisdiction tax regulation on equity awards
                                                                           -        $0.02
    attributable to a prior period
    Total discrete items                                                $0.40       $2.90
Earnings per diluted share adjusted for discrete items                  $5.10       $5.42
   Acquisition intangible amortization                                  $0.67       $0.72
Adjusted earnings per diluted share                                     $5.77       $6.14

Note: percentages and dollars may not add due to rounding.                                     28
You can also read