2018 Washington, DC and Northern Virginia - Investment Sales Office Report Colliers International DC Capital Markets Team

Page created by Craig Flores
 
CONTINUE READING
2018 Washington, DC and Northern Virginia - Investment Sales Office Report Colliers International DC Capital Markets Team
2018 Washington, DC and
Northern Virginia
Investment Sales Office Report
Colliers International DC
Capital Markets Team
2018 Washington, DC and Northern Virginia - Investment Sales Office Report Colliers International DC Capital Markets Team
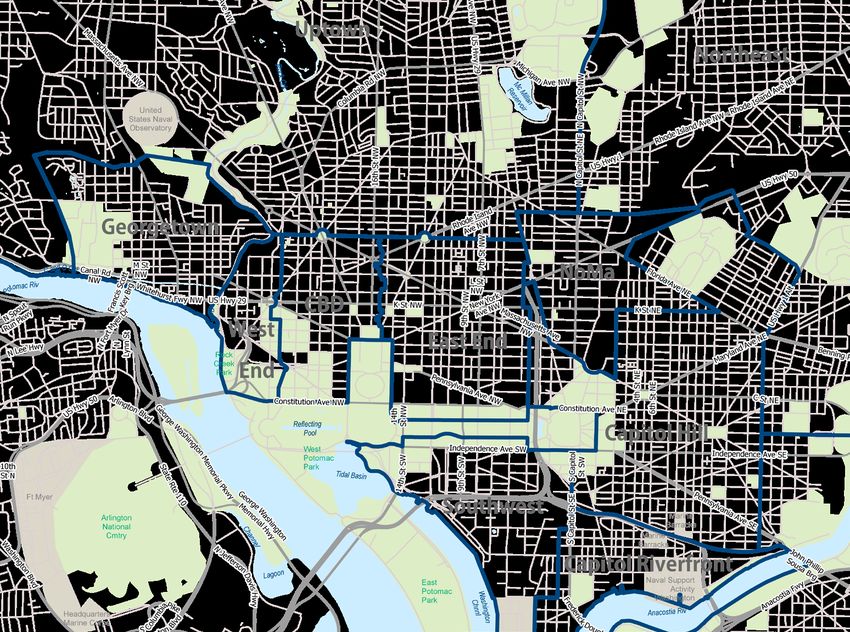
WASHINGTON, DC INVESTMENT SALES ACTIVITY - 2018
East End Sale Volume Doubles CBD Activity in 2018                                                                                   Sale Activity by Submarket
The 27 investment sale transactions in the downtown Washington, DC market in 2018 totaled $3.98
                                                                                                                                     Submarket           Deals        Total SF          Total $ Volume            YOY Change
billion, a 13.4% decrease from the total transaction volume in 2017.
                                                                                                                                     East End              12        2,931,862          $2,159,345,000              +$961 M
•                               ‘Core’ / ‘Trophy’ asset sales accounted for over half of the gross value generated, and
                                                                                                                                     West End              4         1,431,012           $849,800,000               +$550 M
                                capitalization rates averaged 4.69%; initial yields for ‘core plus’ assets averaged 5.5%;
                                                                                                                                     CBD                   7         1,525,002           $749,500,000                -$1.1 B
•                               While the CBD has historically accounted for the majority share of sales in the market - both
                                in terms of gross dollar value and square footage - the East End dominated the sales market          Southwest             2          406,372            $169,885,000               -$689 M
                                in 2018. A combination of the larger inventory of office space (34 million square feet) and          NoMa                  1          65,473             $27,500,000                -$450 M
                                positive net absorption (922,174 square feet) are contributing factors to this volume:               Capitol Hill          1          36,269              $23,775,000               -$316 M
                                »»    54.3% of the market share in terms of dollar volume;                                           Total                27        6,395,990          $3,979,805,000                   -
                                »»    91.4% increase from 2017 ($1.13 billion in nine (9) transactions);
                                »»    This submarket posted high-water mark sales of $1,274 per square foot (900 G Street,
                                      NW) and $1,190 per square foot (1440 New York Avenue, NW) – both assets were                  The Investor Pool Profile
                                                                                                                                                                                                      Other
                                      acquired by cross-border investors;                                                                                                                             4.8%
                                                                                                                                    In comparing year over year investor profiles,
                                »»    Five (5) of the eight (8) ‘core’ transactions and six (6) out of the twelve (12) ‘core plus   there is consistency with cross-border
                                      transactions occurred there;                                                                  investors continuing to bid for the ‘core’/
                                                                                                                                                                                                                Cross-Border
                                »»    With one (1) building under contract and six (6) additional office properties on the market   ‘trophy’ assets. Cross-border and
                                                                                                                                                                                           Private                  38.1%
                                      in the East End, we anticipate the velocity within the submarket to continue into 2019.       Institutional capital sources accounted                 25.8%
                                                                                                                                    for 61.3% of the purchases in 2017 and
•                               As of the end of the year, there were thirteen (13) assets on the market totaling 2.8 MM sf;        62.2% in 2018 (in terms of gross dollar
                                the majority of these assets have a ‘core plus’ or ‘value add’ profile and are located in various   value). Private equity capital investment
                                submarkets within the District.                                                                                                                                      Institutional
                                                                                                                                    was consistent year over year also with
                                                                                                                                                                                                        24.1%
                                                                                                                                    25.8% of the activity. Noticeably absent from any
                                                                                                                                    acquisition activity were the REITs; JBG Smith was a
‘Core’ Assets Generate Majority of 2018 Gross Volume                                                                                net seller, but the downtown market otherwise did not see
                                                                                                                                    any purchases from REITs. REITs have not been active in acquisitions
                                                                                                                                    primarily because their costs of capital and dividend requirements are strategically accretive
                                     $2,500
                                                                                                                                    - particularly given the return metrics in the downtown Washington, DC office submarkets.
                                              $995/sf
                                     $2,000
    Sales Volume ($ Millions)

                                                                                                                                    The leasing market is presenting some interesting dynamics for investors. As noted in the
                                                                    $487/sf                                                         leasing observations to follow, office absorption levels were strong in both the East End
                                     $1,500                                                                                         and CBD submarkets, and Class A and Trophy assets were the beneficiaries of much of this
                                                                                                                                    absorption. With low unemployment rates in the metropolitan Washington, DC market, the
                                     $1,000                                                                                         competition for skilled employees is stiff and many tenants see new buildings with amenities
                                                                                                                                    and work place efficiencies as critical to both retaining existing and recruiting new employees.
                                      $500                                                $438/sf                                   The absorption numbers bear this out in that the Class B and C spaces in the city suffered
                                                                                                                 $602/sf
                                                                                                                                    significant amounts of negative absorption. With a strong pipeline of new development
                                        $0                                                                                          underway, this part of the market may remain under pressure, but this pressure may also
                                               Core                 Core Plus             Value Add                User             create buying opportunities for investors willing to take on repositioning/redevelopment risk.
2018 Washington, DC and Northern Virginia - Investment Sales Office Report Colliers International DC Capital Markets Team
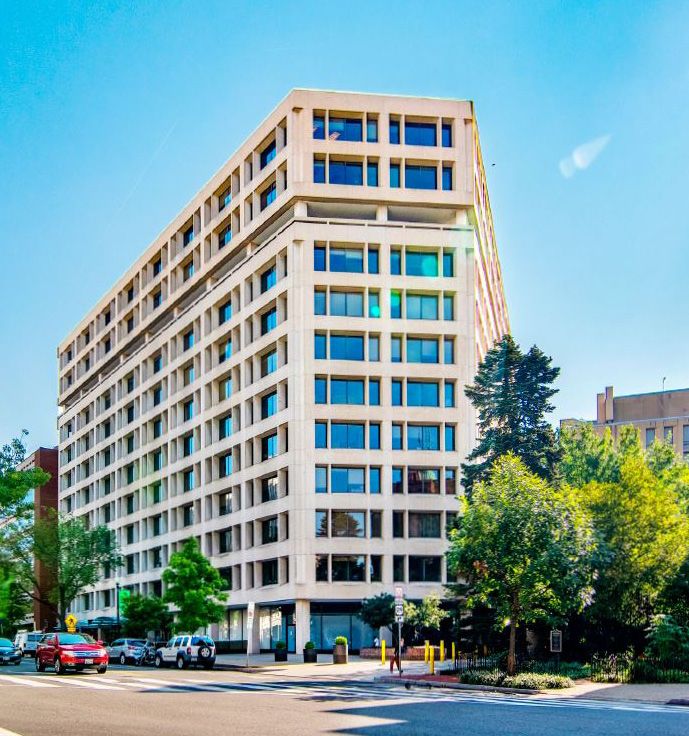
NOTABLE 2018 TRANSACTIONS - WASHINGTON, DC
‘Core’ Sale Transactions
                   2550 M Street, NW               900 G Street, NW                 1440 New York Avenue, NW
                   Sold 11/15/2018                 Sold 1/26/2018                   Sold 1/24/2018
                   $167,000,000                    $144,000,000                     $254,500,000
                   $806/sf                         $1,274/sf                        $1,190/sf
                   5.50% Capitalization Rate       4.20% Capitalization Rate        4.50% Capitalization Rate
                                                                                    Seller: Clarion Partners
                   Seller: Mirae Global            Seller: MRP Realty, ASB
                                                   Capital                          Buyer: Eastbanc JV Munich
                   Buyer: Menlo Equities                                            Real Estate
                   Comment: Law firm credit plus   Buyer: EXAN Capital
                                                                                    Comment: Law firm credit plus
                   lease duration                  Comment: New construction        lease duration

‘Core Plus’ Sale Transactions
                   1299 Pennsylvania Avenue, NW    1225 19th Street, NW             1250 Eye Street, NW
                   Sold 12/28/2018                 Sold 8/15/2018                   Sold 4/30/2018
                   $376,500,000                    $41,900,000                      $100,000,000
                   $615/sf                         $573/sf                          $562/sf
                   Seller: JBG Smith               4.60% Capitalization Rate        Seller: RREEF Asset
                   Buyer: CBRE Global Investors    Seller: Invesco                  Management
                   Comment: Lease up /             Buyer: Marcus Partners           Buyer: DSC Partners
                   repositioning                   Comment: Cosmetic renovation     Comment: Cosmetic renovation
                                                                                    plus lease up

‘Value Add’ Sale Transactions
                   1333 New Hampshire Ave, NW      2445 M St, NW                    1771 N Street, NW
                   Sold 11/30/2018                 Sold 6/28/2018                   Sold 1/22/2018
                   $132,500,000                    $101,600,000                     $36,100,000
                   $353/sf                         $313/sf                          $608/sf
                   Seller: Boston Properties       Seller: Washington REIT          Seller: National Association of
                   Buyer: The Meridian Group       Buyer: Beacon Capital Partners   Broadcasters
                   Comment: 100% lease up /        Comment: 100% lease up           Buyer: Stream Realty Partners
                   repositioning                                                    Comment: 100% lease up /
                                                                                    repositioning
2018 Washington, DC and Northern Virginia - Investment Sales Office Report Colliers International DC Capital Markets Team
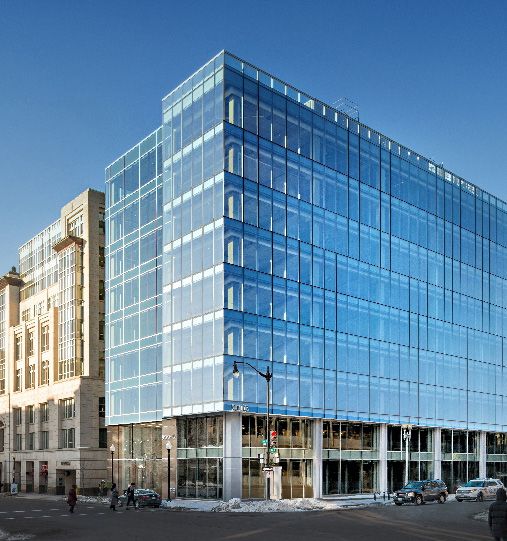
WASHINGTON, DC LEASING ACTIVITY - 2018
2018 Market Leasing Observations                                                                       Development Pipeline
•   While there has been limited rental rate growth and although lease transaction costs
    remain high, Class A and Trophy space posted strong results in 2018 in the traditional                     CBD                    East End                       NoMa                     Capitol Hill
                                                                                                            1.03 MM SF                1.54 MM SF                   1.07 MM SF               560,000 MM SF
    submarkets of the CBD and East End; collectively, these submarkets registered 1.9 million
                                                                                                         25.6% Pre-Leased          42.5% Pre-Leased             93.2% Pre-Leased            3.7% Pre-Leased
    square feet of positive absorption;
•   Class B and C space was under pressure with negative absorption in three submarkets
    (CBD (1,233,550 sf), East End (531,886 sf) and Uptown (343,176 sf) totaling 2.1 million
    square feet;
    »»   Move-outs/relocation of both private sector tenants (Akin Gump, Urban Institute,
         Chadbourne Park, National Geographic) and government tenants (Department of
         Justice, Fannie Mae) were part of the exodus from this Class B/C product;
    »»   Increased transaction costs/concessions have put pressure on net effective rent
         growth;
•   The development pipeline includes 4,319,544 square feet to be delivered in 2019-2021
    timeframe; approximately 46% of this space has been preleased:
•   Co-working tenants and occupiers absorbed approximately 1.35 million square feet over
    the last 24 months, representing approximately 1.4% of the total office inventory in the
    downtown market;
                                                                                                         Capitol Riverfront
•   Both landlords and tenants are intensely focused on “flexible work space,” and many                     124,928 SF
    landlords are investing capital in speculative suites to help meet the demand.                       58.5% Pre-Leased

Leasing Statistics by Submarket
Market                 Existing Inventory     New Supply      2018 New Supply      Under Construction    Q4 Absorption        2018 Absorption         Overall Vacancy Rate         Direct Asking Rental Rate
Capitol Hill               3,601,540                -              425,420                 560,000           67,078               140,178                   20.6%                           $62.39
Capitol Riverfront          4,041,467               -              231,616                  124,928           -1,906             168,542                     7.7%                           $53.30
CBD                        22,745,919            101,850          1,363,092                1,031,081          2,700               982,148                    11.6%                          $62.60
East End                   34,220,782           1,047,874          1,152,874               1,535,162         457,332              922,174                    14.5%                          $64.51
Georgetown                  1,641,799               -                  -                       -            -100,586             -126,123                    15.6%                          $50.67
NoMa                        9,001,182               -                  -                   1,068,373         78,969              309,082                     9.6%                           $53.52
Southwest                  9,885,094            215,000            482,560                     -             132,034             378,758                     14.2%                          $48.75
West End                   2,884,870                -                  -                       -            -295,130             -290,040                   22.2%                           $51.18
Uptown                      2,193,535               -                  -                       -             -11,443             -502,403                    26.9%                          $51.16
Total                      90,216,188           1,364,724         3,655,562                4,319,544         329,048             1,982,316                  15.88%                         $55.34
2018 Washington, DC and Northern Virginia - Investment Sales Office Report Colliers International DC Capital Markets Team
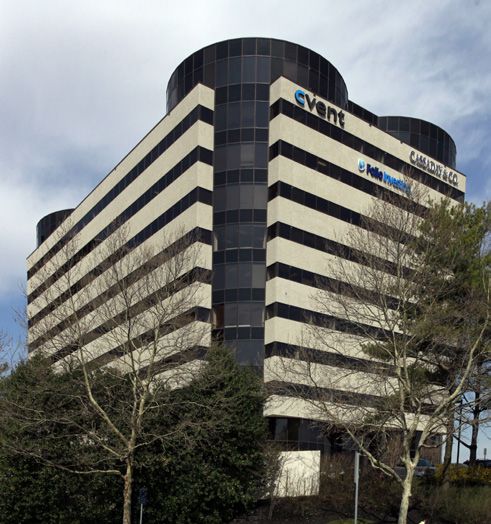
NORTHERN VIRGINIA INVESTMENT SALES ACTIVITY - 2018
Northern Virginia Sales Market Remains Stable                                                                                     Sale Activity by Submarket
The Northern Virginia investment sales market remained steady in 2018 with 50 transactions (over
                                                                                                                                   Submarket             Deals       Total SF        Total $ Volume       YOY Change
$10 million) totaling nearly $3.0 billion, which is comparable to the $2.99 billion of volume in 2017.
                                                                                                                                   Herndon                 6        2,882,939        $732,420,000           +$521 M
•                               There were six (6) ‘core’ transactions and the capitalization rate for these averaged 6.48% - a
                                significant premium to ‘core’ asset yields in the downtown Washington, DC market;                  Rosslyn-Ballston        5        1,296,391         $549,841,180          -$255 M

•                               ‘Core plus’ sale transactions comprised nearly 50% of the gross dollar value                       Tysons                   7       1,932,449        $508,600,000           -$281 M
•                               The Reston-Herndon submarkets had significant gross dollar volume with $1.06 billion in total
                                                                                                                                   Reston                   7       1,289,199         $327,977,000          +$280 M
                                sales in 13 deals:
                                »»    Two (2) transactions comprised 50% of that volume with Rockpoint Group’s                     Old Town Alexandria     5         769,963         $203,250,000           +$172 M
                                      recapitalization of Brandywine Realty Trust’s Dulles Corner portfolio ($312 million) and
                                                                                                                                   I-395                   4        1,429,224         $152,117,260           +$98 M
                                      Harbor Group’s purchase of 13200 Woodland Park Road ($226 million);
•                               The next highest grossing submarket in terms of dollar value was the Rosslyn-Ballston              Eisenhower Ave           3        889,594          $141,800,000          +$142 M
                                submarket with five (5) transactions totaling $550 million:
                                                                                                                                   Route 28 South          4         576,152          $141,120,000           +$16 M
                                »»    The second largest transaction in Northern Virginia was Arlington Tower (398,000 square
                                      feet), which sold in January 2018 for $250 million to Washington REIT;                       Fairfax/Oakton          4         881,129          $103,300,000           +$12 M

•                               Tysons continued to perform strongly with seven (7) transactions totaling $476 million (an         Route 28 North           3        592,744          $95,942,300            -$28 M
                                average price per square foot of $272);
                                                                                                                                   McLean                  2         98,775           $25,700,000            +$10 M
•                               Although the Route 28 Corridor (with nearly 370,000 sf of positive net absorption) also had
                                seven (7) sales, the total transaction volume for that submarket was only $237 million (with an    Total                   50      12,638,559       $2,982,067,740              -
                                average price per square foot of $203).

‘Core Plus’ Assets Generate Majority of 2018 Gross Volume                                                                         The Investor Pool Profile                                       Other
                                                                                                                                                                                         REIT     2.2%
                                                                                                                                  Private sector investors remain the most
                                     $2,000                                                                                                                                             12.7%
                                                                                                                                  prevalent capital source in the Northern
                                                                                                                                  Virginia region, investing in over $1.2                               Institutional
                                     $1,600                        $289/sf
    Sales Volume ($ Millions)

                                                                                                                                  billion in assets and accounting for 40.3%                               34.1%
                                                                                                                                  of the gross dollar value and 60% of
                                     $1,200                                                                                       the transactions in 2018. Institutional
                                              $400/sf
                                                                                                                                  investors were also active, accounting             Private
                                      $800                                              $157/sf                                                                                      40.3%
                                                                                                                                  for $1.03 billion - 34.1% of the gross dollar                         Cross-
                                                                                                                                  value. Cross-border capital sources invested                         Border
                                      $400                                                                                        in only two (2) Northern Virginia assets this year                    10.6%
                                                                                                               $136/sf
                                                                                                                                  - Harbor Group Management Company as previously
                                        $0                                                                                        noted in reference to 13200 Woodland Park Road and Kawa
                                               Core                Core Plus            Value Add               User
                                                                                                                                  Capital Management who purchased Braddock Place in Old Town Alexandria.
2018 Washington, DC and Northern Virginia - Investment Sales Office Report Colliers International DC Capital Markets Team
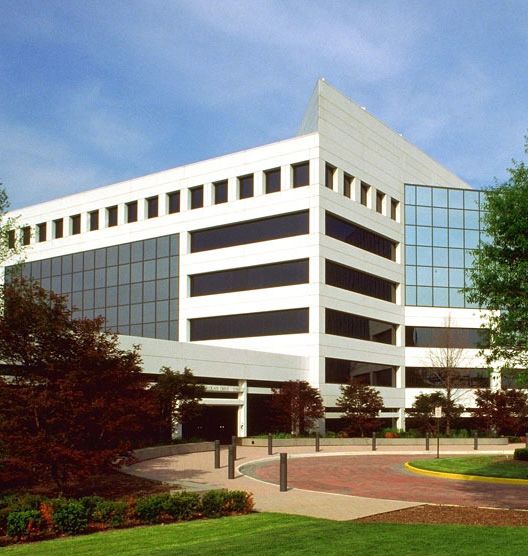
NOTABLE 2018 TRANSACTIONS - NORTHERN VIRGINIA
‘Core’ Sale Transactions
                   14360-14370 Newbrook Drive             13200 Woodland Park Road           1300 North 17th Street
                   Sold 4/11/2018                         Sold 2/28/208                      Sold 1/24/2018
                   $95,000,000                            $226,000,000                       $250,000,000
                   $297/sf                                $560/sf                            $629/sf
                   6.75% Capitalization Rate              5.46% Capitalization Rate          6.25% Capitalization Rate
                   Seller: Equus Capital Partners         Seller: Federal Capital Partners   Seller: Tishman Speyer
                   Buyer: Hines                           Buyer: Harbor Group                Buyer: Washington REIT
                   Comment: Leased with credit,           Management Co.                     Comment: In-fill location;
                   duration                               Comment: Lease duration            quality asset

‘Core Plus’ Sale Transactions
                   1550-1560 Wilson Boulevard             8180-8200 Greensboro Drive         1310-1340 Braddock Place
                   Sold 11/16/2018                        Sold 6/7/2018                      Sold 1/19/2018
                   $102,500,000                           $142,000,000                       $93,000,000
                   $365/sf                                $277/sf                            $260/sf
                   6.10% Capitalization Rate              5.50% Capitalization Rate          7.60% Capitalization Rate
                   Seller: Brookfield Office Properties   Seller: Beacon Capital Partners    Seller: Washington REIT
                   Buyer: Empire Leasing                  Buyer: Altus Realty, Velocis       Buyer: Kawa Capital Mgmt.
                   Comment: Moderate lease up;            Comment: Lower cost provider       Comment: Metrorail access
                   lower cost provider                    in strong submarket                with some re-lease

‘Value Add’ Sale Transactions
                   13100-13150 Worldgate Drive            200 Stovall Street                 8320 Old Courthouse Road
                   Sold 9/25/2018                         Sold 2/22/2018                     Sold 5/31/2018
                   $44,920,000                            $45,000,000                        $11,000,000
                   $127/sf                                $73/sf                             $123/sf
                   Seller: Fannie Mae                     Seller: Hoffman Management         Seller: Tycon One, Inc.
                   Buyer: MRP Realty                      Company                            Buyer: Carderock Investment
                   Comment: Short term lease, then        Buyer: Perseus Realty              Comment: Repositioning; low
                   repositioning                          Comment: Repositioning/            cost provider
                                                          conversion to multifamily
2018 Washington, DC and Northern Virginia - Investment Sales Office Report Colliers International DC Capital Markets Team
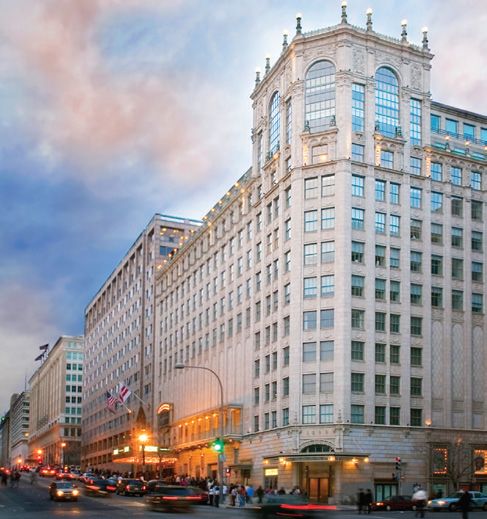
NORTHERN VIRGINIA LEASING ACTIVITY - 2018
2018 Leasing Market Observations
•   The US Government continued to be a driving force in              •      Northern Virginia saw an increase in office inventory in             •   Vacancy for the Northern Virginia region hit its lowest rate
    various quadrants of Northern Virginia by executing large-               2018: 1.46 million square feet of office product delivered in            since 2013 this past summer at 17.2%;
    scale leases such as:                                                    the third quarter alone:
                                                                                                                                                  •   Not unlike what has happened in the District, Class A space
    »»    The Drug Enforcement Administration’s 511,487 sf, 15-              »»   Capital One’s new headquarters building at their Tysons             has outperformed Class B and C space; Class A buildings
          year renewal at 600-700 Army Navy Drive;                                campus added 975,000 sf;                                            throughout the Northern Virginia market absorbed 2.5
                                                                                                                                                      million square feet, and Class B / C buildings absorbed
    »»    The U.S. Customs and Border Protection Agency’s new                »»   Comstock commenced the construction of the second
                                                                                                                                                      148,787 square feet.
          lease at five Quantum Park buildings for 445,000 sf;                    office building in their Reston Station project;
    »»    The CIA’s 480,000 sf build to suit in Chantilly;

Leasing Statistics by Submarket
Market                               Existing Inventory      2018 New Supply         Under Construction       Q4 Absorption       2018 Absorption         Overall Vacancy Rate        Direct Asking Rental Rate
Carlyle/King St Metro                     7,785,309                   -                        -                  101,331               69,982                    10.7%                         $38.74
Eisenhower Ave Corridor                    792,985                    -                        -                   2,721                12,107                     8.3%                         $29.27
I-395 Corridor                            8,550,121                   -                     24,410                -35,398               -2,591                    34.0%                         $29.72
Old Town                                  5,670,367                   -                        -                 -105,853              -49,394                    11.3%                         $33.56
Falls Church                              4,498,818                   -                        -                   2,164                -4,674                     9.7%                         $32.85
National Landing                         12,680,262               100,000                   735,687               193,410              468,104                    16.2%                         $37.99
Rosslyn/Ballston Corridor                24,888,541               175,000                  240,000                285,936              570,935                    21.5%                         $42.58
Fairfax/Oakton                            13,581,416                  -                        -                  70,953               120,160                    18.7%                         $26.90
Herndon                                   12,144,186                  -                        -                  -82,313               -17,930                   21.3%                         $31.52
McLean                                    1,558,716                   -                        -                   -3,261              -13,925                     9.7%                        $48.62
Merrifield                                8,747,561                   -                        -                  94,060               101,570                    16.7%                         $30.92
Reston                                   18,968,800                179,152                  346,457               152,196              -351,611                   15.2%                         $32.46
Route 28 Corridor South                  14,960,067               480,000                      -                   7,068               368,835                    15.9%                         $26.81
Tysons Corner                            29,644,963               975,000                   580,419               14,895              1,007,748                   16.9%                         $32.83
Vienna                                    1,607,934                   -                        -                   9,848                14,784                    10.8%                         $28.16
Route 28 Corridor North                   9,571,272                   -                        -                   17,022              192,931                    15.6%                         $25.44
Route 7 Corridor                          4,296,769                   -                     35,700                 -8,841               35,764                     7.3%                        $25.28
Total                                   179,948,087               1,909,152                1,962,673              715,938             2,522,795                  15.28%                        $32.57
2018 Washington, DC and Northern Virginia - Investment Sales Office Report Colliers International DC Capital Markets Team
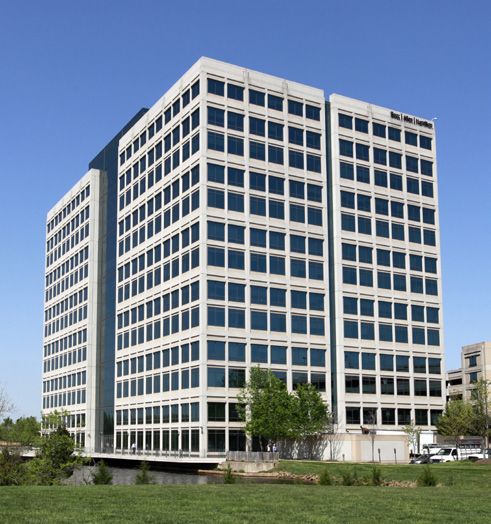
REGIONAL ECONOMIC FORECAST
Regional Demographics                 Interest Rate Trends                                                                                            Job Change by Sector - 2017 to 2018
                                                                                                                                                                                                            (000’s)
                                                     8.0%                                                                                             Professional/Business                                                                                   15.1

        Current Population                           7.0%
                                                                                                                                                                   Health/Edu                                                                     10.5
        (2018)
                                                                                                                                                                  Federal Gov.           -5.9
        5,556,400                                    6.0%
                                                                                                                                                            State & Local Gov.                                                        5.9

                                 Interest Rate (%)
                                                     5.0%                                                                                                           Hospitality                                                             8.3

        Projected Population                         4.0%
                                                                                                                                                                   Retail Trade                                        2
        (2023)                                                                                                                                                 Other Services                                              3

        5,901,840                                    3.0%                                                                                                         Construction                                                 4.2
        (6.2% increase)
                                                                                                                                                            Financial Activities                                       2.5
                                                     2.0%
                                                                                                                                                                 Info Services                                   0.6

        Median Household                             1.0%
                                                                                                                                                      Transportation/Utilities                                              3.2
        Income (2018)
        $101,290
                                                     0.0%                                                                                                     Wholesale Trade                          -0.6

                                                                                          2011
                                                                                   2010

                                                                                                 2012

                                                                                                        2013

                                                                                                                2014

                                                                                                                       2015

                                                                                                                               2016

                                                                                                                                      2017

                                                                                                                                             2018
                                                             2007

                                                                     2008

                                                                            2009
                                                                                                                                                                Manufacturing                                   0.5

                                                                             10-Year T             Federal Reserve               Prime                                             -10      -6         -2         2               6          10          14          18

        Average Household Size
                                       The Changing Structure of the Washington, DC Regional Economy
        2.7
                                            2010                                                                              2017
                                                                                                                                                                                                                           Local Serving Activities
                                                                    12.0%                                                                           15.3%
        Unemployment Rate                                                                                                                                                                                                  Non-local Serving Businesses
        (Oct. 2018)

        3.3%                                                                                      Total                                                                      Total
                                                                                                                                                                                                                           Federal Wages & Salaries,
                                                                                                                                                                                                                           Procurement, Other Federal
                                                                                                 Federal                                                                    Federal
                                                                                                 39.8%                                                                       31.2%                                         International

  S
        Median Home                                  34.8%                                                                      38.0%                                                                                      Hospitality
        Value (2017)
        $408,400                                                                                                                                                                                                           Associations

                                                                                                                                                                                                                           Health/Education

                                                                                                               3.5%                                                                             3.8%                       Other
        Education Attainment
        College Diploma:
                                                             1.6%           4.5%          1.8%          2.1%                                 1.5%     5.8%              1.8%             2.6%
        57.9%
                                 Source: The Stephen Fuller Institute at the Schar School, GMU
2018 Washington, DC and Northern Virginia - Investment Sales Office Report Colliers International DC Capital Markets Team
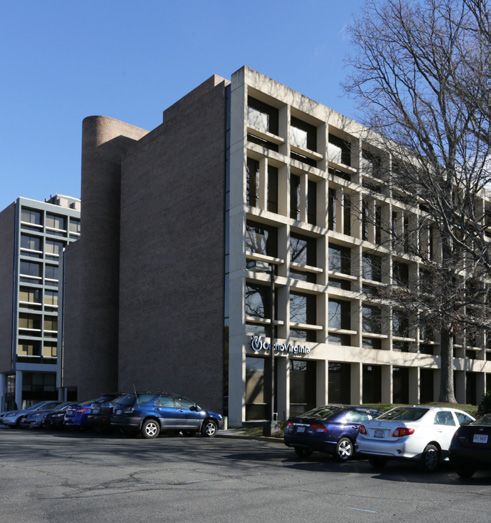
COLLIERS DC CAPITAL MARKETS TEAM

 William E. Kaye                             David B. Gast                           Michael D. Blunt                         Kate S. Howarth                    John Broderick
 Executive Vice President                 Executive Vice President                   Executive Vice President                   Senior Vice President             Senior Vice President
       202.728.3515                            202.728.3534                              202.534.3614                               202.534.3609                      617.330.8047
  bill.kaye@colliers.com                  david.gast@colliers.com                   michael.blunt@colliers.com                kate.howarth@colliers.com        john.broderick@colliers.com

 David W. Parker                               William Ide                              Rob Hartley                                 Hilary Sayre                  Julia Howard
Regional Managing Director                  Senior Financial Analyst                   Director of Research                   Client Services Specialist      Sr Client Services Coordinator
       202.728.3541                               202.728.3545                             703.394.4852                             202.728.3549                       202.534.3622
david.w.parker@colliers.com                 william.ide@colliers.com                robert.hartley@colliers.com               hilary.sayre@colliers.com         julia.howard@colliers.com

Team Capabilities

                                                                                                                                           104 $19 B
The Colliers International Washington, DC Capital Markets team is led by experienced team of brokerage professionals with a
proven record of delivering compelling returns for stakeholders over more than 30 years. Our team consists of professionals who
work collaboratively to provide real estate expertise to our clients, acting in an advisory capacity to help each client maximize
investment returns, whether as a seller, purchaser or borrower. We have the knowledge and experience necessary to meet the
needs of both our institutional and private capital clients, recognizing that these client groupings have different requirements.       Combined Years             Gross Volume
Our platform is enhanced by our national Debt & Equity Financing (DEF) producers who help both our institutional and private
                                                                                                                                         of Experience               of Deals
capital clients. This specialized group assists with debt and equity capital for new development, acquisitions, refinance and
expansion or renovation of commercial real estate assets of all sizes and geographies.
                                                                                                                                                           Colliers International
Colliers International Group Inc. (NASDAQ: CIGI) (TSX: CIGI) is a top tier global real estate services and investment management                           1625 Eye Street, NW, Suite 700
company operating in 69 countries with a workforce of more than 13,000 professionals. Colliers professionals think differently,                            Washington, DC 20006
share great ideas and offer thoughtful and innovative advice to accelerate the success of its clients.                                                     www.colliers.com/washingtondc
2018 Washington, DC and Northern Virginia - Investment Sales Office Report Colliers International DC Capital Markets Team
You can also read