WHATCOM COUNTY 2021-2034 FOURTEEN-YEAR FERRY CAPITAL PROGRAM - EXHIBIT "B"
←
→
Page content transcription
If your browser does not render page correctly, please read the page content below
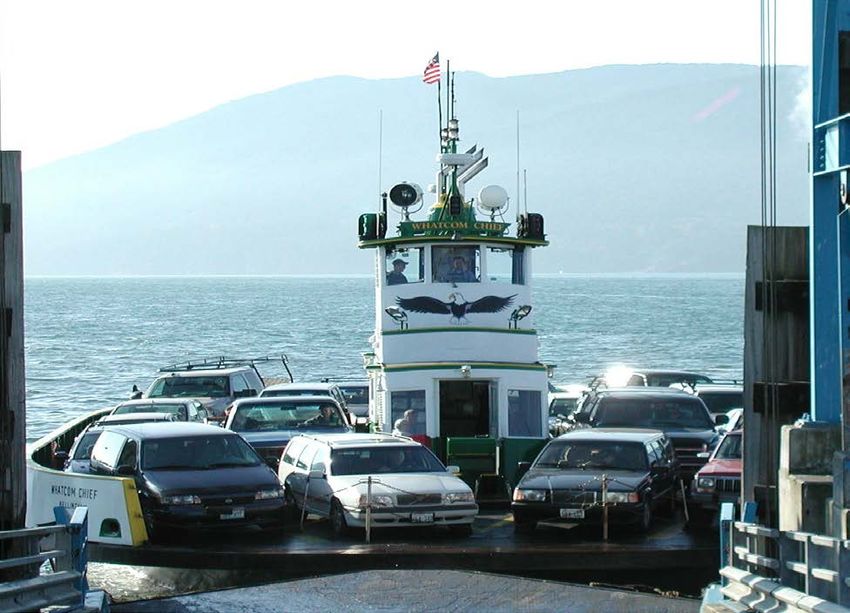
EXHIBIT “B”

   WHATCOM COUNTY
2021-2034 FOURTEEN-YEAR
 FERRY CAPITAL PROGRAM
Overview
This program provides a blueprint for the effective, efficient, and continuing operation
of the Whatcom County Ferry System within existing financial constraints. Capital
improvements are scheduled based on many years of experience operating and
maintaining the system while complying with applicable regulations.

Inevitably, priorities and available funds for the ferry system will change over the
fourteen years projected in this program. Therefore, the program intends to be a guide
indicating long-range improvements and anticipated revenues and expenditures. Strict
adherence is not required.

Enacted in 1975, Revised Code of Washington (RCW) 36.54.015 states “The legislative
authority of every county operating ferries shall prepare, with the advice and assistance
of the county engineer, a fourteen-year long-range capital improvement plan embracing
all major elements of the ferry system. Such plan shall include a listing of each major
element of the system showing its estimated current value, its estimated replacement
cost, and its amortization period.”

Table 1: Ferry System Current and Replacement Values – meets applicable
requirements, showing the current value, replacement cost, and amortization periods
for the vessels and facilities. The current value of the M/V Whatcom Chief is the insured
value, the closest approximation of true worth. The facilities’ current value is book
value; original cost less depreciation plus depreciated improvements.

RCW 36.81.121 (1) states “…the legislative authority of each county, after one or more
public hearings thereon, shall prepare and adopt a comprehensive transportation
program for the ensuing six calendar years….and for those counties operating ferries
shall also include a separate section showing proposed capital expenditures for ferries,
docks, and related facilities. Copies of the program shall be filed with the county road
administration board and the secretary of transportation not more than thirty days after
its adoption by the legislative authority…” Subsection (2) requires expanded information
on how a county will spend all its money on the various facets of the transportation
program. This RCW Section was enacted in 1961. The capital expenditure portion of
Subsection (1) is satisfied by:

Table 2: Projected Revenues defines the known and/or anticipated sources of
operating and capital project funding for the 14-Year Plan.

Table 3: Projected Expenditures include all other expenditures on the system that meet
Subsection (2) requirements. Operational expenditures are delineated between the
vessel and non-vessel costs. U.S. Coast Guard regulations currently require the ferries to
be dry-docked every two years, however, to extend the life, improve reliability, and
protect our capital investment Whatcom County schedules dry-docking every year for
its vessel. The landings are inspected regularly as required by the National Bridge

                                           -2-
Inspection Standards administered through the Washington State Department of
Transportation. The inspection report helps identify and schedule major maintenance
and replacement of these facilities.
This RCW section also provides the reporting requirement and timing of program
submission, as well as establishing the annual update requirement.
Additionally, the Federal Highway Administration requires all agencies within a
Metropolitan Planning Organization to develop and annually update the long-range
Transportation Improvement Plans and their Biennial Element. Whatcom County
updates this 14-Year plan each year and incorporates the results into the Six-Year
Transportation Improvement Program.
Level-of-Service
On July 24, 2018, the Whatcom County Council passed resolution #2018-026. This
resolution established a level of service for the Lummi Island Ferry System. Also, the
resolution enacts an action plan to achieve the recommended improvements including:
1. Vessel
A. Balancing capacity against operating costs (fuel, personnel, etc.) to ensure
affordable fares over the long run, including needs-based fares, while optimizing
vehicle demand, deck space, and trip frequency to minimize wait times, the
design of a 34 car vessel is in the 2021-2026 Six-Year Transportation
Improvement Program. The timing of the design and construction shall coincide
with the next cycle of funding by the County Road Administration Board.
B. The design of the vessel shall accommodate all walk-on passengers during typical
peak times, accommodate legal loads of vehicles per Washington State
Commercial Vehicle Guide and comply with U.S. Coast Guard safety standards
and the Americans with Disabilities Act.
C. To approach the goal of a carbon-neutral vessel and provide flexibility for future
electric conversion and reliability, the design of the vessel shall be a hybrid
diesel-electric.
2. Terminals
A. The design of the marine structure modifications to the Gooseberry Point
terminal and Lummi Island terminal to accommodate the new vessel are
included in the 2021-2026 Six-Year Transportation Improvement Program
and take into consideration the plan, listed 2E-2H below, to move the
Gooseberry terminal at a future date. The timing of the design and
construction shall coincide with the next cycle of funding by the County
Road Administration Board and the construction of the new vessel.
B. In addition to the modifications to accommodate a new vessel,
improvements to the Lummi Island terminal shall include: reconfigure the
queuing lanes, install ADA restrooms, and improve bicycle and pedestrian
loading by locating the queuing area as close to the vessel as possible to
reduce the time required to load onto the ferry.
-3-C. Implement remote ferry queue monitoring.
D. Implement self-service ticketing.
E. Whatcom County will initiate an intergovernmental agreement with the Lummi
Nation to confirm the location of the Gooseberry Point Terminal as shown on the
2015 Lummi Nation TIGER grant application. Upon the finalization of the
agreement, Whatcom County Public Works shall initiate the environmental
review and permitting process for the Gooseberry Point terminal relocation.
F. Construction of the new Gooseberry Point terminal relocation is to be
accomplished before the end of the Uplands Lease Agreement with the Lummi
Nation (October 2046). The design shall include dual lane loading and improve
bicycle and pedestrian loading by locating the queuing area as close to the vessel
as possible to reduce the time required to load onto the ferry.
G. Whatcom County shall coordinate the Gooseberry Point terminal relocation with
the Lummi Nation’s permitting, funding, and construction of the future
Fisherman’s Cove Improvements.
H. As property becomes available, Whatcom County shall purchase lands adjacent
and near the new location of the Gooseberry Point terminal. The property will
be utilized for off-street queuing, parking, and passenger amenities.
I. All infrastructures shall be designed to accommodate the 100-year sea-level rise
prediction by NOAA.
3. Operations
A. A Whatcom County ferry district may be created to increase grant opportunities.
This district shall be funded by a seasonal surcharge on single cash fares for the
capitalization of future vessels.
B. The long-term improvements shall be phased over time to allow for a complete
funding portfolio to leverage a variety of funding sources and mechanisms.
Minor Maintenance
General minor maintenance is continual on the ferry, landings, aprons, approaches, and
waiting facilities. The costs and extent of the work is unpredictable, and frequently
problems must be repaired immediately upon detection. Routine maintenance such as
building painting and roof cleaning is more predictable and scheduled in advance.
-4-History of the Ferry System
The ferry system is the only public transportation link for the majority of Lummi Island
residents and vehicles to the mainland at Gooseberry Point. In the event of an
emergency ferry outage or mechanical failure, the County has contracted pedestrian-
only ferry services while the vessel is being repaired.
Following is a brief chronology outlining the history of the Whatcom County Ferry
System.
GP denotes work occurred at the Gooseberry Point Terminal
LI denotes work occurred at the Lummi Island Terminal
1926 Lummi Shore Road from Bellingham was completed and a ferry, the Central, owned by
Whatcom County and large enough to hold six small Model-T Fords started making
scheduled runs between Lummi Island and Gooseberry Point.
1929 The slightly larger Chief Kwina replaces the Central.
1950 Gooseberry Point terminal built (GP)
1962 The M/V Whatcom Chief begins service
1977 Lummi Island terminal is relocated (LI)
1981 New transfer span and tower superstructure installed (LI)
1982 Approach span trestle refurbished (GP)
1986 Transfer span, tower structures, and marine structures replaced (GP)
1993 South inner and mid-ship timber dolphins replaced/installed (LI)
1999 Emergency South outer dolphin and breakwater repair (LI)
1999 Electrical feeder replacement (GP)
2001 Major maintenance on both terminals including painting, new aprons, electrical work,
new hydraulics, tower bolt replacement (LI and GP)
2002 20-Year Plan Phase 1 Process and report completed
2005 South outer timber dolphin replaced with steel structure (LI)
Major Status Report on the Ferry System
2006 Emergency bearing seat pedestal replacement (LI)
Parking lot improvements (LI)
Major corrosion repair to vessel hull
Completed design package for a 35-car replacement vessel
Completed design package for urgent electrical/structural terminal repairs
First Rate Increase in 5 years
2007 Bridge bearings replaced (LI)
Electrical repairs (LI and GP)
2008 Two North timber dolphins replaced with steel doughnut dolphins designed for larger
35-car ferry boat design (LI)
Counterweight sheaves replaced (GP and LI)
Rate increase
2009 Emergency North wingwall replacement (LI)
-5-Traffic Gates Installed (LI and GP)
Rate adjustment
2010 Emergency South wingwall replacement (LI)
2011 New live load hangers and pins installed (GP)
2013 Steel apron flaps replaced with rubber-coated flaps (LI)
Timber wingwalls replaced with steel structures (GP)
Terminal remote control system installed, electrical and hydraulic equipment updates
(LI)
2014 Terminal remote control system installed (GP)
All four timber dolphins replaced with steel structures (GP)
2015 Steel apron flaps replaced with rubber-coated flaps (GP)
Emergency temporary repair to outer timber dolphin (LI)
Rate adjustment
2017 Electrical system overhaul (GP)
2018 Structural steel repair work including new lifting beam, new live load hangars, and
replacement of corroded high-strength bolts and diagonal bracing (GP)
Structural steel repair work including replacement of corroded high-strength bolts and
diagonal bracing (LI)
2019 Commenced public outreach and preliminary vessel and terminal designs
2020 COVID 19 significantly impacted operations resulting in lost revenue, reduced ridership,
and conversion to cashless fares to mitigate risk
Completed propulsion study for new vessel
Applied for federal Build Grant and state Consolidated Grant Program
Whatcom County obtained approval from USCG to modify the annual dry-docking
schedule with a dockside maintenance substitution. This will be continued for future dry
dockings when eligible.
Terminal structural improvements and full paint job (LI)
-6-EXHIBIT “B”
Table 1
FERRY SYSTEM CURRENT AND REPLACEMENT VALUES - 2020
VESSELS
M/V Whatcom
Current Statistics Chief
LENGTH (ft) 94
BEAM (ft) 44
DISPLACEMENT (tons) 78
YEAR BUILT 1962
CAPACITY -- Passengers 100
CAPACITY -- Cars 20
CURRENT INSURED VALUE - 2020 $890,000
TOTAL CURRENT VALUE - 2020 $890,000
Replacement Statistics
YEAR 2024
LENGTH (ft) 184
BEAM (ft) 54
DISPLACEMENT (tons) 100
CAPACITY -- Passengers 150
CAPACITY -- Cars 34
REPLACEMENT VALUE(1) $19,500,000
TOTAL - REPLACEMENT VALUE $19,500,000
FACILITIES
SCHEDULED
REPLACEMENT ESTIMATED
YEAR BUILT OR AMORTIZATION /MODIFICATION CURRENT BOOK REPLACEMENT
LOCATION REBUILT PERIOD END YEAR VALUE(4) COST 2020 $'s (2)
Lummi Island Landing
Transfer Span and Dock 1982 2022 2040 $472,802 $10,609,000
Dolphins/Wingwall/Breakwater 1978 2018 2024 $1,247,481 $7,426,300
Upland Facilities 1978 2018 2024 $60,000 $4,243,600
Subtotal - Lummi Island Landing $1,780,283 $22,278,900
Gooseberry Point Landing
Transfer Span and Dock 1987 2027 2024-2046 $569,042 $24,931,150
Dolphins/Wingwall (3) 2013, 2014 2053, 2054 2024-2046 $2,945,405 $3,182,700
Upland Facilities $0 $10,078,550
Subtotal - Gooseberry Point Landing $3,514,447 $38,192,400
TOTAL FACILITIES VALUE $5,294,730 $60,471,300
TOTAL VESSEL & FACILITIES VALUE $6,184,730 $79,971,300
NOTES:
(1)
Cost based on 2020 estimate with 3% per year escalation through 2024
(2)
Per 2018 LOS Alternatives Analysis by KPFF Consulting (Costs have been escalated 3% per year and represent a 2020 replacement cost.)
(3)
Replacement requires relocation. A phased approach to relocation will include modifications to existing facilities prior to completion of
the new facility.
(4)
Estimated using a 40-year life and straight-line depreciation (including depreciated improvements)Table 2
Lummi Island Ferry 14-Year Capital Program
All $ in 000's Revenues 2021-2027
Category 2021 2022 2023 2024 2025 2026 6 2027
Multi-Ride Fares (3) $ 1,448 $ 1,443 $ 1,475 $ 1,508 $ 1,542 $ 1,944 $ 1,987
Single-Ride Fares (4) 362 361 369 377 385 486 497
(Memo 55% of Operating Cost) (1) 1,811 1,804 1,844 1,885 1,927 2,430 2,484
MVFT Deficit Subsidy 250 255 260 265 271 276 282
County Road Fund Operating Subsidy 1,594 1,591 1,626 1,662 1,698 1,736 1,775
County Road Fund Capital Subsidy 3,200 350 550 - - - -
CRAB Capital Ferry Funding 500 500 500
Total Revenues 6,855 3,999 4,279 3,812 4,396 4,942 5,040
Total Expenditures (2) 6,742 3,884 4,162 17,092 20,574 3,858 3,944
Net Unfunded (Funded) (5) (113) (115) (117) 13,281 16,178 (1,084) (1,097)
Lummi Island Ferry 14-Year Capital Program
All $ in 000's Revenues 2028-2034
Category 2028 2029 2030 2031 2032 2033 2034
Multi-Ride Fares (3) $ 2,032 $ 2,078 $ 2,124 $ 2,172 $ 2,222 $ 2,276 $ 2,327
Single-Ride Fares (4) 508 519 531 543 555 569 582
(Memo 55% of Operating Cost) (1) 2,540 2,597 2,656 2,716 2,777 2,845 2,909
MVFT Deficit Subsidy 287 293 299 305 311 317 323
County Road Fund Operating Subsidy 1,814 1,855 1,896 1,939 1,982 2,030 2,076
County Road Fund Capital Subsidy - - - - - - -
CRAB Capital Ferry Funding 500 500 500 500 500 500 500
Total Revenues 5,141 5,245 5,350 5,459 5,570 5,691 5,808
Total Expenditures (2) 4,031 4,121 4,214 4,308 4,405 4,511 4,612
Net Unfunded (Funded) (5) (1,110) (1,123) (1,137) (1,151) (1,165) (1,181) (1,196)
Note 1: After Subtracting the MVFT Deficit Subsidy. Budgeted for 55% fare recovery based on historical results
until the new ferry is operational. At that point a 25% increase is factored based on new size and expected
changes in ridership patterns.
Note 2: As Shown On Table 2, including capital expenditures.
Note 3: Equal to 80% of Fares
Note 4: Equal to 20% of Fares
Note 5: Unfunded ferry capital is generally covered using road fund revenue. In the case of years 2024 and 2025
grant funds are being activly sought as the road fund does not have the capacity to cover these deficits
Note 6: Assumed ridership change with operation of new boat.
-8-Table 3
Lummi Island Ferry 14-Year Capital Program
All in 000's Table 2 Expenditures 2021-2027 Page 1
Category 2021 2022 2023 2024 2025 2026 2027
Operating Expenses
Vessel Operations
Personnel 1,400 1,417 1,445 1,474 1,504 1,534 1,564
Fuel & Operating Supplies 1,039 1,031 1,062 1,094 1,126 1,149 1,183
Insurance 68 70 72 74 77 90 93
Other Operating Expenses 100 104 108 112 117 122 127
Total Vessel Operations 2,607 2,622 2,688 2,755 2,824 2,894 2,967
Other Operations
Administration 410 412 414 416 418 420 422
Parking Lots
Lummi Island 10 10 10 11 11 11 11
Gooseberry Pt. 9 9 9 10 10 10 10
Staging Areas
Lummi Island 28 29 30 31 32 32 33
Gooseberry Pt. 8 8 8 9 9 9 10
Docks
Lummi Island 69 69 70 72 73 75 76
Gooseberry Pt. 401 375 383 390 398 406 414
Total Operating Expenses 3,542 3,534 3,612 3,692 3,774 3,858 3,944
Capital Expenditures
Replacement of Whatcom Chief 300 300 500 8,400 10,000 - -
Terminal Modifications 5,000 6,800
Gooseberry Pt Terminal Preservation 800 - - - - - -
Lummi Island Breakwater Replacement 2,050 - - - - -
Relocation of Gooseberry Terminal 50 50 50
Total Capital Program Costs 3,200 350 550 13,400 16,800 - -
Total Costs 6,742 3,884 4,162 17,092 20,574 3,858 3,944
-9-Table 3 (continued)
Lummi Island Ferry 14-Year Capital Program
All in 000's Table 2 Expenditures 2028-2034 Page 2
Category 2028 2029 2030 2031 2032 2033 2034
Operating Expenses
Vessel Operations
Personnel 1,596 1,628 1,660 1,693 1,727 1,762 1,797
Fuel & Operating Supplies 1,218 1,254 1,291 1,329 1,368 1,409 1,452
Insurance 95 98 101 104 107 111 114
Other Operating Expenses 132 137 142 148 154 159 163
Total Vessel Operations 3,041 3,117 3,195 3,275 3,356 3,440 3,526
Other Operations
Administration 425 427 429 431 433 435 437
Parking Lots
Lummi Island 11 12 12 12 13 13 13
Gooseberry Pt. 10 11 11 11 12 12 12
Staging Areas
Lummi Island 34 35 37 38 39 40 41
Gooseberry Pt. 10 10 10 11 11 18 19
Docks
Lummi Island 78 79 81 82 84 86 88
Gooseberry Pt. 422 431 439 448 457 466 476
Total Operating Expenses 4,031 4,121 4,214 4,308 4,405 4,511 4,612
Capital Expenditures
Replacement of Whatcom Chief - - - - - - -
Terminal Modifications
Gooseberry Pt Terminal Preservation - - - - - - -
Lummi Island Breakwater Replacement - - - - - - -
Relocation of Gooseberry Terminal - - - - - - -
Total Capital Program Costs - - - - - - -
Total Costs 4,031 4,121 4,214 4,308 4,405 4,511 4,612
- 10 -You can also read