Bank of Åland

         Debt Investor Presentation
                 July 2020
←
→
Page content transcription
If your browser does not render page correctly, please read the page content below

Bank of Åland
Debt Investor Presentation
July 2020
Table of Contents
             1. Bank of Åland in Brief                          3

             2. Bank of Åland – Strategy and Market Position    7

             3. Bank of Åland and Sustainability               15

             4. Performance and Capital                        18

             5. Asset Quality                                  31

             6. Liquidity and Funding                          36

             7. Contact Details                                41

             8. Appendix                                       43

2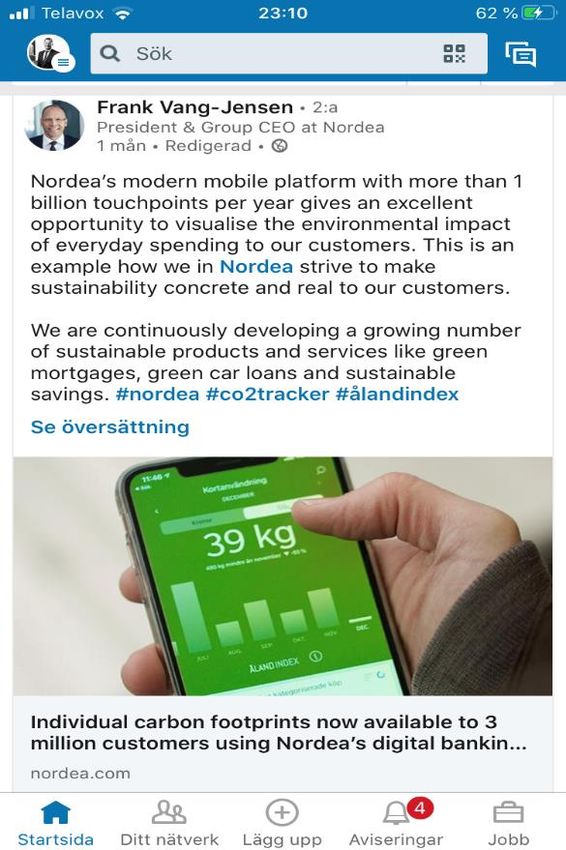
1. Bank of Åland in Brief
Bank of Åland in Brief
                     •   A Finnish bank targeting high net worth and affluent individuals
                     •   Top ranked in customer loyalty
     Bank of Åland   •   Tradition of stability and very low credit losses
         Plc         •   Net operating profit increased by 15 % to EUR 16.7 M in H1 2020 from EUR 14.5 M in H1
                         2019
                     •   BBB rating with a negative outlook from S&P

                     •   EUR 3 bn combined Medium Term Note, Covered Bond and Tier 2 Note Programme 2020
                         (Finnish law)
                     •   Two cover pools: Cover Pool FIN and Cover Pool SWE
    Covered Bond
                     •   Legal LTV cap at 70 % and minimum 2 % over-collateralization
      Program
                     •   Published commitment to a strong over-collateralization and six months liquidity
                     •   AAA (stable) rating from S&P on both Cover Pool FIN and Cover Pool SWE

                     •   The Corona has already had and will continue to have its effects on the global economy
                     •   Before Corona the demand-led Finnish economy was growing strongly
     Economy and     •   Finnish house prices have risen moderately compared to the Nordic neighbors. A trend explained by
                         the fast amortizing plans of Finnish mortgages
       Markets
                     •   Sound Bank of Åland portfolio as at least half of the lending in every business area has residential
                         mortgages or property as collateral and many small loans are preferred to few large loans

4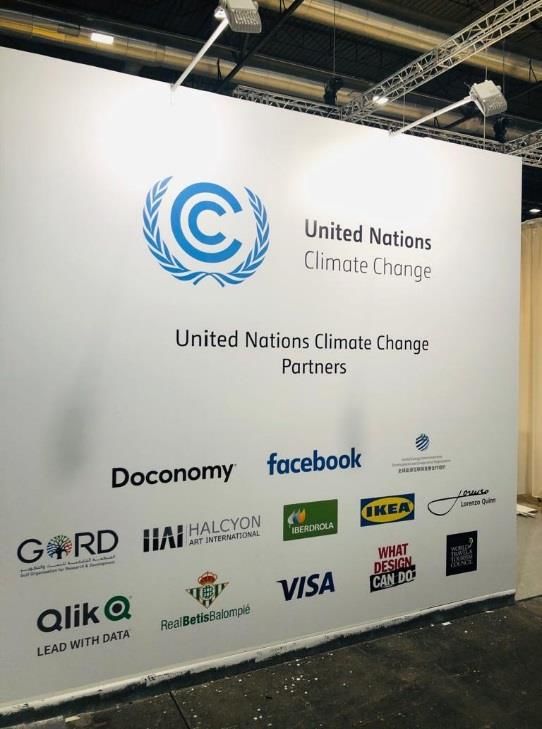
Scorecard June 30, 2020

      Capital                                             Liquidity and Funding
      • Strong capital position                           •   Core funding ratio of 95 %
      • Common Equity Tier 1 capital ratio 14.5 %         •   Liquidity reserve at 18 % of total assets
      • IRB method for credit risk capital requirement    •   LCR at 142 %
        not yet approved for the Swedish credit           •   NSFR at 114 %
        portfolio                                         •   AAA rating with a stable outlook on Covered
                                                              Bonds

      Risk Management                                     Profitability
      • Long history of having the lowest loan loss       • Challenging interest rate environment
        level of all Finnish banks. Loan loss level was   • Positive earnings trend
        0.08 % in Q2 2020 and 0.22 % in H1 2020           • Net operating profit of EUR 9.8 M in Q2 2020
      • No trading positions or complex financial           and EUR 16.7 M in H1 2020
        instruments                                       • Return on equity 11.8 % in Q2 2020 and 10.1
      • Strict limits on exposures to financial             % in H1 2020
        institutions. Bulk of the exposure is to highly
        rated Nordic entities

5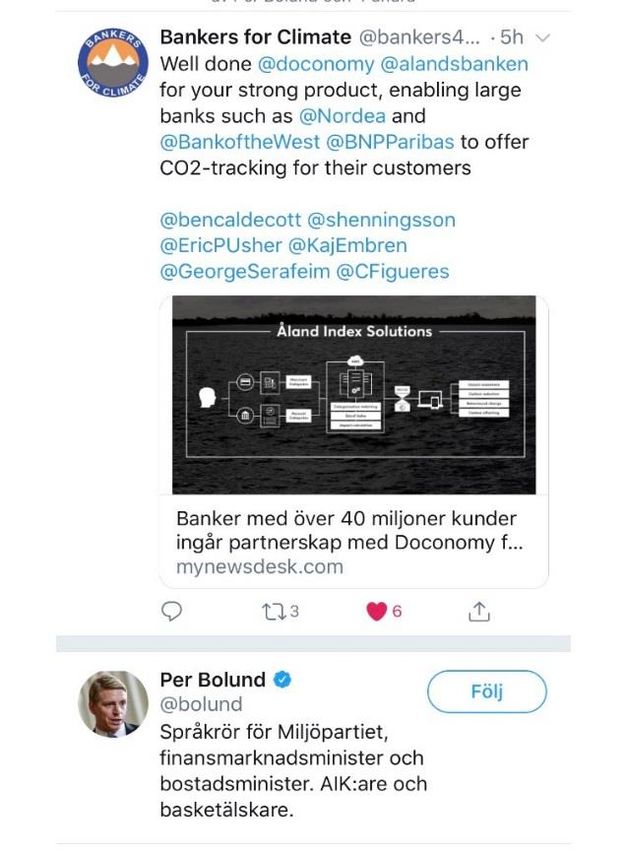
Standard & Poor’s Rating on Bank of Åland
    Finnish banks                                                                           A-

           Business position                                                                -2
                - Despite some geographic diversification, concentrated business focus on
                retail and private banking makes it vulnerable to cyclical swings in the
                segments
           Capital and earnings                                                             +1
                - Strong capital position
                - Strong earnings
           Risk position                                                                    -1
                - Small customer base with concentration risks
                - Moderate geographic diversity
           Liquidity and funding                                                             0
                - Stable core deposit base

    Bank of Åland stand alone rating                                                        BBB   negative

           Cover Pool FIN, Cover Pool SWE                                                   +9
               - Very low credit losses and stable loan base
               - Commitment to strong over-collateralization
               - Commitment to six months liquidity buffer

    Bank of Åland Covered Bonds rating                                                      AAA   stable

6
2. Bank of Åland
Strategy and Market Position
Three Markets – Two Strategies
    The Åland Islands
          • 3 offices + 2 rep offices, market share > 50 %
          • Full product range offered
          • A bank for everyone

    Finland
          • 5 offices in affluent parts of Finland, market share > 1 %
          • Full product range offered but “bread and butter” services only as
            complement to Private Banking and Premium Banking services
            offering
          • Targeted segment: High Net Worth / Affluent Individuals and
            their companies

    Sweden
          • 3 offices in Sweden's largest cities, market share < 1 %
          • Full product range offered but “bread and butter” services
            only as complement to Private Banking and Premium
            Banking services offering
          • Targeted segment: High Net Worth / Affluent Individuals
            and their companies

8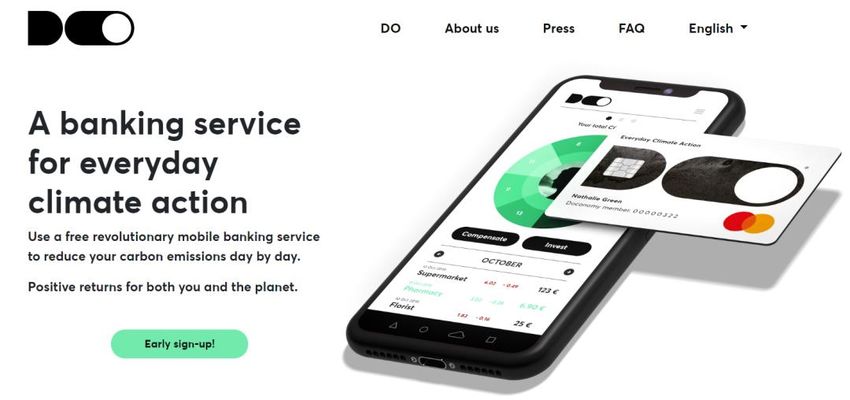
Bank of Åland – a Relationship Bank with Focus on
    Private Banking and Premium Banking Customers
                    • Established in 1919 on Åland Islands
                    • Listed since 1942 on NASDAQ OMX Helsinki

                    • Total assets of EUR 5,708 M, as of June 30, 2020
                    • Actively managed assets of EUR 6,107 M, as of June 30, 2020
                    • Approximately 744 full time employees
     An Overview
                    •   Operations in the Åland Islands, Finnish mainland and Sweden
                    •   More than 200,000 customers and top-ranked in customer loyalty
                    •   A long-standing tradition of stability and very low credit losses
                    •   At the forefront for introducing new products in Finland

                    Create value for ambitious individuals and companies that appreciate
                    relations:
      The Vision          • Private Banking since 1982
                          • Premium Banking since 2004

                    Delivering a large bank’s range of services with a small bank’s
                    thoughtfulness and good sense
     How we do it

9
Bank of Åland History of Strategic Decisions

       From a local bank...
                                                                                         2019
                                                                          2016
       Supporting development of Åland – a
       poor fishing and agrarian community
                                                              2009
                                               2004

                                    1994
                                                                                                 New
                                                                                   Fintech       Swedish
                        1942
                                                              Expansion            Dreams        mortgage
                                                              to
                                                   IT                                            bank with
                1919                               company    Sweden
                                      Expansion                                                  partners
                                      to Finnish   Crosskey
                          Listing                  Ab Ltd
                                      mainland
                    Foundation                                       ...to a Nordic banking group
                                                                     With wide product range and personal
                                                                     service targeting high net worth individuals

10
Digitalization in Focus: Strategic Fintech Partners 11
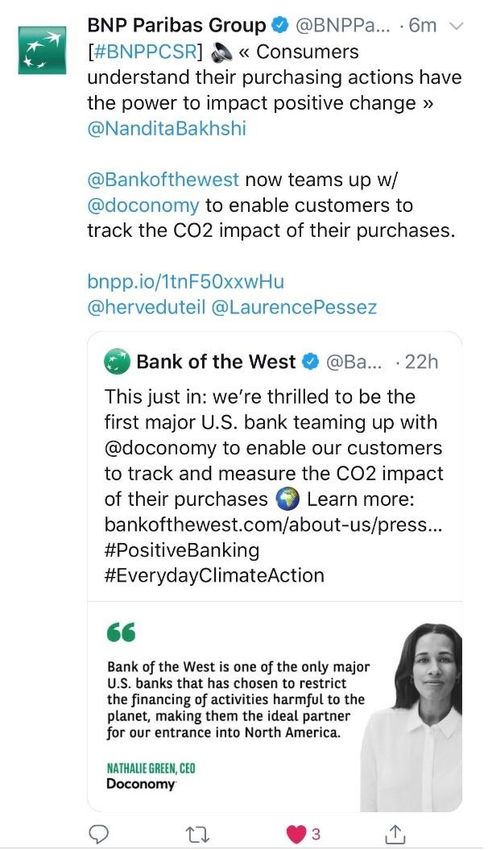
The Åland Index reaches 40 million customers globally

     • Banks with over 40 million clients team up with Doconomy, a Swedish based start-up company, to enable customers to track their CO2-
       footprint through Åland Index Solution

     • The Åland Index Solution, originally developed and implemented by The Bank of Åland, offer a proven, independent climate calculation
       and is based upon leading financial data

     • To fuel this offering and fast track a global roll out, Mastercard makes an equity investment in Doconomy

     • Co-operation with Standard & Poor´s guarantees the best data quality

     • Bank of the West, a subsidiary of BNP Paribas, is the first American Bank to become a partner with Doconomy

     • Nordea is the first bank in the Nordics to make a similar agreement

12
13
Bank of Åland Group Legal Structure and Ownership Structure

       Approximately 10,000 shareholders in total, half of them from the Åland Islands

14
3. Bank of Åland and Sustainability
Bank of Åland “World Champion” in Sustainability

16
17
4. Performance and Capital
Long-Term Financial Targets

     Return on equity after taxes (ROE) shall exceed 10 %
        • As a bank for investors, with financing know-how, the Bank of Åland has a business model that shall generate
          most earnings from operations with limited capital requirements. The Bank of Åland’s earnings will benefit from
          higher interest rates

     The Bank’s capital adequacy, primarily defined as the core tier 1 capital ratio under the Basel
     regulations, shall clearly exceed all regulatory requirements

     The payout ratio shall eventually amount to 50 %
        • This payout ratio target is subject to the condition that the capital adequacy target continues to be achieved

19
Q2 2020 Net operating profit – The best quarter ever
• Net operating profit, EUR 9.8 M (8.7 M), +12 %
• Return on equity after tax (ROE) 11.8 % (11.5 %)
• Earnings per share, EUR 0.50 (0.45), +11 %
• The common equity Tier 1 ratio increased to 14.5 per cent (13.3)
• Unchanged future outlook: Due to low visibility and high volatility in the market, until further notice the Bank of Åland
has decided to refrain from issuing any outlook for 2020
20H1 2020 in Summary
Operating profit, EUR M Volumes, EUR M
+8 %
+15 % 6,107
74.2 5,651
64.6
+5 %
4,188
+7 % 4,001
+15 % 3,459
3,225
14.5 16.7
+7 %
-0.6 -4.6
Income Expenses Loan losses Operating profit
-49.4 Actively managed Deposits Lending
-53.0 assets
H1 2019 H1 2020
H1 2019 H1 2020
21H1 2020: Higher Income
EUR M
0.2
2.4
0.3
4.7
74.2
2.8
0.3
64.6
H1 2019 FX EURSEK Net interest Net commission Net income IT income Other income H1 2020
income income from financial
items at fair
value
22H1 2020: Higher Expenses
EUR M
1.0
0.4 0.3
0.9
1.8
0.2
53.0
49.4
H1 2019 FX EURSEK Crosskey Stability fee Travel and Depreciation/ Others H1 2020
representation amortisation
23Bank of Åland Business Segments, Operating Profit
EUR M, 2018-2020
13.0
9.9
9.5
4.0
3.6
1.7 1.6
1.0
0.5 0.4
0.0
Private Banking Premium Banking IT -0.4 Others
H1 2018 H1 2019 H1 2020
24Business Volumes EUR M, 2018-2020
4,188
4,022 4,110
3,459
3,286 3,199 3,304 3,368
3,057
2,908
2,638
2,539
Discretionary & Advisory Mutual funds Deposits Lending
mandates
Dec.18 Dec.19 Jun. 20
25Bank of Åland ROE %, 2018 – 2020
12.3
11.5 11.5 11.8
11.4
10.3 10.3
8.4
7.0 7.6
Q1 2018 Q2 2018 Q3 2018 Q4 2018 Q1 2019 Q2 2019 Q3 2019 Q4 2019 Q1 2020 Q2 2020
Stability fee: EUR 2.6 M Q1 2018, EUR 2.3 M Q1 2019, EUR 2.0 M Q1 2020 and EUR 0.6 M Q2 2020
26Operating Profit, Rolling 12 Months, EUR M
35.4
34.3
33.2
31.8
29.6 29.9
29.0
27.3 27.8
26.0
23.8
Q4 2017 Q1 2018 Q2 2018 Q3 2018 Q4 2018 Q1 2019 Q2 2019 Q3 2019 Q4 2019 Q1 2020 Q2 2020
27ROE, Rolling 12 Months, %
11.0
10.9
10.7
10.5
10.0
9.9
9.8
9.4 9.4
9.1
8.2
Q4 2017 Q1 2018 Q2 2018 Q3 2018 Q4 2018 Q1 2019 Q2 2019 Q3 2019 Q4 2019 Q1 2020 Q2 2020
Stability fee: EUR 2.6 M Q1 2018, EUR 2.3 M Q1 2019, EUR 2.0 M Q1 2020 and EUR 0.6 M Q2 2020
28Commitment to a strong capital ratio
• Bank of Åland is committed to a strong capital ratio
• The bank will continue to build up its capital base, improve and diversify earnings, and uphold a sound approach
to risk
• Conservative pay-out policy is to safeguard the capital position
• The core tier 1 capital ratio for a small bank like Bank of Åland is not comparable to larger banks with IRB
methods. Standard & Poor’s rating method considers Bank of Åland to have strong risk-adjusted capitalization
15.8 16.7
15.4
14.2 2.2
12.9 13.0 2.4 2.4
1.3
0.9 1.2
12.9 13.0 13.4 14.5
12.0 11.8
2015 2016 2017 2018 2019 Q2 2020
T2 CET1
29S&P View of the Total Capital Base
• According to S&P the capital position of Bank of Aland is strong
• Strong risk-adjusted capitalization
• Low credit losses
• RAC ratio remains a rating strength to Bank of Åland
Source: Nordic Banks' Capital And Earnings Can Weather The Weakening Credit Cycle, November 14, 2019
305. Asset Quality
Lending Strategy
     • Bank of Åland is a relationship bank with primary focus on customers with investment needs in the Private
       Banking and Premium Banking segments. Serving the core customers' credit needs are part of our commitment

     • Bank of Åland is not granting credits as a standalone product to mass market clients or corporate clients

     • To have balanced growth in lending versus deposits in every business area (Åland Islands, Finland and Sweden)

     • To have residential mortgages or residential property as collateral in at least half of the lending in every business
       area

     • Many small loans are preferred to few large loans

32
Balanced Growth in the Credit Portfolio
• Total lending was EUR 4,188 M June 30, 2020
• Selective lending to high quality borrowers
• Asset quality prioritised over lending volume growth and higher returns
• Lending must always be made in consideration of safeguarding Bank of Åland’s strong
brand and market reputation
• Loan loss level 0.08 % in Q2 2020 and 0.22 % in H1 2020
33Geographical Distribution of Mortgage Lending
• Clear concentration to the wealthiest parts of Finland and Sweden
• As of June 30, 2020 approximately
• 70 % of the loan portfolio in Finland
• 30 % of the loan portfolio in Sweden
• According to the business plan growth
in the coming years will be
mainly in Sweden
Vaasa
3% Tampere
Stockholm 12 %
73 %
Gothenburg Åland Islands Helsinki
12 % 20 % 46 %
Turku
Malmö 15 %
10 %
34Stage 3 Credits 2018-2020
40 1.0
0.93
0.85
0.81 0.81 0.8
30
0.69
0.6
%
EUR M
0.57
20 0.49 0.51 0.52
0.46
0.4
10
0.2
0 0.0
Q1 2018 Q2 2018 Q3 2018 Q4 2018 Q1 2019 Q2 2019 Q3 2019 Q4 2019 Q1 2020 Q2 2020
Stage 3 credits, EUR M Share of Stage 3 credits of total lending, %
Exposures in Stage 3 fulfil the Group’s default definition, in which an exposure is regarded as in default when a payment
related to a significant amount is more than 90 days late.
357. Liquidity and Funding
Group Funding Profile June 30, 2020
     • Demand deposits and time deposits from core private customers and their companies are the main funding
       sources
     • Strong capitalization
     • Covered Bonds are the main long-term funding instrument

                     37

37
Funding Strategy
• Covered Bond programme was created in early 2012 in order to diversify funding sources and to form a reliable
and cost efficient funding channel
• EUR- and SEK- denominated Covered Bonds total amount outstanding EUR 1 079 M as of June 30, 2020
• Bank of Åland issues also preferred senior unsecured bonds to maintain a balanced funding mix
• Themes 2020-2021
• Demand conditions and the market situation favour issuance in Covered Bonds
• The balanced funding mix is maintained
• Bank of Åland has not received any MREL requirements. There are no foreseen authority or regulatory
requirements which would have effect on the funding of the bank
38Liquidity Management
• Well-diversified maturity profile
• Limited exposure to short term whole sale funding
• Bank of Åland is committed to continuously cover the next 180-day liquidity need in the cover pools for the
Covered Bonds program
Maturing long funding
39Liquidity Position
• Very high quality in liquidity reserves • Conservative approach to market risk within liquidity reserves
• The most liquid and tradable assets • Assets with short duration
• LCR target reached • Well diversified counterparty risk profile
• LCR 142 % as of June 30, 2020
• Coordinated cash pools between Finland and Sweden • NSFR 114 % as of June 30, 2020
Composition of the liquidity reserve
408. Contact Details
Contact Details

     Peter Wiklöf, CEO
     peter.wiklof@alandsbanken.fi
     +358 40 512 7505

     Jan-Gunnar Eurell, CFO
     jan-gunnar.eurell@alandsbanken.se
     +46 70 589 1209

     Maria Rissanen, Head of Group Treasury
     maria.rissanen@alandsbanken.fi
     +358 50 538 8898

42
9. Appendix
Key Figures – Bank of Åland

44
Income Statement

45
Long-Term Funding June 30, 2020

46
Cover Pool FIN

47
Cover Pool SWE

48
Disclaimer
     • The presentation was prepared by Bank of Åland Ltd for use in investor relations. This presentation is not
       intended for retail customers.
     • This presentation has been prepared on the basis of publicly available information which Bank of Åland
       considers to be reliable.
     • This presentation may contain forward-looking statements, which are subject to risks, uncertainties, and
       assumptions. This presentation is being presented solely for your information and is subject to change without
       notice. No representation or warranty, expressed or implied, is made and no reliance should be placed on the
       accuracy, actuality, fairness, or completeness of the information presented.
     • This presentation does not constitute an offer or invitation to purchase or subscribe for any shares or debt
       instruments of the Company, and no part of this presentation shall form the basis of or be relied upon in
       connection with any contract or commitment.
     • The contents of this presentation may not be reproduced, redistributed or passed on, directly or indirectly, to any
       other person or published, in whole or in part, for any purpose.

49
You can also read