JD.com, Inc. Financial and Operational Highlights November 2020 - Wertpapier Forum

Page created by Freddie Norton
 
CONTINUE READING
JD.com, Inc. Financial and Operational Highlights November 2020 - Wertpapier Forum
JD.com, Inc.
    Financial and Operational Highlights
                              November 2020

0
JD.com, Inc. Financial and Operational Highlights November 2020 - Wertpapier Forum
Disclaimer
    The following presentation has been prepared by JD.com, Inc. (“JD” or the “Company”) solely for informational purposes and should not be construed to be, directly or indirectly, in whole
    or in part, an offer to buy or sell and/or an invitation and/or a recommendation and/or a solicitation of an offer to buy or sell any security or instrument or to participate in any investment
    or trading strategy, nor shall any part of it form the basis of, or be relied on in connection with, any contract or investment decision in relation to any securities or otherwise.

    This presentation does not contain all relevant information relating to the Company or its securities, particularly with respect to the risks and special considerations involved with an
    investment in the securities of the Company. Nothing contained in this document shall be relied upon as a promise or representation as to the past or future performance of the Company.
    Past performance does not guarantee or predict future performance.

    You acknowledge that any assessment of the Company that may be made by you will be independent of this document and that you will be solely responsible for your own assessment of
    the market and the market position of the Company and that you will conduct your own analysis and be solely responsible for forming your own view of the potential future performance
    of the business of the Company.

    This document contains certain statements that constitute forward-looking statements within the meaning of Section 27A of the Securities Act of 1953, as amended, and Section 21E of the
    Securities Exchange Act of 1934, as amended, with respect to the Company’s future financial or business performance, strategies or expectations. These statements typically contain words
    such as "expects" and "anticipates" and words of similar import. Any statement in this document that is not a statement of historical fact is a forward-looking statement and involves
    known and unknown risks, uncertainties and other factors which may cause the Company's actual results, performance or achievements to be materially different from any future results,
    performances or achievements expressed or implied by such forward-looking statements. There can be no assurance that the results and events contemplated by the forward looking
    statements contained herein will in fact occur. None of the future projections, expectations, estimates or prospects in this document should be taken as forecasts or promises nor should
    they be taken as implying any indication, assurance or guarantee that the assumptions on which such future projections, expectations, estimates or prospects have been prepared are
    correct or exhaustive or, in the case of assumptions, fully stated in the document. The Company also cautions that forward-looking statements are subject to numerous assumptions, risks
    and uncertainties, which change over time and which may be beyond the Company’s control. The Company assumes no duty to and does not undertake to update any forward-looking
    statements to reflect actual results, changes in assumptions or changes in factors affecting these statements.

    This document also contains non-GAAP financial measures, the presentation of which is not intended to be considered in isolation or as a substitute for the financial information prepared
    and presented in accordance with accounting principles generally accepted in the United States of America. In addition, the Company’s calculation of these non-GAAP financial measures
    may be different from the calculation used by other companies, and therefore comparability may be limited. The reconciliation of those measures to the most comparable GAAP measures
    is contained within this document or available at our website http://ir.jd.com.

    This document speaks as of September 30, 2020. Neither the delivery of this document nor any further discussions of the Company with any of the recipients shall, under any
    circumstances, create any implication that there has been no change in the affairs of the Company since that date.

1
Fragmented Retail Market & Rapid Shift to Online

            Robust Growth                                          … Yet Highly                                … With Increasing                                … Leading to Significant
           in China Retail …                                      Fragmented ...                              Online Penetration ...                                Online Growth
                China Total Retail                             Top 20 Retailers’                                      China Online Retail                                 China Online Retail
                 Market Size (1)                        Market Concentration in 2019 (2)                                Penetration (3)                                     Market Size (4)
                  (RMB Trillions)                                                                                                                                             (RMB Trillions)
                                                                         China
9.8%                                                                                                                                                                                  10%
2012 –19 CAGR
                                                                                                                                                                                      2020 –23E
                                                                                           18%                                                     22.8%                              CAGR
                                                                                                                                     20.7%
          China                            43
          US                     41
                                                                                                                             18.4%                                                                    15.1

                                                                                                                      15.0%
                                                                                                                                                               32%
                  30                                                                                                                                           2012 –20E              11.3
                                                                            US                                12.6%                                            CAGR
          21                                                                                           10.8%

                                                                                         48%
                                                                                                            6.2%                                                      1.2

                                                                                                        2012 2015 2016 2017 2018 2019 Q3                             2012A           2020E           2023E
               2012                  2019
                                                                                                                                     2020

    (1)    Source: National Bureau of Statistics of China, and U.S. Census Bureau. Total retail consumption includes food services. US consumption is translated into RMB using the year-end foreign exchange
           rates, which were 6.2301 for 2012, and 6.9618 for 2019, respectively.
    (2)    Source: Euromonitor 2019. Concentration for China retail market excludes pure platform operators.
    (3)    Source: National Bureau of Statistics of China. Online retail penetration is calculated as online physical goods consumption divided by total retail consumption.
2   (4)    Source: iResearch, 2019. Market size in terms of GMV.
Larger Growth Potential and Smaller Competitors
(vs. US Market)
           Top 10 Listed Retailers in China (1)                                                                               Top 10 Listed Retailers in US (2)

                                                                                      CAGR                                                                                                           CAGR
(Net Revenue in US$ bn)                                                             2016-2019                (Net Retail Sales in US$ bn)                                                          2016-2019

                                                   82.9                                   31%                                                                                           399.8               3%

                                      38.7                                                22%                                                              170.8                                          29%

                                 13.7                                                     (2)%                                                        111.8                                                  9%

                                 13.4                                                      18%                                                       104.5                                                   8%

                                 12.2                                                      20%                                                      101.9                                                    0%

 Alibaba New                                                                                                                                        101.3                                                    5%
Retail Initiatives
                                 10.7                                                         -

                                8.5                                                       (8)%                                                     86.6                                                      2%

                                7.2                                                         2%                                                   77.1                                                        4%

                                7.1                                                        12%                                                   72.1                                                        4%

                                5.0                                                         1%                                              40.1                                                             3%

           Market leadership and operating efficiency allow everyday low price and tremendous margin
          potential, driven by economies of scale in procurement and cost advantage as an online retailer.
    (1)   Source: company filings. Based on total net revenues for top 10 listed Chinese retailers in FY2019, Alibaba New Retail Initiatives primarily include Intime, Tmall Imports and Hema. The conversion of
          RMB into US$ is based on the year-end exchange rate which was 6.9618. The CAGR growth rates were calculated based on revenues in RMB.
    (2)   Source: company filings. Based on retail sales in the United States segments of top 10 listed US retailers, for fiscal year ended Jan 31, 2020 for Walmart and Lowe’s, Dec 31, 2019 for Amazon and CVS
3         Caremark, Sept 1, 2019 for Costco, Aug 31, 2019 for Walgreens, Feb 1, 2020 for Kroger, best buy and Target, and Feb 2, 2020 for Home Depot.
Financial and Operational Highlights

4
Strong Growth Momentum
                               Net Revenues                                                                 Net Revenues Breakdown
                                   (RMB Billions)                                                                         (RMB Billions)
                                                                                   32%
      34%
      2015 – 2019 CAGR                                                             50%                                                      510.7
                                                    576.9
                                                                   YoY 29%       2015 – 2019 CAGR                            416.1                                 YoY 27%
                                       462.0
                                                                                                                331.8                                              YoY 43%
                           362.3
                                                                                                 237.9
                258.3
                                                                        174.2     167.9                                                                                 151.4
       181.0                                                134.8                                                                                        118.9
                                                                                                                                   45.9           66.2
                                                                                          13.1           20.3       30.5                                         16.0        22.8

       2015     2016       2017        2018         2019    2019Q3     2020Q3       2015            2016          2017          2018          2019        2019Q3         2020Q3
                                                                                                 Net Product Revenues                       Net Service Revenues

                  Net Product Revenues Breakdown                                                         Net Service Revenues Breakdown
                                   (RMB Billions)                                                                          (RMB Billions)
     53%                                                                          77%

     25%                                            510.7
                                                                                  41%
                                                                     YoY 35%                                                                                        YoY 73%
    2015 – 2019 CAGR                                                             2015 – 2019 CAGR
                                       416.1                                                                                                    66.2
                                                                     YoY 23%                                                                                        YoY 24%
                           331.8
                                                                                                                                 45.9
                237.9
                                                                         151.4                                     30.5
      167.9                                                                                                                                                                  22.8
                                                             118.9                                   20.3                                                    16.0
                                                                                     13.1

      2015      2016       2017        2018         2019    2019Q3      2020Q3       2015           2016           2017          2018           2019       2019Q3         2020Q3
                         General Merchandise Revenues                                        Marketplace and Advertising Services             Logistics and Other Services
                         Electronics and Home Appliance Revenues
5
Profitability Improving With Scale
                            GAAP Gross Profit / Fulfilled Gross Profit
                                                        (RMB Billions)

                                                                                            14.9%            15.4%
                                                          14.3%            14.6%
                            13.7%           14.0%
140.0

                                                                                        8.4%
                                                                                                                                                    Drivers of Fulfilled Gross Margin (FGM)
120.0     12.2%                                                            8.2%                                      8.7%
                                            6.9%           7.3%
100.0

              5.4%
                             6.5%                                        84.4                                                        10.0%  +    Increasing economies of scale from 1P business
 80.0
                                                         66.0
 60.0

                         35.4
                                         50.8
                                                                33.9
                                                                                47.5                                                        +     Fast growth from advertising service business
 40.0
                                                24.9                                                         26.8
        22.1                                                                              20.1                      15.2
                                16.8                                                             11.4
                9.7
                                                                                                                                            +
 20.0

                                                                                                                                                       Improved logistics scale economies
  0.0                                                                                                                                0.0%
              2015          2016            2017           2018            2019            2019Q3            2020Q3
                                Gross Profit                                    Fulfilled Gross Profit
                                                                                                       (2)
                                Gross Margin                                    Fulfilled Gross Margin

                             Segment Operating Profit and Margins
 16.0
                                                       (RMB Billions)
                                                                                                                            30.0%

                                                                                                                                                                Drivers of Margins
 11.0
                                                                                                               3.9%
                                                                                              3.3%                                           +
                                                                                                                            20.0%

                                                           1.6%             2.5%                                                                       Increasing JD Retail operating leverage
  6.0                                                                                                                 3.2%
                                            1.4%
                            0.9%
                                                                                                                            10.0%

  1.0
              0.2%
                                            1.4%                            1.9%
                                                                                              2.3%
                                                                                                                            0.0%
                                                                                                                                             +     Reduced losses of third-party logistics service
                            0.8%                            0.7%
 -4.0
              0.1%
                                                                                                                            -10.0%
                                                                                                                                             +        Stabilized Investments in new initiatives

 -9.0                                                                                                                       -20.0%

              2015          2016            2017            2018            2019            2019Q3            2020Q3
                Operating income/(loss) of JD Retail                      Operating income/(loss) of New Businesses (3)
                Operating Margin of JD Retail                             Operating Margin of New Businesses
                Non-GAAP Net Margin (1)

        (1)    Refer to the company’s quarterly results for Non-GAAP adjustment.
        (2)    Fulfilled gross profit is defined as gross profit minus fulfillment expenses.
6       (3)    New businesses include technology initiatives, overseas business, logistics services and asset management services provided to third parties, exclude sale of development properties.
Robust Cash Flow Generation
                         Adjusted Operating Cash Flow (1)                                                                                    Free Cash Flow (1)
                                             (RMB Billions)                                                                                         (RMB Billions)
                                                                                      36.9

                                           29.1                                                                                                                                                 30.2

                                                                                                                                                                                 19.5
                                                                      20.5                                                                       17.7
                            17.7                                                                                                  13.5
          12.4                                            13.5                                                    7.1
                                                                                                                                                                 (7.9)

                                                                                                                 2015            2016            2017            2018           2019            TTM
          2015             2016            2017           2018        2019           TTM
                                                                                                                                                                                               2020Q3
                                                                                    2020Q3

                                   Capital Expenditures (1)
                                            (RMB Billions)

                                                                                                                                         Free Cash Flow Characteristics
                                                          21.4

                                                                                                              Negative working capital results in operating cash flow greater
                                           11.4
                                                                                                       +      than net profit
                                                                                       6.7                    Development properties as a long-term cash flow positive
          5.3
                            4.2                                        1.1
                                                                                                       +      business
                                                                       (2.4)                                  Free cash flow for 2018 has been negatively impacted by higher
      2015                 2016           2017            2018        2019            TTM                     than usual Capex of RMB21.4bn, among which, nearly RMB8.9
                Capital expenditures for development properties,
                                                                                     2020Q3
                                                                               Other Capex
                                                                                                       -      bn is related to development properties available for sale. In
                net of related sales proceeds                                                                 addition, Free cash flow for 2018 has been negatively impacted
                Total Capex                                                                                   by a one-off decrease, see footnote (2)
    (1)    Refer to quarterly earnings for more details.
    (2)    The company has been conducting a complex settlement process change since the second half of 2017 to settle the marketplace transactions directly through third party payment companies, as
           required by the regulators. As a result, there was a negative impact to Adjusted Operating Cash Flow and Free Cash Flow, due to the decrease in advance from customers for their marketplace
7          purchases and payable to merchants.
Unaudited Selected Financial Data

          Unaudited Selected Financial Data of
               Continuing Operations (1)                           3Q2019                   4Q2019                   1Q2020                   2Q2020                   3Q2020
                 (in RMB Thousands)

      Net revenues                                                   134,842,785              170,684,038              146,205,209              201,054,058             174,214,464

      Non-GAAP Operating expenses

      Cost of revenues                                             (114,705,006)            (146,661,279)            (123,648,839)            (172,404,933)           (147,388,326)

      Fulfillment                                                     (8,590,896)             (10,817,300)             (10,226,479)            (11,843,536)             (11,386,816)

      Marketing                                                       (4,236,536)              (8,006,601)              (4,252,295)              (6,603,027)             (5,185,533)

      Research and development                                        (3,188,751)              (3,190,146)              (3,549,860)              (3,388,773)             (3,697,639)

      General and administrative                                        (828,326)                 (978,335)               (948,871)              (1,035,154)             (1,123,766)

      Non-GAAP Income from
                                                                        2,974,945                   704,016               3,255,883                5,593,590               5,273,886
      operations (2)

      Non-GAAP net income attributable
                                                                        3,085,885                   810,722               2,972,206                5,911,148               5,558,054
      to ordinary shareholders (2)

      Non-GAAP operating margin (2)                                           2.2%                     0.4%                     2.2%                    2.8%                     3.0%

      GAAP operating margin                                                   3.7%                     0.3%                     1.6%                    2.5%                     2.5%

      Non-GAAP net margin (2)                                                 2.3%                     0.5%                     2.0%                    2.9%                     3.2%

      GAAP net margin                                                         0.5%                     2.1%                     0.7%                    8.2%                     4.3%

    (1)    All periods are presented to reflect the results of continuing operations after JD Digits (formerly known as JD Finance) deconsolidation and JD Logistics cost reclassification.
    (2)    Non-GAAP adjustment items include share-based compensation, amortization of intangible assets resulting from assets and business acquisitions, effects of business cooperation arrangements
           and non-compete agreements, gain/(loss) on disposals/deemed disposals of investments, reconciling items on the share of equity method investments, loss/(gain) from fair value change of long-
           term investments, impairment of goodwill, intangible assets and investments, gain and foreign exchange impact in relation to sale of development properties and tax effects on non-GAAP
8          adjustments.
Supplemental Financial Information and Business
    Metrics

                         Supplemental Information                                         3Q2019                 4Q2019                 1Q2020                 2Q2020                 3Q2020

          Annual active customer accounts
                                                                                                 334.4                  362.0                  387.4                  417.4                  441.6
          (in millions)

          Inventory turnover days (1) – TTM                                                        35.1                   35.8                   35.4                   34.8                   34.3

          Accounts payable turnover days (1) – TTM                                                 56.6                   54.5                   51.7                   50.8                   49.2

          Accounts receivable turnover days (1) – TTM                                                3.2                    3.2                    3.1                    2.9                    2.8

          Free Cash Flow (2) – TTM
                                                                                                   15.6                   19.5                   15.2                   22.7                   30.2
          (RMB billions)

    (1)   Refer to public disclosures for definitions of turnover days.
    (2)   Free cash flow is defined as operating cash flow adding back or subtracting the impact JD Digits related credit products included in the operating cash flow, and less capital expenditures, net of
          proceeds from disposals of long-lived assets. As required by the new accounting standard adopted on January 1, 2018, the consolidated statements of cash flows were retrospectively adjusted to
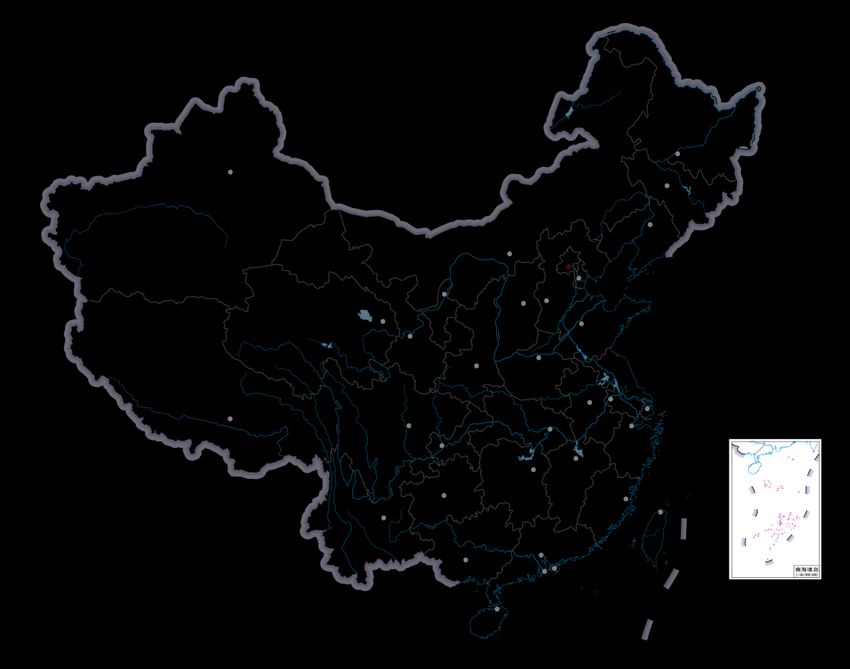
9         include restricted cash in cash and cash equivalents when reconciling the beginning-of-period and end-of-period total amounts shown on the statement of cash flows.
Superior Services through Nationwide Logistics Network

                      Nationwide Warehouse                                                                                                 Rapid Expansion & Best-in-Class
                      Network & Last-mile Reach                                                                                                Fulfillment Capabilities

                                                                                                                                            Fulfilment
                                                                                                                                            Centers                     7 cities
                                                                                                          Harbin
                     Urumuqi                                                             Changchun                                          Front
                                                                                        Shenyang
                                                                                                                                            Distribution               31 cities
                                                                  Hohhot              Beijing
                                                                                                          Jinzhou
                                                                                                          Dalian
                                                                                                                                            Centers
                                                                                                  Tangshan
                                                                                             Tianjin
                                                     Yinchuan                 ShijiazhuangJining      Qingdao

                    Lhasa                               Lanzhou
                                                                       Taiyuan       Handan

                                                                      Zhengzhou Suqian
                                                                                                   Weifang
                                                                                               Jinan
                                                                                                                       National Customer
                                                                                                                         Service Center
                                                                                                                                            Warehouses            800+ warehouses
                                                                              Zhumadian
                                                                      Luoyang        Zhenjiang
                                                         Baoji    Xi’an          Hefei                       Nantong
                                                                           Hebi               Wuxi
                                               Chengdu         Xiangyang Jingzhou                             Shanghai
                                                            Mianyang
                                            Dazhou                    Wuhan
                                                                 Changde
                                                                                         Hangzhou            Ningbo

                      Customer Service        Nanchong
                                                        Zigong     Changsha
                                                           Chongqing
                                                                                       Ezhou

                                                                                     Nanchang
                                                                                                       Jinhua
                                                                                                          Wenzhou
                                                                                                                                            GFA(2)                ~ 20 million sq.m.
                           Center                                              Hengyang                Fuzhou
                                                                    Guiyang
                                                                                                     Xiamen
                                                             Liuzhou
                                                                                 Guangzhou
                                                                                                Shantou
                                         Kunming
                                                                                                                                            Self-built Mega
                                                                                                                                                               28 projects in 18 cities
                                                                        Foshan           Huizhou Jieyang
                                                         Nanning
                                                                       Zhongshan
                                                                                   Maoming                                                  Warehouses
                                                                       Haikou

          Cities with fulfillment centers (7)                                                                                               Geographic               Almost all
          Cities with front distribution centers (31)                                                                                       Coverage          counties & districts in China
          Cities with bulky item warehouses (70)
          Cities with new front distribution centers built after IPO (23)

                                                                         Provide best-in-class customer experience
    (1)    Map and data as of Sep 30, 2020.
10 (2) Including floor area managed under JDL Open Warehouse Platform.
11
You can also read