JUMBO INTERACTIVE LIMITED RESULTS PRESENTATION - For the half year ended 31 December 2019 - HotCopper
←
→
Page content transcription
If your browser does not render page correctly, please read the page content below
JUMBO INTERACTIVE LIMITED RESULTS
PRESENTATION
For the half year ended 31 December 2019

ABN 66 009 189 128

CONTENTS

RESULTS HIGHLIGHTS                2

SOFTWARE AS A SERVICE             6

JUMBO LONG TERM GROWTH PROFILE    8

FINANCIAL PERFORMANCE            10

DIVIDENDS OVERVIEW               12

FINANCIAL POSITION               13

CASH FLOW                        14

VISION & STRATEGY                15

OUTLOOK                          18
                                      H1 FY20 Results Presentation | 1
RESULTS HIGHLIGHTS
CUSTOMERS CLEARLY LOVE PLAYING ON JUMBO                              LEADING TO STRONG FINANCIAL RESULTS

   ▪ 848,621 Active Customers up 118% over 2 years (+47% pcp)         ▪ TTV up 25.3% prior comparitive period (pcp) to $185.3 million
   ▪ 16.9% Customer Dormancy Rate reduced 42% over 2 years               – 26.7% (21.5% pcp) of all lottery sales in Australia are
   ▪ New proprietary software platform effective in engaging               now sold online.
     customers to play more frequently.                               ▪ Revenue up 23.1% pcp to $37.6 million
   ▪ If Jackpots decline, engaging with existing customers will be
                                                                      ▪ Net Profit after tax (NPAT) up 14% pcp to $14.4 million
     key.
                                                                      ▪ EBITDA up 17% pcp to $22.9 million

                                                                        Continuing        HY DEC 19        HY DEC 18        HY DEC 17
                                                                        Operations            Actual          Actual           Actual

                                                                           TTV             $185.3 mil       $147.8 mil       $89.1 mil

                                                                         Revenue           $37.6 mil         $30.5 mil       $19.3 mil

                                                                          NPAT             $14.4 mil         $12.7 mil        $5.3 mil

                                                                                                             H1 FY20 Results Presentation | 2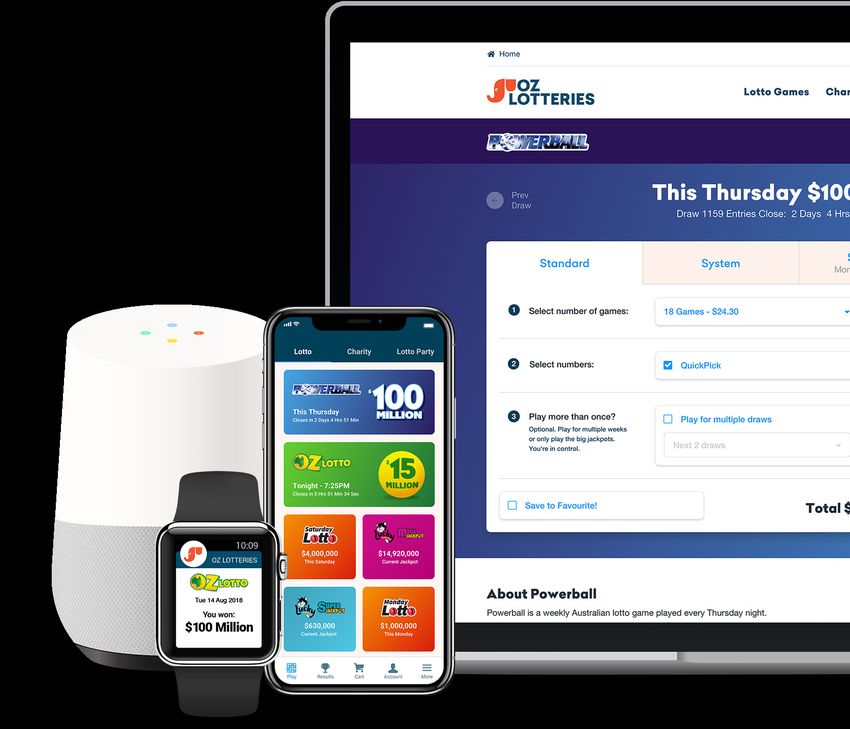
RESULTS HIGHLIGHTS (CONTINUED)
CUSTOMER ENGAGEMENT AND LOYALTY                                      DRIVEN BY INNOVATION

   ▪ Further innovations to enhance engagement and loyalty          ▪ Lotto Party
      – Artificial Intelligence (AI) and Machine Learning (ML) to      – Friends play socially as a group
        improve personalisation and relevance to individual            – Collects funds and lodges tickets without leaving the app
        customers.
                                                                    ▪ Super Combos and Public Syndicates (Group Play)
   ▪ Younger Demographics                                              – Advanced game types proving to be popular
      – Attracted to innovation                                        – Advanced number pickers
      – Start slow but build up over time
                                                                    ▪ Charity Games
      – Future of the Lottery Industry
                                                                       – Popular when Jackpots low

                                                                                                              H1 FY20 Results Presentation | 3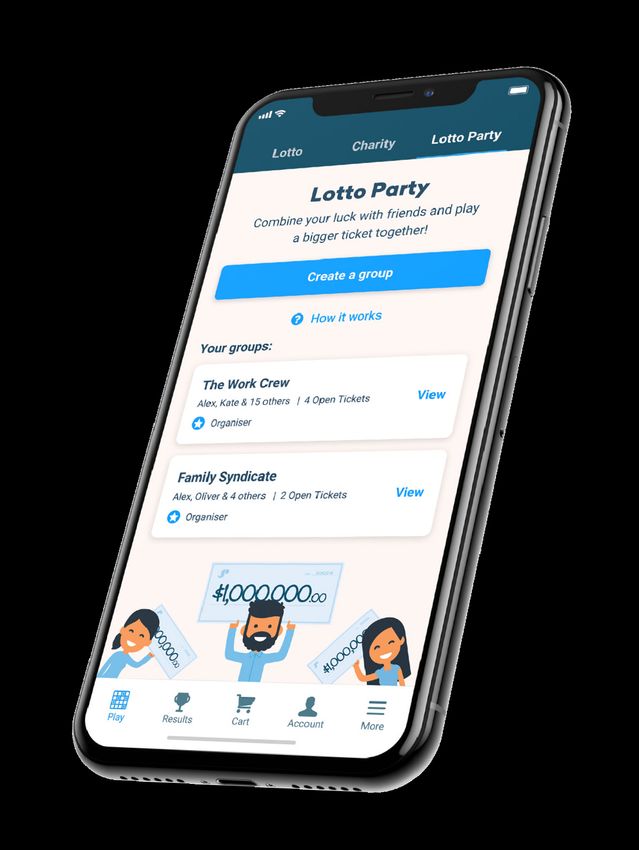
RESULTS HIGHLIGHTS (CONTINUED)
ONLINE LOTTERIES - A GROWINGMARKET
          ▪ 26.7% of Australian lottery tickets now sold online1
             – 5 year CAGR 22% to FY2019
             – 5 year CAGR 29.6% to FY2019 of Jumbo flagship
                website ozlotteries.com (lottery and charity games)
          ▪ The only pure digital play listed lottery company in
            Australia.

1   Source: Tabcorp Holdings Limited / Tatts Group Limited public filings

                                                                            H1 FY20 Results Presentation | 4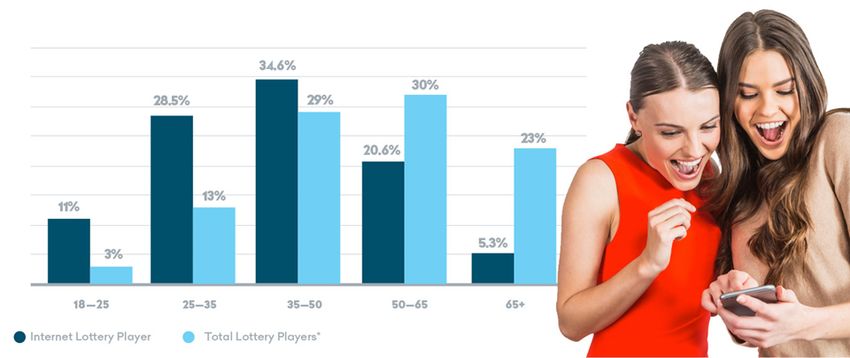
RESULTS HIGHLIGHTS (CONTINUED)
GOOD RUN OF LARGE JACKPOTS
  ▪ 23 large jackpots (Oz Lotto/Powerball at or above $15 million) vs. 23 in pcp:
     – Aggregate value of large jackpots - $1,070 million vs. $860 million
     – Average value per large jackpot - $46.5 million vs. $37.4 million
  ▪ 8 Jackpots at or above $50 million vs 6 in pcp:
     – Three Powerball jackpots at or above $100 million in the period

                                                                     49
                           45

                                                                                    H1 FY20 Results Presentation | 5
SOFTWARE AS A SERVICE (SaaS) “POWERED BY JUMBO”
        ▪ Large Global TAM
           – US$303 billion Total Addressable Market 1
           – Only 7% is online
             – “Powered by Jumbo” is a complete solution for lotteries seeking
               to move online

        ▪ Initial target - Charity lotteries
            – Smaller charity lotteries looking to improve their online offering
             – A$3.5 billion initial TAM in Australia, UK & Canada 2
        ▪ Mater Lotteries
           – Agreement signed November 2018, Stage 1 live in June 2019
           – Complete onboarding scheduled for June 2020
        ▪ Endeavour Foundation
           – Agreement signed August 2019 (5+5 year SaaS agreement)
        ▪ Deaf Lottery
           – Signed 5 December 2019 (5+5 year SaaS agreement)

1
    Sources: The WLA Global Lottery Data Compendium 2018; Jumbo Research;
2   Sources: Jumbo Research; lotteriescouncil.org.uk; charityintelligence.ca
                                                                                   H1 FY20 Results Presentation | 6
SOFTWARE AS A SERVICE (SaaS) “POWERED BY JUMBO” (CONTINUED)
▪ New POS (Point of Sale) Solution
– Provides portable and desktop digital sales capability
– Tablet based with wireless payments device
1
Sources: The WLA Global Lottery Data Compendium 2018; Jumbo Research;
2 Sources: Jumbo Research; lotteriescouncil.org.uk; charityintelligence.ca
H1 FY20 Results Presentation | 7LONG TERM GROWTH PROFILE
TOTAL TRANSACTION VALUE (TTV) REVENUE
5 year CAGR FY2019 - 24.6% 5 year CAGR FY2019 - 21.3%
NET PROFIT AFTER TAX - CONTINUING OPERATIONS EBITDA MARGIN - CONTINUING OPERATIONS
5 year CAGR FY 2019 - 43.3%
H1 FY20 Results Presentation | 8FINANCIAL PERFORMANCE (CONTINUED) – LIKE-FOR-LIKE ANALYSIS
• Removes the influence of jackpot size
• Compares sales over time at fixed jackpot levels
• Indicates customer engagement and loyalty
• Indicates resilience in years of low jackpots
Ticket sales per draw ($)
Ticket sales per draw ($)
H1FY18 H1FY19 H1FY20 H2FY18 H1FY19 H2FY19 H1FY20
Oz Lotto $15 million draw sales Powerball $20 million draw sales
H1 FY20 Results Presentation | 9FINANCIAL PERFORMANCE
KEY ITEMS:
H1 FY20 H1 FY19 Change
▪ TTV up 25.3%
$’000 $’000 %
▪ Revenue up 23.1%
Total Transaction Value 185,303 147,849 25.3% ▪ Total expenses up by 36.7% mainly
associated directly with increased TTV and
Revenue from continuing operations 37,554 30,510 23.1% revenue; Gatherwell acquisition $412,000
Cost of goods sold (1,014) (1,031) (1.6%) and step change expenses estimated at
Gross Profit 36,540 29,479 24.0% ~$1,150,000
Other income 797 887 (10.1)% ▪ EBITDA margin 60.9% (63.9% pcp –
Distribution expenses (16) (11) 45.5% adjusted for AASB 16 Lease changes) -
Marketing expenses (3,441) (2,938) 17.1% 65.1% adjusted for one-off and step change
estimated expenses
Occupancy expenses (61) (372) (83.6%)
Administrative expenses (12,995) (8,840) 47.0% ▪ NPBT up 13.8% (22.4% adjusted for one-
off and step change estimated expenses)
Finance costs (110) (3) 3,566.7%
Total expenses (16,623) (12,164) 36.7% ▪ NPAT up 13.8% (22.4% adjusted for one-
off and step change estimated expenses)
Net Profit before Tax 20,714 18,202 13.8% ▪ Effective Tax rate - 30.5% (1H FY19:
30.5%)
Income tax expense (6,319) (5,551) 13.8% ▪ EPS up 7.9% (15.9% adjusted for one-off
and step change estimated expenses)
Net Profit after Tax 14,395 12,651 13.8%
Basic earnings per share (cents) 23.1 21.4 7.9%
Diluted earnings per share (cents) 23.0 20.7 11.1%
H1 FY20 Results Presentation | 10FINANCIAL PERFORMANCE
UNDERLYING PERFORMANCE:
▪ One-off expenses
– $412,000 Gatherwell acquisition expenses
▪ Step change expenses
– Strategic decision made to support the increase in scale of business and expected growth over next three to five years
– $1,150,000 estimated circa step change expenses
– Impact in the short term with expected medium to long term benefits with growth
▪ EBITDA margin
– EBITDA $22,871,000 – 60.9%
– Underlying EBITDA $24,483,000 – 65.1%
H1 FY20 Results Presentation | 11DIVIDEND OVERVIEW
EXCEPTIONAL SHAREHOLDER RETURN FROM A GROWTH COMPANY
▪ Strong cash generative nature of operations supports ▪ 80.7% payout ratio - Targeted dividend policy of 85% of NPAT
dividend policy for the full year is retained
▪ Interim fully franked dividend: ▪ $8.3 million franking credit balance after interim dividend payment
– 18.5 cents per share
– Record date 6 March 2020
– Payment date 20 March 2020
Ordinary dividends
Special dividends
H1 FY20 Results Presentation | 12FINANCIAL POSITION
at 31 Dec at 30 Jun Change KEY ITEMS:
2019 2019 CASH
$’000 $’000 % ▪ Strong cash position of $71.2 million
– General funds down 19.5% to $59.4
ASSETS 108,014 101,622 6.3% million with funding of $9.5 million
Current Assets 74,467 85,536 (12.9%) Gatherwell acquisition from cash reserves
Intangible Assets 31,845 14,683 116.9% – Customer funds up 9.3% to $11.8million
Property, Plant & Equipment 526 451 16.6% ▪ Growth delivered without the requirementfor
debt in the business
Other Non-Current Assets 996 992 0.4%
CAPITAL
LIABILITIES 28,665 24,284 18.0%
▪ Capex of $3.3 million ($2.5million pcp)
Current Liabilities 21,785 23,666 (7.9%)
– FY20 capex estimated at $6.5 millionto
Non-Current Liabilities 6,880 618 1,013.3% $7.0 million due to expanding SaaSbusiness
TOTAL EQUITY 79,439 77,378 2.7%
EQUITY
▪ Contributed equity up 1.0%
– Exercise of 300,000 options byKMP/staff
($0.8 million)
H1 FY20 Results Presentation | 13CASH FLOW
at 31 Dec at 31 Dec Change KEY ITEMS:
2019 2018
$’000 $’000 % ▪ Strong cash position of $71.2 million
CASH FLOWS FROM OPERATING ACTIVITIES
($59.4 million general funds)
Receipts from customers 39,649 33,363 18.8% ▪ Payments for intangibles relate to
Payments to suppliers & employees (21,485) (6,787) 216.6% website developments costs (generated
Net income tax paid (6,873) (5,190) 32.4% internally)
Net interest received 578 686 (15.7%) ▪ Acquisition of Gatherwell $9.5 million
funded from cash reserves
Net cash provided by operating activities 11,869 22,072 (46.2%)
CASH FLOWS FROM INVESTING ACTIVITIES
Payments for Property, Plant & Equipment (167) (200) (16.5%)
Payments for intangible assets (3,104) (2,344) 32.4%
Payments for investments, net of cash acquired (4,996) - >100.0%
Payment for deposit for contingent consideration (3,789) - >100.0%
Net cash used in investing activities (12,056) (2,544) 373.9%
CASH FLOWS FROM FINANCING ACTIVITIES
Payment for lease liabailities (546) - >100.0%
Proceeds from issue of shares 787 16,297 (95.2%)
Dividends paid (13,410) (6,438) 108.3%
Net cash provided by/(used in) financing activities (13,169) 9,859 (233.6%)
Net increase/(decrease) in cash & cash equivalents (13,356) 29,387 (145.4%)
Net foreign exchange differences 3 (1) (400.0%)
Cash at beginning of period 84,583 47,919 76.5%
Cash and cash equivalents at end of period 71,230 77,305 (7.9%) H1 FY20 Results Presentation | 14VISION & STRATEGY
THE $1 BILLION VISION
‘$1 Billion in ticket sales on the Jumbo platform by FY22’
▪ Includes both the ticket reseller business and the SaaS business
▪ $320 million at June 2019
▪ $358 million at Dec 2019
▪ Additional $135 million under contract with 3 Charities to be onboarded over the next 12 months
CAN WE GET TO $1 BILLION IN TICKET SALES? $1 BILLION TARGET
▪ Ticket reseller business needs to grow at 24.7% pa
(historical 5-year CAGR) over 3 years to reach $680
million
Total Transaction Value (TTV)
▪ Remaining $320 million will need to come from the
SaaS business which currently has $135 million under
contract.
▪ Aiming for at least $100 million in new SaaS deals
each year
▪ UK market potential
▪ US online lottery market openingup
SaaS business
Reseller business
HY1FY20 FY22
Annualised
H1 FY20 Results Presentation | 15VISION & STRATEGY (CONTINUED)
NUTS AND BOLTS
HOW WILL WE GET TO $1 BILLION IN TICKET SALES?
▪ Best of breed Software Platform
– Jumbo’s own metrics prove the platform’s effectiveness
– Ongoing software development
– Continue to improve customer engagement KPI’s
– Continue to maintain ‘Powered by Jumbo’ SaaS competitiveness
▪ OzLotteries.com
– Continue building success
– Room for growth - 26.7% of lottery tickets in Australia sold online 1
– Growing customer database underpinning future growth
– Strong relationships - continue to build a strong relationship
with Tabcorp and with the major charitable lottery operators in
Australia
1
Sources: Tabcorp Limited investor presentation dated 19 February 2020
H1 FY20 Results Presentation | 16VISION & STRATEGY (CONTINUED)
STRATEGY - FIRST TO MARKET WITH ONLINEINNOVATIONS
▪ Lotto Party - Online lotterysyndication:
– First online lottery operator to offer syndication inAustralia
– Group play as a percentage of total TTV has increased to 10%
– Combats jackpot fatigue
– Drives growth through “Refer a friend”
– Attracts a younger demographic
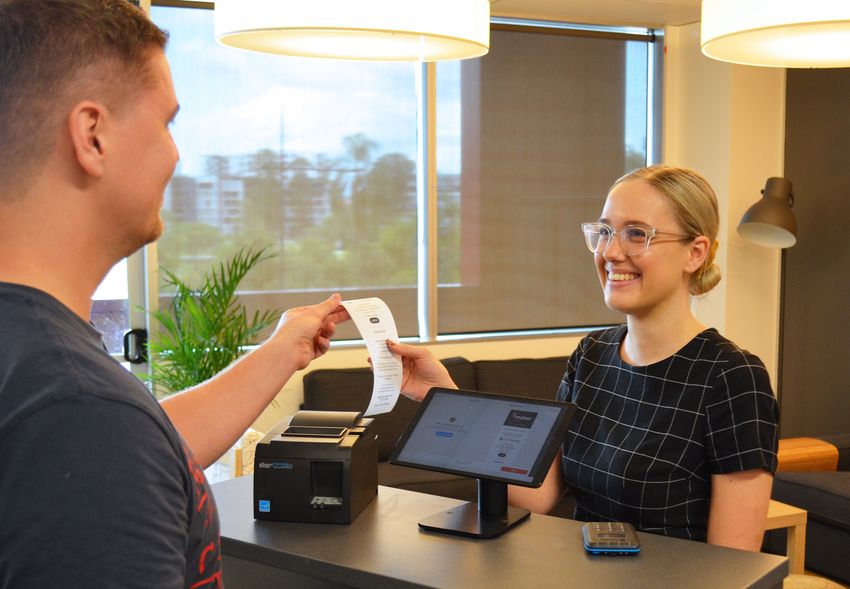
▪ Class leading mobile App:
– Trend to mobile continues
– Mobile accounts for about 75% of all customerinteractions
– Jumbo offers a5-star App to the Australian market
– Provides automatic results notification ensuring continued customer
interaction after a draw
▪ Voice interaction:
– Oz Lotteries voice app launched on GoogleAssistant
– Product is still new in the market but early indications are good
– Apple Siri to be launched in futureperiods
H1 FY20 Results Presentation | 17OUTLOOK
The business is well placed for the future:
▪ Step change in FY2020 to support the increase in scale of the business and planned future growth
▪ Revenue from Reseller agreements:
– 5 year CAGR FY2019 of 25.0% for lotteries segment
– Increasing digital penetration – 26.7% H1 FY2020
– Continuing marketing strategy to attract new customers and improve customer engagement through ‘machine
learning’ (AI/ML)
– Continue improvements on the software platform to be in the best possible position to take full advantage of
any future game changes and/or higher levels of jackpot activity1 and if and when these occur
▪ Revenue from SaaS agreements:
– Licensing agreements have been signed with certain charity lotteries in Australia with a delayed revenue
contribution due to longer than expected onboarding
– Based on estimated annual aggregate ticket sales of ~$135.0 million p.a., estimated TTV and Revenue ~$4.4
million p.a., and incremental NPBT ~ $3.3 million p.a expected to be generated – exact timing unknown but
largely expected in FY2021
– Addition of future licensing agreements (from FY2021) with estimated ticket sales ~$100 million p.a., estimated
TTV and Revenue ~$4.0 million p.a. and estimated incremental NPBT ~$3.0 million – potential to introduce the
Gatherwell model in Australia that will assist with this
1 Large jackpot activity continues to be an important driver of TTV, so the level of this jackpot activity over the remaining period of FY20 may affect expected TTV
growth accordingly. The Company continues to invest in its software platform and marketing to place it in the best possible position to take advantage of increased
levels of jackpot activity when this occurs.
H1 FY20 Results Presentation | 18DISCLAIMER
This presentation contains summary information about the current make an investment decision regarding Jumbo shares.
activities of Jumbo Interactive Limited (Jumbo). It should be read in All dollar values are in Australian dollars (A$) unless otherwise
conjunction with Jumbo’s other periodic and continuous disclosure stated. Neither Jumbo nor any other person warrants or guarantees
announcements lodged with the Australian Securities Exchange the future performance of Jumbo shares or any return on any
(ASX), including the Annual Report and Accounts and associated
investment made in Jumbo shares. This presentation may contain
media release, released 22 August 2019 is available at certain ‘forward- looking statements’. Indications of, and guidance
www.asx.com.au. on, financial position and performance are also forward-looking
No member of Jumbo gives any warranties in relation to the statements. Any forecasts or other forward looking statements
statements or information contained in this presentation. The contained in this presentation are subject to known and unknown
information contained in this presentation is of a general nature and risks and uncertainties and may involve significant elements of
has been prepared by Jumbo in good faith and with due care, subjective judgement and assumptions as to future events which
however no representation or warranty, express or implied, is may or may not be correct. Such forward- looking statements are not
provided in relation to the accuracy or completeness of the guarantees of future performance and involve known and unknown
information. risks, uncertainties and other factors, many of which are beyond the
This presentation is for information purposes only and is not a control of Jumbo, that may cause actual results to differ materially
prospectus, product disclosure statement or other disclosure or from those expressed or implied in such statements. There can be
offering document under Australian or any other law. This no assurance that actual outcomes will not differ materially from
presentation does not constitute an offer, invitation or these statements. You are cautioned not to place undue reliance on
recommendation to subscribe for or purchase any security and neither forward-looking statements. Except as required by law or regulation
this presentation nor anything contained in it shall form the basis of (including the ASX Listing Rules), Jumbo undertakes no obligation to
any contract or commitment. update these forward-looking statements. Past performance
information given in this presentation is given for illustrative purposes
This presentation is not a recommendation to acquire Jumbo shares. only and should not be relied upon as (and is not) an indication of
The information provided in this presentation is not financial product future performance.
advice and has been prepared without taking into account any
recipient’s investment objectives, financial circumstances or particular
needs, and should not be considered to be comprehensive or to
comprise all the information which recipients may require in order to
H1 FY20 Results Presentation | 19FY19 Results Presentation | 18
You can also read