Siltronic AG Investor Presentation - FY 2020 - March 9, 2021

Page created by Daryl Swanson
 
CONTINUE READING
Siltronic AG Investor Presentation - FY 2020 - March 9, 2021
Siltronic AG
Investor Presentation – FY 2020

March 9, 2021

                                  © Siltronic AG
Siltronic AG Investor Presentation - FY 2020 - March 9, 2021
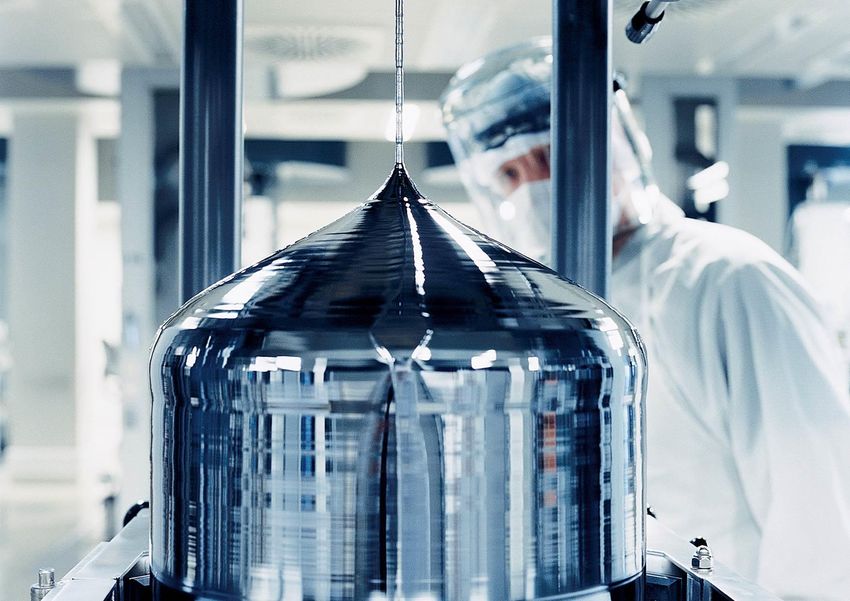
Increasing demand for electronic devices and new applications
drive semiconductor growth, which in turn fuels silicon demand.

Electronics Value Chain 2020

                  Electronics
              USD 1,650 bn

                      Semiconductors
                               USD 429 bn

           Semiconductor silicon wafers
                                            USD 11.2 bn

                   Silicon for electronic applications
                                                               USD 1.2 bn
                                               Source: Electronics (IC Insights), Semiconductors (WSTS, only silicon-based), Silicon wafers (SEMI SMG), Electronic applications (estimate)

           Siltronic AG – Investor Presentation FY 2020
           March 9, 2021
                                                                                                                                                                                2 of 32
Siltronic AG Investor Presentation - FY 2020 - March 9, 2021
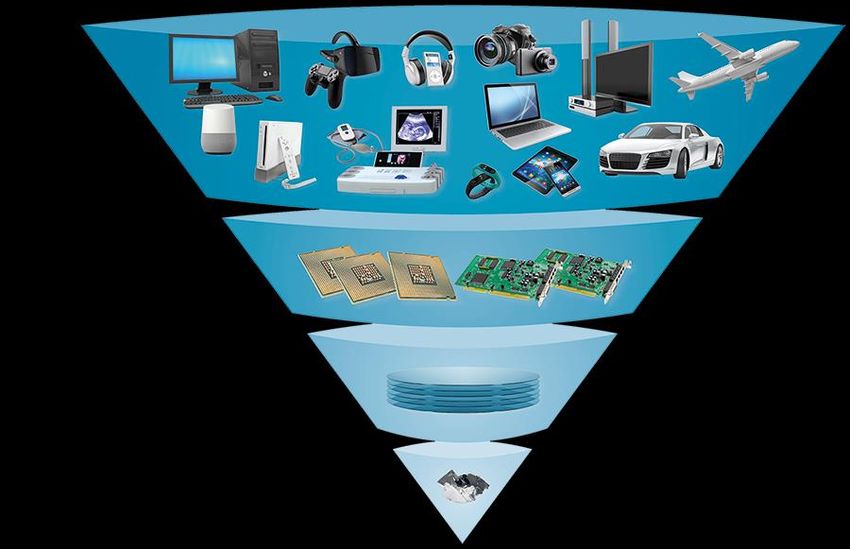
Siltronic has a relevant global market share…

Top 5 wafer producers serve more than 90% of market across all diameters

                                                         17%           13%

                                                                                   13%

                                              25%

                                                                        32%

                                       SK Siltron        Siltronic   Shin Etsu   Sumco   GlobalWafers

                                                                                             Sources: reported company revenues Q1-Q3 2020, converted to USD million

          Siltronic AG – Investor Presentation FY 2020
          March 9, 2021
                                                                                                                                                           3 of 32
Siltronic AG Investor Presentation - FY 2020 - March 9, 2021
... and an international manufacturing network

                                                                                Freiberg         CP*   300 mm

                                                                    Germany
                  Portland                  200 mm

United States

                                                                                Burghausen       CP*   300 mm     SD*

►   Central R&D hub in Burghausen

►   High volume facilities for 300 mm
    in Germany and Singapore

►   Among world’s newest & largest                                              SSW        CP*    300 mm    SSP     200 mm
    fabs in Singapore
                                                                    Singapore

*CP = Crystal Pulling | *SD = 150 mm and smaller

                     Siltronic AG – Investor Presentation FY 2020
                     March 9, 2021
                                                                                                                        4 of 32
Siltronic is focused on growing 300 mm and attractive 200 mm
business.

Development of Total Wafer Demand per Diameter, in mn 300 mm equivalents per month

                                                                      Strong
7                                                                     demand
     300 mm        200 mm              SD (pol/epi)                      &
6                                                                     growth

5

4

3                                                                    Stable &
                                                                     attractive
2

1                                                                     Mid-term
                                                                      decline
0
 2010 2011 2012 2013 2014 2015 2016 2017 2018 2019 2020 2021
                                                                     Source: SEMI up to Jan 2021

         Siltronic AG – Investor Presentation FY 2020
         March 9, 2021
                                                                                        5 of 32
Cost-competitiveness a pre-requisite

Major cost items                                                          Cost development 2021

                                                                                                   Productivity
                                                                                                      improvement
 Labour
                                                                                                     Supply savings
                                                                                                     Recycling
                                                             COLA                                   Energy efficiency
 Supplies
                                                                                                     Automation
                                                             Commodity                              Cash cost
                                                              Prices                                  development
 Depreciation

 Polysilicon

 Energy

             Siltronic AG – Investor Presentation FY 2020
             March 9, 2021
                                                                                                                  6 of 32
Overview Financials
Adjusted financial figures
(EUR million)
                                                                            2016                       2017                      2018                      2019                      2020

Sales                                                                      933.4                  1,177.3                   1,456.7                    1,270.4                   1,207.0

EBIT                                                                          27.0                    235.7                     497.7                     298.3                     192.2

EBIT margin in %                                                                2.9                     20.0                      34.2                      23.5                       15.9

EBITDA                                                                     146.0                      353.1                     589.3                     408.7                     332.0

EBITDA margin in %                                                            15.6                      30.0                      40.5                      32.2                       27.5

Earnings per share                                                            0.40                      6.18                    12.44                       7.52                       5.36

Capex                                                                         88.8                    123.2                     256.9                     363.0                     187.6

Free cash flow                1                                               19.0                    169.6                     416.4                       36.4                       32.0

Net cash flow 1                                                               39.6                    124.8                     240.4                       81.3                       77.4

Dividend                                                                            -                   75.0                    150.0                       90.0                    60.0 ²

1   In 2018, Siltronic started reporting the key figure „net cash flow“ instead of „free cash flow“. Net cash flow represents free cash flow without the time shifts created by inflow and
    return of customer prepayments which, due to the size, impairs the meaningfulness of free cash flow.
2   Dividend proposal or EUR 2.00 per share to AGM on April 29, 2021

                      Siltronic AG – Investor Presentation FY 2020
                      March 9, 2021
                                                                                                                                                                                       7 of 32
Creating value for all stakeholders

      ... its customers and suppliers                                       … its shareholders

  Quality & Innovation                                           Long-term value enhancement
  Technology leadership                                          Attractive return
  Customer service                                               On-going cost reduction

                                                         Siltronic
                                                          offers
                … its employees                                       ... the environment and society

  Occupational health & safety                                   Conservation of resources & recycling
  Human Resources Development                                    Compliance & Human Rights
  Equality                                                       Social commitment

          Siltronic AG – Investor Presentation FY 2020
          March 9, 2021
                                                                                                           8 of 32
Clear commitment to sustainability
Sustainability at Siltronic AG

 Claim: We understand sustainability not only as responsible action, but also
  want to generate competitive advantages through our sustainable actions.

 Strategy: We plan resource-saving right from the start, based on product and
  production safety as well as health and environmental protection.

 Voluntary commitments: We follow the principles of the Responsible
  Business Alliance (RBA) and the United Nations Global Compact.

 Goal: We want to reconcile the effects of our business activities with the
  expectations and needs of society.

CDP: Siltronic has been evaluated by CDP since 2018; current evaluation results
CDP Climate Change "B | Management" and Water Security "B | Management“

ISS-oekom: Siltronic has been evaluated by ISS-oekom since 2017. With the
"Prime" rating, Siltronic is one of the leading companies in the semiconductor
industry in the area of sustainability.

            Siltronic AG – Investor Presentation FY 2020
            March 9, 2021
                                                                                  9 of 32
Environment - Efficiency as a success factor
Selection of non-financial performance indicators in 2020

 GHG emissions                                            Energy
                              Scope 1 and 2                              Energy efficiency
                             absolute annual                              savings (GWh)
                               reduction by

                     2.2%                                                 7.1
                              since 2015                                        in 2020

Waste Recycling                                           Occupational Safety
                     Waste Recycling Ratio                               Working accidents with
                                                                         lost days per 1 million
                                                                          working hours (LTIF)

                       70%                                                      2.1
           Siltronic AG – Investor Presentation FY 2020
           March 9, 2021
                                                                                             10 of 32
CSR targets until 2030
Consistently sustainable action secures long-term competitive advantages for Siltronic

                                                          Reduce specific greenhouse gas emissions
                                                                           by 20%1

                                                            Reduce specific energy consumption
                                                                         by 20%1

                                                             Reduce specific water consumption
                                                                         by 20%1

                                                              Increase water recycling by 25%1

                                                              Increase waste recycling by 25%1

                                                                                                 1   base value 2015

           Siltronic AG – Investor Presentation FY 2020
           March 9, 2021
                                                                                                         11 of 32
Siltronic strategy - capitalize on market opportunities while focusing
on 300 mm & technological leadership

                                             Optimize returns,
                                       stay ahead in technology and
                                           grow with the market

                                                          Strategic Focus

  Grow                           Ensure                           Improve                 Execute
  with the market                technology &                     financial performance   cost reduction
                                 quality leadership               & cash flow             roadmaps &
                                                                                          debottlenecking
                                                                                          concepts

  We continuously increase the value for our stakeholders by providing best-in-class wafers
                                   at competitive costs.

           Siltronic AG – Investor Presentation FY 2020
           March 9, 2021
                                                                                                        12 of 32
Financials 2020

                  © Siltronic AG
Revenues down q-o-q due to seasonality and some FX headwind
Sales, in EUR m

                                                                               Comments

                                                                                Positive
                                                                                  Wafer area sold up y-o-y
                                         323.1
   304.3                                                                          Stabilizing price trend in H2
                   300.1                                    299.2
                                                                      284.5
                                                                                Negative
                                                                                  ASP in EUR down y-o-y
                                                                                    Prices down in H1
                                                                                    H2 down due to negative product
                                                                                     mix and strong Euro
                                                                                    Q4 burdened by some seasonality

  Q4 2019        Q1 2020               Q2 2020             Q3 2020   Q4 2020

            Siltronic AG – Investor Presentation FY 2020
            March 9, 2021
                                                                                                                   14 of 32
Lower wafer area sold and productivity gains lead to lower
COGS q-o-q
Cost of sales, in EUR m                                             Gross profit, in EUR m / Gross margin, in %

                                                                        31.8       29.8      30.7
                210.8           224.0          221.0        211.7                                       26.1      25.6
     207.4

                                                                        96.9       89.3      99.1       78.2      72.8

    Q4 2019 Q1 2020               Q2            Q3          Q4        Q4 2019 Q1 2020        Q2        Q3         Q4

Selling, R&D and admin expenses, in EUR m                           Comment
                                                                     COGS up y-o-y
                                                                       Higher wafer area sold
                                                                       Higher scheduled depreciation and investments
                                                                     Costs per wafer area significantly down y-o-y
                                                                       Successful cost-reduction programs
                                                                       FX effects
                                                                     COGS down q-o-q
                                                                       Lower wafer area sold
     35.2       33.5            33.4            33.5        43.6       Productivity up
                                                                     Administration expenses up in Q4
   Q4 2019 Q1 2020              Q2              Q3          Q4         External advisors on GlobalWafers’ tender offer

             Siltronic AG – Investor Presentation FY 2020
             March 9, 2021
                                                                                                                     15 of 32
High US-Dollar and Japanese Yen exposure
FX exposure, in %                                                   FX sensitivity

             ~ 10%                                                                             Sales              EBITDA
                                                                                                                 unhedged
             ~ 25%
                                                                     1 USD-cent change     ~ EUR 6 million    ~ EUR 4.5 million

             ~ 65%                                  ~ 65%            1 JPY change         ~ EUR 2.5 million   ~ EUR 2 million

              Sales                                Costs
                 USD         SGD        JPY      EUR

Other currency effects (mostly hedging),                            Comment
in EUR m                                                             Strong Euro significant headwind on sales and
5                                                                     earnings in 2020
                                                                     Other currency effects of EUR -4m in 2020

                                    0.4             0.6
0

      -4.2         -3.3                                      -1.3

-5
     Q4 2019 Q1 2020               Q2              Q3        Q4

              Siltronic AG – Investor Presentation FY 2020
              March 9, 2021
                                                                                                                       16 of 32
EBITDA burdened by strong Euro and costs relating to tender
offer in Q4

EBITDA, in EUR m / EBITDA margin, in %                           Depreciation, in EUR m

   29.6                    31.1
            28.1                           26.8
                                                          23.6

   90.0     84.2          100.4            80.1           67.2
                                                                    -33.3    -30.9     -33.5     -36.5     -38.8
  Q4 2019 Q1 2020          Q2              Q3             Q4
                                                                  Q4 2019 Q1 2020       Q2        Q3        Q4

EBIT, in EUR m / EBIT margin, in %                               Comments
                                                                  Positive
                                                                    Prices stable q-o-q
                                                                    Successful cost reduction programs and
                                                                     productivity gains
                           20.7
    18.6    17.8
                                           14.6                   Negative
                                                          10.0      Wafer area sold down due to seasonality
                                                                    Strong Euro in H2
                           66.9                                     Advisory costs relating to GlobalWafers’ tender
    56.7    53.3                           43.6           28.4       offer
  Q4 2019 Q1 2020          Q2              Q3             Q4        Scheduled depreciation up q-o-q

           Siltronic AG – Investor Presentation FY 2020
           March 9, 2021
                                                                                                                   17 of 32
Net profit of EUR 187 million in 2020
Net profit, in EUR m                                                   EPS, in EUR

                              60.8                                                              1.80
   45.4       46.0                            39.1            40.9        1.21       1.32                  1.08      1.17

 Q4 2019 Q1 2020              Q2                Q3            Q4         Q4 2019 Q1 2020        Q2         Q3        Q4

Dividend payment, in EUR m                                             Comments
                                                                        Net profit of EUR 187 million in 2020; thereof EUR
                                                                         160.8m attributable to Siltronic shareholders

                     150                                                Dividend proposal of EUR 2.00 per share = EUR 60m
                                                                         dividend payout in 2021

      75                                   90
                                                              60

   FY 2018        FY 2019             FY 2020               FY 2021e

             Siltronic AG – Investor Presentation FY 2020
             March 9, 2021
                                                                                                                        18 of 32
Tax rate significantly down
Effects on tax expense in 2020
                                                                           Comments
 Tax expense w/o special                                                    The negative tax rate in Q4 due to one-
                                                            Tax rate: 8%
         effects
                                                                             time effects on current and deferred
                                                                             taxes
                                                                            Tax rate in 2020 only 1%
      Tax effects in USA
                                                                            USA
                                                                              Significant tax benefits to reduce
                                                                               burden of Corona pandemic
  Tax effects in Germany

                                                                            Germany
                                                                              Degressive depreciation introduced
    One-time payment to
       pension fund
                                                                            Pension fund
                                                                              One-time payment to allow pension
Tax expense incl. special                                                      fund to reduce its discount rate
                                                            Tax rate: 1%
        effects

             Siltronic AG – Investor Presentation FY 2020
             March 9, 2021
                                                                                                               19 of 32
Working capital down
High trade liabilities related to capex and advisory fees
Working capital, in EUR m,                                                Inventories and contract assets, in EUR m
Working capital ratio to quarterly sales, in %
                                                                     80                 Inventories   Contract assets
                                                73           71
                 60             58
      55                                                             60

                                                                     40      167.4     169.1      175.1      169.3      175.1

                              188.6          218.1          200.8
    168.3      179.5                                                 20

                                                                     0
    Dec 19    Mar 20         Jun 20         Sep 20          Dec 20           Dec 19   Mar 20      Jun 20     Sep 20     Dec 20

Trade receivables, in EUR m                                               Trade liabilities, in EUR m

  127.7      120.6           130.6           141.3          144.5

  Dec 19     Mar 20         Jun 20          Sep 20          Dec 20           -126.8   -110.2      -117.1     -92.5      -118.8

                                                                             Dec 19   Mar 20      Jun 20    Sep 20      Dec 20

             Siltronic AG – Investor Presentation FY 2020
             March 9, 2021
                                                                                                                           20 of 32
Strong equity ratio and solid net financial assets
Equity, in EUR m                                       Provisions for pensions,                        Net financial assets,
Equity ratio, in %                                     in EUR m                                        in EUR m
        52.8
 47.8
                   45.4               45.4
                            43.7
                                                      Interest rates IFRS
                                                      USA     2.98%   2.88%    2.46%   2.41%   2.07%
                                                      Germany 1.24%    1.92%   1.23%   0,95%   0.69%

        1031
 930
                  867       833       872
                                                                                       606     567        589   588
                                                                               552                                          519
                                                              492                                                     509          499
                                                                       411

 Dec    Mar       Jun       Sep       Dec                     Dec      Mar     Jun     Sep     Dec        Dec   Mar   Jun   Sep    Dec
 19     20         20       20        20                      19       20       20     20      20         19    20     20   20     20

               Siltronic AG – Investor Presentation FY 2020
               March 9, 2021
                                                                                                                                  21 of 32
Pension reserves impacted by low IFRS interest rates
DBO and pension reserves, in EUR m                                              Comment

                  1,278                            ~850             711          DBO of EUR 1,278 million – assets of
                                                                                  EUR 711 million = EUR 567 million
 USA mostly
 funded
                   142       2.07%                  147      3%                  Pension reserves @3% = DBO of EUR
                                                                     108
                                                                                  ~850 million – assets EURO 711 million
 Germany           217       0.69%                           3%                   = EUR 139 million
 unfunded                                          ~140
                                                                     50
                                                                                 IFRS interest uses bond yields only,
                                                                                  assets include bonds, equity, real estate +
                                                                                  derivatives

                                                                                 Wacker pension fund
 Funded through                                                      553
    Wacker         919                                                             fully funded under German pension fund
  Pension Fund               0.69%                ~560       3%                     regulations using 3.23% interest rate

                                                                                   asset liability study: probability of return
                                                                                    in next 20 years:
                                                                                    ≥3.5% 59%

                                                  DBO             Assets Dec,
                                                                                    ≥3.0% 75%
              DBO Dec,
                2020                              @3%                2020           ≥2.5% 87%

              Siltronic AG – Investor Presentation FY 2020
              March 9, 2021
                                                                                                                       22 of 32
Capex 2020 significantly down vs. 2019

Investment, in EUR m                                             Comment
                                                                  Capex 2020 significantly down to EUR 188m
                                                                  Epi expansion in H2 to accommodate demand and
                                                                   market growth
                                                                  Investment in capabilities to enable leading-edge
                                                                   design rules

                                                  363

                                   257
                                                           188

                    123
       54

            Siltronic AG – Investor Presentation FY 2020
            March 9, 2021
                                                                                                                   23 of 32
Net cash flow in line with expectation
Operating cash flow (OCF), in EUR m                               Customer prepayments net (PP), in EUR m

   100.7
             85.6
                             58.6            60.9
                                                          31.4       3.6                                 3.5
                                                                              -21.6      -16.9   -10.5
  Q4 2019 Q1 2020            Q2              Q3           Q4
                                                                   Q4 2019 Q1 2020       Q2       Q3     Q4
CF Capex, in EUR m                                                Net cash flow (NCF), in EUR m

                                                                               40.9
                                                                                          26.7    28.6
                                                                      8.9
                                                                                                         -18.9
                            -48.8            -42.8        -46.8
            -66.3
   -88.2

  Q4 2019 Q1 2020            Q2              Q3           Q4        Q4 2019 Q1 2020      Q2       Q3     Q4
                                                                  NCF= OCF-PP+CF Capex

           Siltronic AG – Investor Presentation FY 2020
           March 9, 2021
                                                                                                              24 of 32
Outlook 2021

               © Siltronic AG
2021 off to a good start

2021 challenges and opportunities

 Good start in 2021
 Overall high demand and good to very good loading
 Foundry, logic and image sensors expected to remain strong
 Inventory levels of memory chips still on a somewhat elevated level
 Memory business expected to show positive trend
 Increasing units in smartphones and cars combined with higher content will drive mid- to long-term
  growth

 Strong Euro headwind on revenues and margins

            Siltronic AG – Investor Presentation FY 2020
            March 9, 2021
                                                                                                  26 of 32
Positive development of wafer volume in Q1 2021

                                      − Strong foundry and logic business
     300 mm                           − Ongoing uncertainty due to US-China trade tensions and Corona
                                        pandemic might lead to elevated inventories across the supply chain
                                      − Partial digestion of server components

                                      − Recovery in automotive and industrial ongoing
     200 mm
                                      − Uncertainty due to strained supply chains and Corona pandemic
                                        fears

       SD
                                      − Trending up

       Siltronic AG – Investor Presentation FY 2020
       March 9, 2021
                                                                                                        27 of 32
Estimated market growth of silicon area

Silicon area share of           Estimated development of     Devices, silicon area share and their “content minus
end markets (2020)              end markets in 2021          density” effect

Phones        25%                                            DRAM             18%                        High
                                                                                                         uncertainty due
PCs           20%                                            NAND             23%                        to phone mix

Servers       10%                                            Logic            34%

Industrials   15%                                            Power / others   25%

Cars          10%

Others        20%

Impact on silicon area                                       Impact on silicon area
development                                                  development

Expected silicon growth in 2021                                       7-8%
                                                                                                Source: Siltronic Marketing Feb.2021

              Siltronic AG – Investor Presentation FY 2020
              March 9, 2021
                                                                                                                         28 of 32
Siltronic Outlook 2021 (as of March 1, 2021)

        Sales                           − mid to high single-digit percent increase

   EBITDA margin                        − slight increase

     Depreciation                       − around EUR 155m to EUR 160m

        EBIT                            − significant increase

       Tax rate                         − significantly below 10%

       CapEx                            − around EUR 250 million (mainly in 300 mm epi, capabilities and
                                          expansion of crystal pulling hall to replace older equipment)

    Net cash flow                       − slight improvement

  Earnings per share                    − slight increase

         Siltronic AG – Investor Presentation FY 2020
         March 9, 2021
                                                                                                           29 of 32
Contact and Additional Information

Issuer and Contact                                          Additional Information

Siltronic AG                                                ISIN:               DE000WAF3001
Einsteinstraße 172                                          WKN:                WAF300
D-81677 München                                             Deutsche Börse:     WAF
                                                            Listing:            Frankfurt Stock Exchange
Investor Relations:
                                                                                Prime Standard
Petra Mueller
email: investor.relations@siltronic.com
Tel. +49 89 8564-3133

Financial Calendar 2021

Annual General Meeting                   April 29, 2021
Q1 Quarterly Statement                   May 7, 2021
Q2 Interim Report                        July 28, 2021
Q3 Quarterly Statement                   October 26, 2021

            Siltronic AG – Investor Presentation FY 2020
            March 9, 2021
                                                                                                    30 of 32
Disclaimer

The information contained in this presentation is for background purposes only and is subject to
amendment, revision and updating. Certain statements contained in this presentation may be
statements of future expectations, future financial performance and other forward-looking statements
that are based on management's current views and assumptions and involve known and unknown risks
and uncertainties. In addition to statements which are forward-looking by reason of context, including
without limitation, statements referring to risk limitations, operational profitability, financial strength,
performance targets, profitable growth opportunities and risk adequate pricing, words such as "may”,
“will”, “should”, “expects”, “plans”, “intends”, “anticipates”, “believes”, “estimates”, “predicts”, “continue”,
“projects” or “seeks”, “potential”, “future”, or “further” and similar expressions may identify forward-
looking statements. By their nature, forward-looking statements involve a number of risks, uncertainties
and assumptions which could cause actual results or events to differ materially from those expressed or
implied by the forward-looking statements. These include, among other factors, changing business or
other market conditions, currency and interest fluctuations, introduction of competitive products, poor
acceptance of new products and services, change of the corporate strategy and the prospects for
growth anticipated by the management. These and other factors could adversely affect the outcome and
financial effects of the plans and events described herein. Statements contained in this presentation
regarding past trends or activities should not be taken as a representation that such trends or activities
will continue in the future. Siltronic AG does not undertake and does not intent to undertake any
obligation to update or revise any statements contained in this presentation, whether as a result of new
information, future events or otherwise. In particular, you should not place any reliance on forward-
looking statements which speak only as of the date of this presentation.

             Siltronic AG – Investor Presentation FY 2020
             March 9, 2021
                                                                                                          31 of 32
SILTRONIC AG |   Einsteinstraße 172
                 81677 Munich
                 Germany

                                      © Siltronic AG
You can also read