Boliden - Metals for generations to come - Post Q1 2021 General Presentation Mikael Staffas, President & CEO
←
→
Page content transcription
If your browser does not render page correctly, please read the page content below
Boliden – Metals for
generations to come
Post Q1 2021 General Presentation

Mikael Staffas, President & CEO
Håkan Gabrielsson, CFO

2021
Agenda
Boliden: Introduction
Mikael Staffas Håkan Gabrielsson
President & CEO CFO
Performance up until Q1 2021
The Metals market post Q1 2021
Boliden´s value creation strategy
- Key focus areas
Summary & QA
GENERAL PRESENTATION POST Q1 2021 2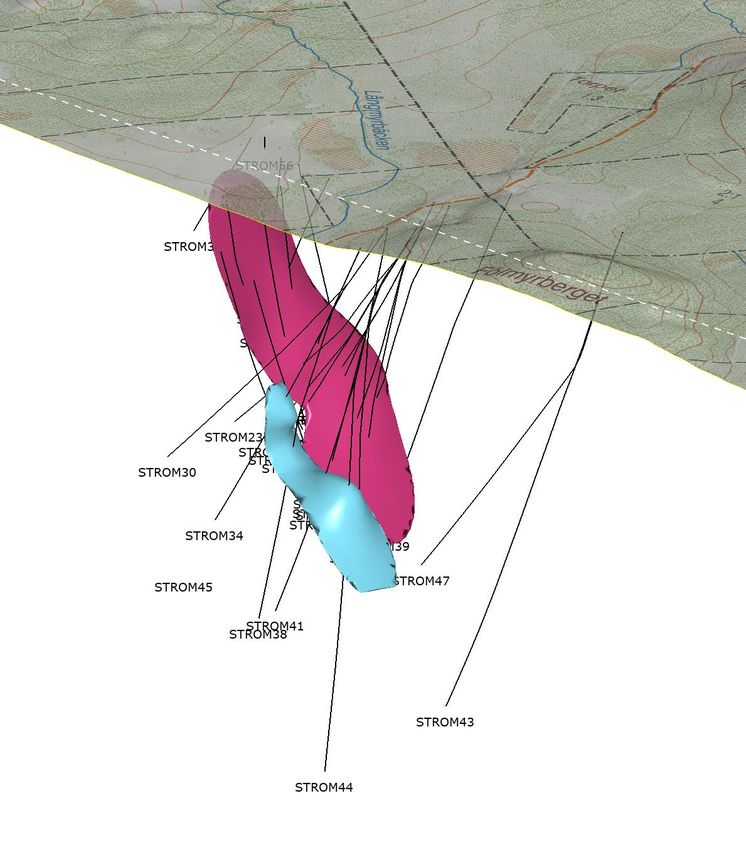
Our purpose
To provide the metals essential
to improve society for generations
to come
Our vision
To be the most climate friendly
and respected metal provider in
the world
Our values
Care, Courage, Responsibility

                    GENERAL PRESENTATION POST Q1 2021   3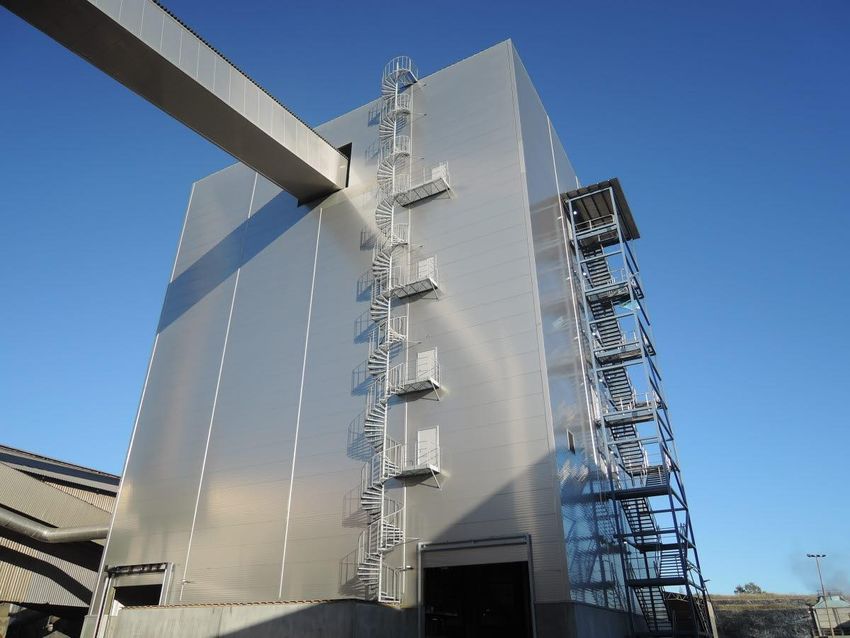
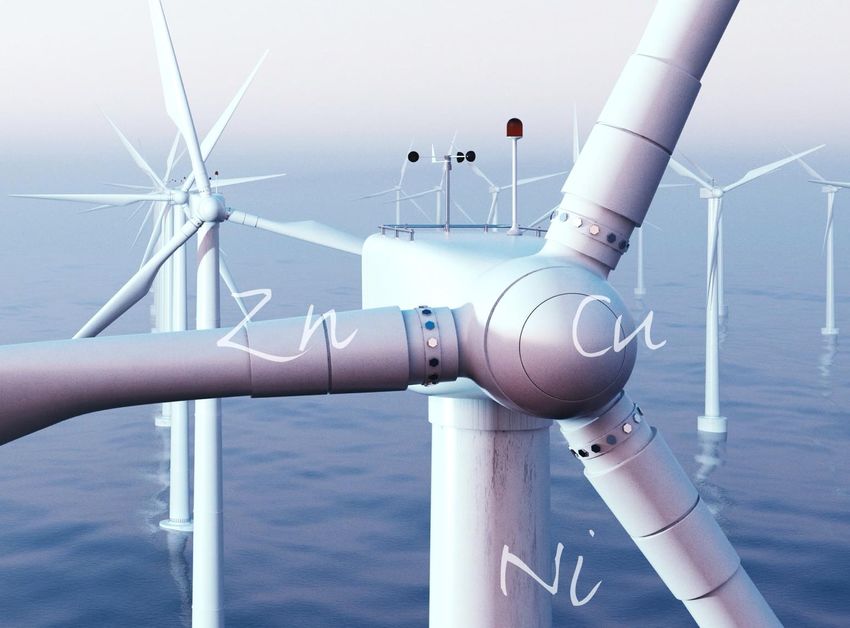
Boliden – Metals for modern life
EBIT* ex. PIR
SEKm
10,000
8,000
6,000
4,000
2,000
0
2011 2012 2013 2014 2015 2016 2017 2018 2019 2020
Founded in 1924
~6,000 employees
Mines & Smelters
Most exposure to Zn and Cu
Industrial customer base in northern Europe
* PIR=Process Inventory Revaluation
GENERAL PRESENTATION POST Q1 2021 4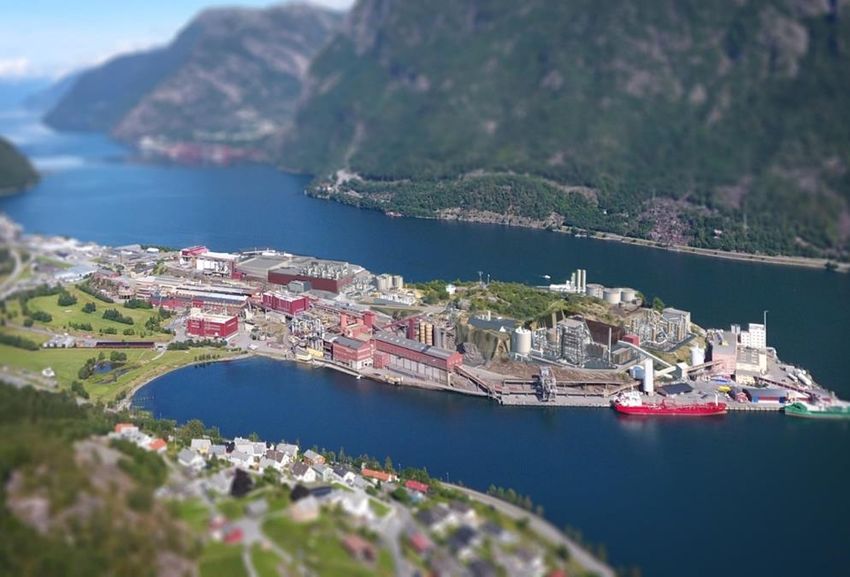
Boliden´s contradictions are key to our success…
Small                                   Large
~6,000 employees                        Listed on OMX Large Cap

Local                                   Global
Strong link to local communities        Global network and smelter sourcing

Conservative                            Cutting edge in technology
Preserving and valuing its culture      Highly automated

Co-worker at the Boliden mine in 1936   Present Electric trolley at the Aitik mine
                                                                                     GENERAL PRESENTATION POST Q1 2021   5
… along decentralized management*

           Hans Jönsson,      Jenny Gotthardsson,     Peter Bergman,       Henrik Grind,    Gunnar Nyström,
            Boliden Aitik     Boliden Garpenberg       Boliden Area       Boliden Kevitsa    Boliden Tara

           Linn Andersson,        Timo Rautalahti,    Antti Kontiainen,    Helen Seim,       Fredrik Kanth
           Boliden Rönnskär      Boliden Harjavalta   Boliden Kokkola      Boliden Odda     Boliden Bergsöe

* On average our 10 General managers have 27 years of work experience
from the Metals & Mining industry, whereof 16 years as Boliden employees.

                                                                                                        GENERAL PRESENTATION POST Q1 2021   6
World leading productivity in open pit and
underground mines
                   Copper – open pit mines*                                                                    Zinc - underground mines*
Tonnes per                                                                                     Tonnes per
 manhour                                                                                        manhour
 35                                                                                                7,0

 30                           Aitik                                                                6,0

 25                                                                                                5,0

 20                                                                                                4,0                   Garpenberg

 15                                                                                                3,0           Boliden
                                                                                                                  Area

 10         Kevitsa                                                                                2,0                 Tara

  5                                                                                                1,0

  0                                                                                                0,0
      0       20        40        60       80        100      120       140       160                    0                       5                   10                        15
                             Million tonnes of milled ore                                                                     Million tonnes of milled ore
  Source: Wood Mackenzie 2020,
  (1) Copper: Open pit and mines with both open pit / underground operations, Zinc: underground and mixed underground/open pit mines
  C1 Cash Cost (US¢/lb) composite costing

                                                                                                                                                       GENERAL PRESENTATION POST Q1 2021   7
Enhanced cost position
in open pit and underground mines
                         Copper                                                                    Zinc –
             composite mining cash cost USc/lb                                        composite mining cash cost USc/lb
  300                                                                        150

  250                                                                        130

                                                                             110                                                          Tara
  200

                                                                              90                          Boliden Area
  150
                                                                              70            Garpenberg
  100    Aitik 2020                                                                                                                         Tara
                                                                              50                                                Boliden Area
                               Aitik 2010
   50
                                                                              30                            Garpenberg
    0
        0%        20%       40%         60%        80%       100%             10

  -50                                                                        -10 0%        20%           40%        60%            80%           100%

 -100                                                                        -30

                             2020           2010                                                          2020           2010

Source: Wood Mackenzie 2020,
(1) Copper: Open pit and mines with both open pit / underground operations, Zinc: underground and mixed underground/open pit mines
C1 Cash Cost (US¢/lb) composite costing

                                                                                                                                                        GENERAL PRESENTATION POST Q1 2021   8
ESG is key in our purpose,
vision and values
CO2 Intensity
1.0
Q1 2021 0.8
Lost Time Injury* 6.5 (6.5)
Sick leave 5.2 (4.7) 0.6
‒ Covid-19
0.4
Carbon dioxide intensity of 0.7 (0.6)
‒ Lower grades
0.2
‒ Feed mix
0.0
Q1 Q2 Q3 Q4 Q1 Q2 Q3 Q4 Q1 Q2 Q3 Q4 Q1 Q2 Q3 Q4 Q1
2017 2018 2019 2020 2021
*Per million hours worked, including contractors
GENERAL PRESENTATION POST Q1 2021 9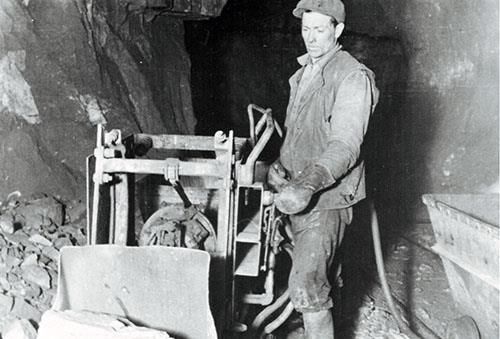
We are a front runner in
Circular
recycling… Economy
Rönnskär
– a world leading recycler of
electronic material
Four million car batteries per year
E-scrap equivalent to two million mobile Bergsöe
- one of Europe’s
phones per day largest recycling
facilities for lead
Steel mill dust batteries
Zinc ashes
Incinerated waste
GENERAL PRESENTATION POST Q1 2021 10…and taking long term
responsibility for our metal supply
Just above 30 active and
decommissioned mines
2.3 BSEK net reclamation liability
Net reclamation liability is included in our
capital structure goal*
* Boliden’s
capital structure goal; the sum of net debt and net reclamation liability shall,
comprise approximately 20% of equity in an economic upturn.
Rackejaur (decommissioned mine in the Boliden Area)
GENERAL PRESENTATION POST Q1 2021 11Competitively low carbon footprint compared to
global averages (nickel)
Nickel integrated Kevitsa - Harjavalta CO2 emissions scope 1+2
Source: Wood Mackenzie
GENERAL PRESENTATION POST Q1 2021 12Competitively low carbon footprint compared to
global averages (zinc)
Weighted Average
Weighted Average
Source: Wood Mackenzie Zinc Emissions
benchmarking tool
GENERAL PRESENTATION POST Q1 2021 13Further reduction of CO2 from an
already strong position
Boliden’s climate target is to reduce CO2
intensity by 40% 2012-2030
‒ 2012: 0.77
‒ 2020: 0.61
‒ Target 2030: 0.46
We will achieve this by
‒ Increased electrification
‒ Optimized ventilation
‒ Energy efficiency
‒ Alternative reduction agents
‒ Improved energy mix Aitik
GENERAL PRESENTATION POST Q1 2021 14Responsible tailings
management of highest priority
Boliden is a new member in the International
Council on Mining and Metals (ICMM)
‒ Adherence to ICMM's principles to ensure a safe, fair,
sustainable and transparent mining and metals industry
We are committed to implement the Global
Industry Standard on Tailings Management
according to the set timelines
Kevitsa
GENERAL PRESENTATION POST Q1 2021 15Q1 2021 – Strong cash flow
KEY HIGHLIGTHS PROJECTS
Strong prices and terms Kevitsa and Garpenberg at designed
Stable production in Smelters capacity, Aitik still ramping up
Production disturbances and On schedule: Rönnskär Cu expansion
Covid-19 related issues in Mines and Harjavalta Ni expansion
Decision to expand Kristineberg within
the Boliden area (Rävliden
FINANCIAL PERFORMANCE
mineralization)
EBIT excl. PIR* 2,449 (1,504) MSEK
Leach plant in Rönnskär under
Free cash flow 2,165 (-845) MSEK commission
Capex 1.1 (1.8) BSEK
*PIR (Process Inventory Revaluation)
GENERAL PRESENTATION POST Q1 2021 16EBIT excl. PIR by business areas
MSEK Q1 2021 Q1 2020 Q4 2020
Mines 1,631 318 1,858
Smelters 949 1,117 1,109
Other/eliminations -131 69 76
The Group 2,449 1,504 3,043
Mines Smelters
MSEK Rolling, MSEK Rolling,
MSEK MSEK
2,500 10,000 1,500 5,000
2,000 8,000 1,200 4,000
1,500 6,000 900 3,000
1,000 4,000 600 2,000
500 2,000 300 1,000
0 0 0 0
Q1 Q2 Q3 Q4 Q1 Q2 Q3 Q4 Q1 Q2 Q3 Q4 Q1 Q2 Q3 Q4 Q1 Q1 Q2 Q3 Q4 Q1 Q2 Q3 Q4 Q1 Q2 Q3 Q4 Q1 Q2 Q3 Q4 Q1
2017 2018 2019 2020 2021 2017 2018 2019 2020 2021
Quarterly EBIT 12 months rolling EBIT Quarterly EBIT excl.PIR 12 months rolling EBIT excl.PIR
GENERAL PRESENTATION POST Q1 2021 17Cash flow
MSEK Q1 2021 Q1 2020 Q4 2020
EBITDA excl. PIR 3,769 2,762 4,651
Cash flow from working capital -122 -1,284 397
Cash flow from investments -1,076 -1,821 -1,698
Financial items -60 -65 -63
Tax paid -359 -409 -558
Other 13 -28 21
Free cash flow 2,165 -845 2,750
GENERAL PRESENTATION POST Q1 2021 18Capital structure
Net debt & Gearing
SEK bn %
SEK bn 31 Mar 2021 31 Mar 2020 31 Dec 2020 9 60
Total Assets 74.8 68.4 72.5 8
50
Capital Employed 51.7 52.6 51.0 7
Equity 48.2 43.3 45.6 6 40
5
Net debt 0.1 6.5 2.2 30
4
Net debt/equity, % 0 15 5
3 20
Net reclamation
2
liability/equity, % 5 5 5 10
1
Average interest rate, % 1.6 1.1 1.6
0 0
Net payment capacity 15.0 6.8 12.7 Q1 Q2 Q3 Q4 Q1 Q2 Q3 Q4 Q1 Q2 Q3 Q4 Q1 Q2 Q3 Q4 Q1
2017 2018 2019 2020 2021
Net debt Net debt/equity ratio
GENERAL PRESENTATION POST Q1 2021 19Zinc, Copper and Nickel prices relative to cash cost
Zinc Copper Nickel
USD/tonne USD/tonne USD/tonne
4,000 12,000 30,000
3,500
10,000 25,000
3,000
8,000 20,000
2,500
2,000 6,000 15,000
1,500
4,000 10,000
1,000
2,000 5,000
500
0 0 0
Source: Wood Mackenzie 2021 Composite C1 cash cost* data, Refinitiv Datastream April 23, 2021 price data
* Composite costing, C1 cash cost: normal C1 mines for mines with net revenue from one metal > 65% total net revenue, pro-rata for other mines
GENERAL PRESENTATION POST Q1 2021 20Copper and Zinc Treatment Charges
Copper TC Zinc TC
USD/tonne USD/tonne
concentrate concentrate
120 350
100 300
250
80
200
60
150
40
100
20 50
0 0
2017 2018 2019 2020 2021 2017 2018 2019 2020 2021
Contract TC - annual and mid-year benchmark
Standard grade spot TC Contract TC - realized Spot TC imported concentrate to China
Contract benchmark according to market sources including CRU
GENERAL PRESENTATION POST Q1 2021 21Boliden price index*
Boliden´s weighted index
remains on historic highs 200
175
150
125
100
Increased base metal prices 75
‒ Especially Cu 50
25
0
High precious metal prices
Slightly weaker USD 200
175
150
125
100
75
50
25
0
*Index 100 = 1 January 2016
GENERAL PRESENTATION POST Q1 2021 22Long-term commitment to financial targets
and dividend policy
Return on Dividend policy: Net Debt/Equity
investments 1/3 of at about 20%
≥ 10% net profit at economic
peaks*
*The target also includes net reclamation liability
GENERAL PRESENTATION POST Q1 2021 23Exploration
Exploration cost 504 (570) MSEK Kevitsa-Finnish Lapland – Cu, Ni, Au, PGM, Co
‒ Reduced activities due to Covid-19
‒ Drift to Tara Deep 76% completed Aitik/Gällivare – Cu, Au, Ag
‒ 2021: >700 MSEK
Skellefteå district – Zn, Cu, Au, Pb, Ag, Te
New partnerships
‒ Norden Crown Metals Corp. (Norway)
‒ Buchans Resources Limited (Canada) Outokumpu area – Cu, Ni, Au, Co, Zn
Garpenberg/Bergslagen – Zn, Ag, Pb, Cu, Au
Reserve life*
35
30
25
20
15
10 Tara – Zn, Pb
5
0
Aitik Boliden Area Garpenberg Tara Kevitsa
2010 2020
*2010 and 2020 year end reserves divided by designed full production
GENERAL PRESENTATION POST Q1 2021 24Aitik – Ramping up
Aitik Milled volume (Ktonnes)
Designed capacity: 45 Mtonnes 45 000
Lower grade than reserve average for 40 000
several years 35 000
Efficiency projects 30 000
‒ Electrification 25 000
‒ AHS (Autonomous Haulage System) 20 000
Liikavaara satellite pit 15 000
‒ Included in total Mineral Reserves and 10 000
Resources statement
5 000
‒ 3 km to Aitik main crusher
0
‒ Limited Capex 2012 2013 2014 2015 2016 2017 2018 2019 2020
Major permit renewal 2024
GENERAL PRESENTATION POST Q1 2021 25Garpenberg – Improving
efficiency from a high level
Designed capacity 3.0 Mtonnes
‒ Stable production achieved Garpenberg, automation in drilling
Drillmeters Drilled using automation Re-work (cleaning of holes)
250 000 60%
3.3 Mtonnes, conceptual study
50%
‒ Limited Capex 200 000
40%
150 000 37%
29% 30% 30%
28%
Efficiency projects 100 000 25%
23%
20%
15% 15%
‒ Grade optimization – two pass mining 50 000
10%
7% 8%
‒ Automation and digitalization 0 0%
‒ De-bottlenecking 2016 2017 2018 2019 2020
GENERAL PRESENTATION POST Q1 2021 26Kevitsa – At a new production
level
Kevitsa Milled volume (Ktonnes)
10000
9000
Designed capacity 9.5 Mtonnes 8000
7000
Efficiency activities 6000
‒ Stabilizing production 5000
‒ Electrification 4000
3000
2000
Potential stage 5 under evaluation
1000
0
2012 2013 2014 2015 2016 2017 2018 2019 2020
Pre-Boliden Boliden production
GENERAL PRESENTATION POST Q1 2021 27Tara – Extending by Tara Deep
Tara Deep Resource Growth*
2016 - 2020
Inferred 26.2 Mtonnes
@ 8.4% Zn, 1.6% Pb 26.2
‒ Higher grades relative to Tara 22.4
18.2
Ongoing extensive project
13.0
development program 10.2
‒ Exploration
‒ Exploration drift & mine infrastructure 2016 2017 2018 2019 2020
‒ Conceptual study
Bridging and extending Tara
*Mtonnes, Based on surface drilling
GENERAL PRESENTATION POST Q1 2021 28Rävliden – Extension of
Kristineberg mine and the
Boliden Area Kristineberg/Rävliden, possible mine layout
Future proof Boliden Area
SEK 1.25 bn Capex partially pending
environmental permits
Planned production start 2023 Rävliden*: Mineral resource of 8.4 (5.7)* Mtonnes @ 1.0% Cu, 4.2% Zn, 80 g/tonne Ag
‒ 200 Ktonnes increased annual milled volume from .
*Combination of Inferred and Indicated resources. For further details please see www.boliden.com.
the Boliden Area
‒ Higher ore value
‒ Highly automated production
‒ Potentially fossil free transports
Financial return above Boliden's target
GENERAL PRESENTATION POST Q1 2021 29Strömfors – in the Boliden Area Strömfors, mineral lenses
Inferred mineral resource of 2.59 Mtonnes @
2.95 g/tonne Au, 81 g/tonne Ag, 0.16% Cu,
4.44% Zn, 0.75% Pb
Located 4 km from Boliden processing plant
Complex metallurgy with contents of As, Sb
and Hg
Extension of mineralization still open
Exploration and conceptual study ongoing
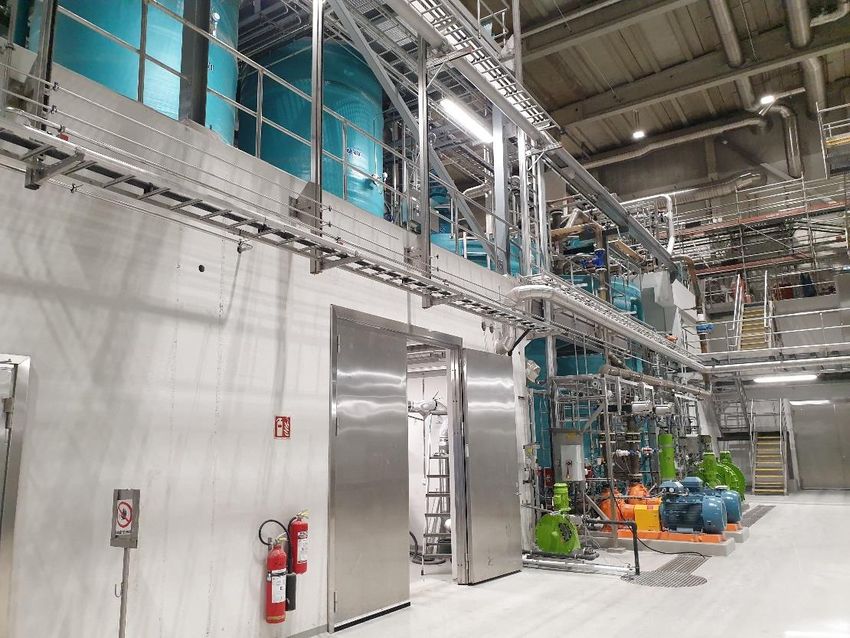
GENERAL PRESENTATION POST Q1 2021 30Rönnskär Leach Plant
reaching commissioning
Extracting additional value from
intermediates
‒ 25 ktonnes lead sulphate
‒ 25 ktonnes copper/zinc sulphate
Decreasing waste volume to
underground repository by 80%
Capex: 750 MSEK
Rönnskär Leach Plant
Commissioning Q2 2021
GENERAL PRESENTATION POST Q1 2021 31Harjavalta Ni Expansion
coordinated with maintenance
Nickel feed capacity from 310 to 370 ktonnes
Lower CO2 intensity by up to 20%
Improving safety by increasing automation
Greater raw material flexibility
Capex: 40 MEUR
Commissioning Q3 2021
Harjavalta Ni Matte station
GENERAL PRESENTATION POST Q1 2021 32Committing to Green Metals with
Boliden Low-Carbon Copper
Copper with a low carbon footprint, 4500
verified by third party 4000
>4kg
>4kg
Produced from Boliden copper 3500
concentrate and recycled copper 3000
All significant emission categories from 2500
cradle-to-gate included 2000
1.5kg
1500
We are well positioned compared to 1000
global average 500
0
ICA Environmental Profile 2018 Boliden Low Carbon Copper
[kg CO2eq/ton Copper Cathode]
GENERAL PRESENTATION POST Q1 2021 33World’s first verified Low-Carbon
Copper now available!
Boliden Low-Carbon CopperGreen Zinc – Odda 4.0 Strong industrial logic
- Economies of scale
Strategic Rationale - Efficient logistics
- Energy efficiency
- Automation and digitalization
- Recovery of lead and silver
Strong environmental credentials
- Excellent CO2 footprint
- 100% hydroelectric power
- Sustainable waste handling
Financial return above
Boliden's target
Comparable to Boliden’s largest
historical Capex projects
GENERAL PRESENTATION POST Q1 2021 35Outlook post Q1 2021
Aitik
‒ 2021: Cu 0.21 %, Au 0.11 g/tonne
Garpenberg
‒ 2021: Zn 3.8 %, Ag 110 g/tonne
Maintenance stops
‒ 2021: -500 (-345) MSEK
Capex
‒ 2021: Slightly above 7 BSEK
GENERAL PRESENTATION POST Q1 2021 36 Stable value chain
Boliden, Investment Case - Technical know-how
- Mines and Smelters
- Base metals and precious metals
- High corporate responsibility
- Stable jurisdictions
Strong capability to deliver results
- High productivity
- Solid financials
- Long cultural heritage
- Own project development
- Long life for key mines
Competitive portfolio
- Metals for generations to come
- Cu, Zn, Ni and Pb
- Biproducts like Au, Ag, Pt and Pd
GENERAL PRESENTATION POST Q1 2021 37This presentation has been prepared by Boliden for information purposes only and as per the indicated
date. Boliden does not undertake any obligation to correct or update the information or any statements
made therein. Certain statements in this presentation are forward-looking and are subject to risks and
uncertainties.
Nothing contained herein shall constitute any representation or warranty as to accuracy or
completeness. Boliden has not made any independent verification of the information obtained from
third parties.
Nothing in this material shall be construed as an offer or solicitation to buy or sell any security or
product, or to engage in or refrain from engaging in any transaction.
Boliden does not accept any liability whatsoever arising from or in connection with the use of this
information.
Save as by prior approval in writing, this material may not be copied, transmitted or disclosed, whether
in print, electronic or any other format. All rights to the material are reserved.
GENERAL PRESENTATION POST Q1 2021 38You can also read