Apex Frozen Foods Limited - 9MFY18 Investor Presentation
←
→
Page content transcription
If your browser does not render page correctly, please read the page content below
Investor Presentation

Apex Frozen Foods Limited

          9MFY18
Safe Harbor

      This presentation and the accompanying slides (the “Presentation”), which have been prepared by Apex Frozen Foods Ltd (the “Company”)
      solely for information purposes and do not constitute any offer, recommendation or invitation to purchase or subscribe for any securities, and
      shall not form the basis or be relied on in connection with any contract or binding commitment what so ever. No offering of securities of the
      Company will be made except by means of a statutory offering document containing detailed information about the Company.

      This Presentation has been prepared by the Company based on information and data which the Company considers reliable, but the Company
      makes no representation or warranty, express or implied, whatsoever, and no reliance shall be placed on, the truth, accuracy, completeness,
      fairness and reasonableness of the contents of this Presentation. This Presentation may not be all inclusive and may not contain all of the
      information that you may consider material. Any liability in respect of the contents of, or any omission from, this Presentation is expressly
      excluded. All product names, logos, and brands are property of their respective owners. All company, product and service names used in this
      presentation are for identification purposes only. Use of these names, logos, and brands does not imply endorsement.

      Certain matters discussed in this Presentation may contain statements regarding the Company’s market opportunity and business prospects
      that are individually and collectively forward-looking statements. Such forward-looking statements are not guarantees of future performance
      and are subject to known and unknown risks, uncertainties and assumptions that are difficult to predict. These risks and uncertainties include,
      but are not limited to, the performance of the Indian economy and of the economies of various international markets, the performance of the
      industry in India and world-wide, competition, the company’s ability to successfully implement its strategy, the Company’s future levels of
      growth and expansion, technological implementation, changes and advancements, changes in revenue, income or cash flows, the Company’s
      market preferences and its exposure to market risks, as well as other risks. The Company’s actual results, levels of activity, performance or
      achievements could differ materially and adversely from results expressed in or implied by this Presentation. The Company assumes no
      obligation to update any forward-looking information contained in this Presentation. Any forward-looking statements and projections made
      by third parties included in this Presentation are not adopted by the Company and the Company is not responsible for such third party
      statements and projections.

Investor Presentation 9MFY18                              Apex Frozen Foods Limited                                                            2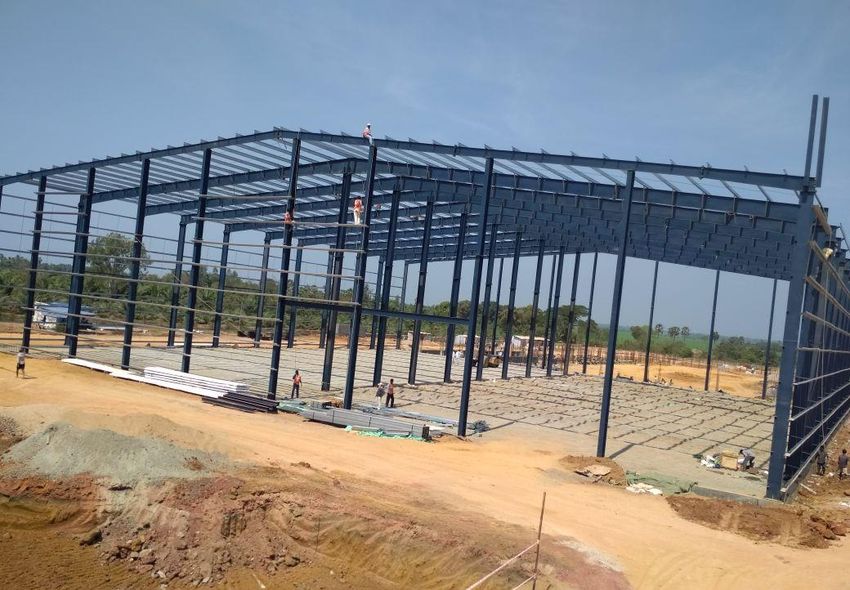
01
                Business Updates – 9MFY18

Investor Presentation 9MFY18   Apex Frozen Foods Limited   3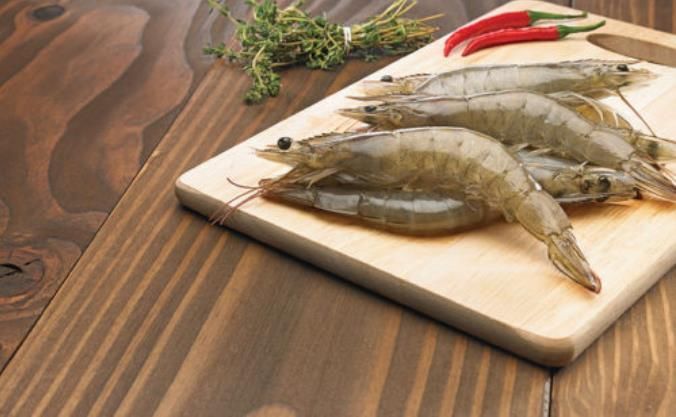
Completion Status of the New Project

   ▪    New shrimp processing facility at Ragampeta, East Godavari, Andhra Pradesh

   ▪    Total capacity of 20,000 MTPA: Ready-To-Cook - 15,000 MTPA and Ready-To-Eat - 5,000 MTPA

   ▪    Total planned capex: Rs 902 mn, of which, Rs 184 mn has been incurred as of end of Dec’17

    Current progress of the proposed processing facility

                                                                            ▪   Piling, plinth and structural works completed

                                                                            ▪   Pre-engineered sheets, insulated wall panels,
                                                                                roof panels are being installed

                                                                            ▪   Purchase orders for imported Machinery and
                                                                                few indigenous machinery have been placed

                                                                            ▪   Expect trial production in Q2FY19

Investor Presentation 9MFY18                    Apex Frozen Foods Limited                                                 4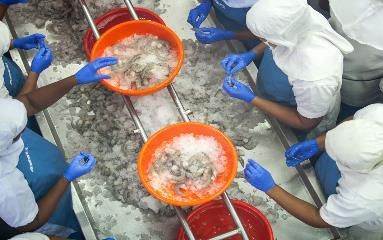
Key Operational Metrics

   Higher capacity (MTPA) with better utilisation led to…                                 …Increase in total sales (MTPA) in the current fiscal
                                                                                                                                       11,169
                                                                                                 9,898
                                         15,240                 15,240
             12,240                                                                                                  7,598

              FY17                       H1FY18                 9MFY18                           FY17               H1FY18            9MFY18

   Average realisation* (Rs/kg) improving on a YTD basis                                  Well diversified geographical mix
   *Calculated on Total Income (including forex fluctuations)
                                                                                                         USA   UK     EU (Other than UK)

                                                                                                10.6%               15.4%              15.1%
                                                                                                7.6%                7.9%               5.1%
                                                                 727
               717                          718                                                 81.8%                                  79.8%
                                                                                                                    76.7%

              FY17                       H1FY18                 9MFY18                           FY17               H1FY18            9MFY18

Investor Presentation 9MFY18                                      Apex Frozen Foods Limited                                                    5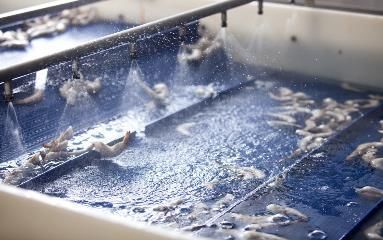
Profit & Loss Highlights

                 Standalone UFR (Rs mn)                     Q3 FY18       Q2 FY18       Q-o-Q %    9MFY18    9MFY17
                 Net sales                                      2,628        2,851          -7.8     7,955     5,351
                 Other income (forex fluctuations)                 43             71       -38.4      169        61
                 Total Income                                   2,672        2,922          -8.6     8,125     5,412
                 Raw material                                   1,843        2,244         -17.9     6,032     4,216
                 Change in inventories                             13            -232      105.5      -395      -122
                 Employee expenses                               115              91        26.8      285       204
                 Other expenses                                  358             439       -18.5     1,180      734
                 EBITDA                                          343             379        -8.4     1,023      381
                 EBITDA margin (%)                               12.9            13.0          -      12.6       7.0
                 Depreciation & amortisation                       24             24         0.7       66        50
                 EBIT                                            320             355       -10.0      957       331
                 EBIT margin (%)                                 12.0            12.1          -      11.8       6.1
                 Finance cost                                      20             28       -26.5       74        88
                 Profit before tax                               299             327        -8.6      883       243
                 Tax                                             111             107         3.7      292        80
                 Profit after tax                                188             220       -14.5      592       163
                 PAT margin (%)                                   7.1             7.5          -       7.3       3.0
                 Other comprehensive income                        47             -37      226.7       -10        -6
                 Total comprehensive income                      236             183        28.6      581       157

Investor Presentation 9MFY18                         Apex Frozen Foods Limited                                         6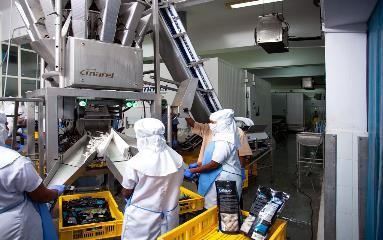
02
                Key Growth Drivers & Expansion

Investor Presentation 9MFY18   Apex Frozen Foods Limited   7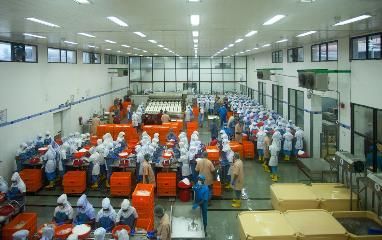
Global Seafood Industry – Overview

   Increased seafood intake globally, reflected in higher per capita consumption of seafood (kg)

                                                                                              ✓   Rising income level

                                                                                              ✓   Variety in product offering
                                                           20                                 ✓   Richer protein content
                      15

                     1995                                 2015
                                                                                              ✓   Favourable State policies like FTAs

   Source: FAO, CRISIL Research

   Seafood industry’s growth trajectory, led by rising share of Aquaculture – Production (mn tonne)

                                  Capture   Aquaculture
                                                                                              ✓ Total production grew at a CAGR of 3.3% over
                                                                                                2005-2015

                                                 69
                                                                  93                          ✓ Driven by 7% CAGR in aquaculture while
            18
                                  35                                                            capture fishery stagnated with a 1% CAGR
            70                    76             85               87                          ✓ The trend is expected to continue in favour of
                                                                                                aquaculture growth
          1995                2005             2015              2020P
   Source: FAO, CRISIL Research
Investor Presentation 9MFY18                                      Apex Frozen Foods Limited                                               8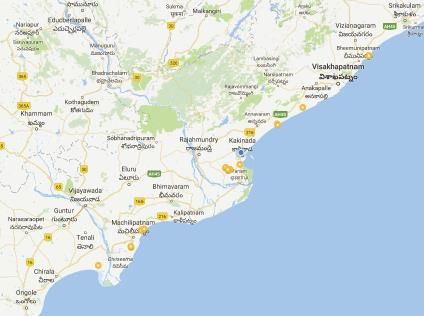
Global Demand-Supply Scenario, Favourable for India

      Demand: Top 5 importing countries, forming ~50%                             Supply: Asia forms ~92% of total aquaculture production

                                                                                       69.6%
                                                                                       15.0%
                                                                   2015                     67.7%                                                2015
                                                                                            14.7%
         20-22%                                                    2020P                                                                         2020P
     18.0%
                                                                                                           9.9%

                                                                                                     7.8%
                     11.0%                                                                                        6.8%6.7%
                                     9-11%
                         8-10%   9.0%
                                                                                                                              5.2%
                                             7.0%                                                                                 4.8%
                                                    5-7%          5-7%
                                                           5.0%                                                                          3.0%3.0%

        USA             Japan     China       Spain        Thailand                      China          India     Indonesia   Vietnam    Bangladesh

           Rising demand for Shrimp and Tuna in the                                         India is gaining market share on the back
           USA is driving its market share increase in                                      of its quality output at competitive prices;
           consumption, globally                                                            It is the largest exporter of shrimp to USA

     Source: CRISIL Research                                                       Source: FAO, CRISIL Research

Investor Presentation 9MFY18                               Apex Frozen Foods Limited                                                         9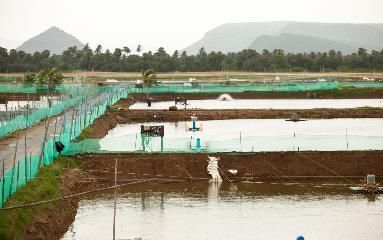
India’s Growth in Aquaculture Exports and Farming

           India’s exports on a rise – FY17 (lakh tonnes)                                         Frozen shrimp exports by India
                                                                                                                        3.7                   3.7
                      11.34                                                         CAGR – 18%
                                                    Total Seafood
                                                                                                           3.2                        3.1
                    (20% yoy)
                       4.34
                    (16% yoy)                       Frozen Shrimp                                 1.8
                                                                                    1.7

                                                                                    189           229      301          358           374     434
                       3.29
                                                     L. Vannamei
                    (28% yoy)                                                       FY12         FY13     FY14          FY15          FY16   FY17

                                                                                                          '000 tonnes          $ bn

    Source: MPEDA                                                               Source: MPEDA

                        Significant potential for scaling up shrimp farming in India – Area under culture (‘000 hectares)

                                                                                                                 Strong growth in
                                                                                                                 FY17 but the area
                                                                                                                 under culture still
                                                                                                                 forms only 12-14% of
                                                                                                                 the     total    area
                                                                                                                 suitable for shrimp
                           119            139             131             141              168                   farming in India
                           FY13           FY14           FY15            FY16              FY17
    Source: MPEDA

Investor Presentation 9MFY18                            Apex Frozen Foods Limited                                                            10
Planned Expansion, to Cater the Growing Demand
• New processing plant in Ragampeta, East Godavari, with a total capacity of 20,000 MTPA, of which;
• 5,000 MTPA will be towards Ready-To-Eat (Value Added Products)
• The plant will have a cold storage capacity of 5,000 pallets
• The plant is expected to be commissioned in Q2FY19
• Meanwhile, leased capacity has been enhanced from 3,000 MTPA to 6,000 MTPA, effective from 1st Apr’17
Capacity expansion, to cater the growing demand – MTPA capacity, % utilisation
Owned Leased
90%
6,000
84% 81%
78%
29,240
3,000 3,000 6,000
1,500
-
7,821 9,240 9,240 9,240 9,240
FY14 FY15 FY16 FY17 FY18E FY19E
Investor Presentation 9MFY18 Apex Frozen Foods Limited 11Backward Integration, to Ensure Quality and Cost Control
Hatchery Operations
Adding a new Hatchery, which will
increase the total breeding capacity to Farming Initiatives
~ 1.4 bn seeds from ~1 bn seeds
currently In-housing farming, currently on
~1,800 acres (owned + leased)
Focusing on enhancing farm yields by
employing better techniques
Backward integration allows flexibility in shaping production plan based on customers’ needs
Investor Presentation 9MFY18 Apex Frozen Foods Limited 1203
Our Core Strengths
Investor Presentation 9MFY18 Apex Frozen Foods Limited 13Integrated Operations Enable Economies of Scale
Packaging
Farming
• 3 Hatcheries with • Cold storage unit
a total breeding • Total capacity of • Packaging of finished – 1,500 MT
• ~1,800 acres of land 15,240 MTPA product, as per
capacity of over 1 • Transportation
• Owned – 110 acres • Owned - 9,240 MT customer
bn SPF* seed via owned reefer
• Leased – 1,690 acres • Leased – 6,000 MT requirements in fleet
• Forms 18-20% of retail, food service
total RM required and private label
Hatchery Processing brands Logistics
Leading Producer-Exporter of processed, ready-to-cook, Shrimp in India
* Specific Pathogen Free
Investor Presentation 9MFY18 Apex Frozen Foods Limited 14Investor Presentation 9MFY18 Apex Frozen Foods Limited 15
Strategically Located – Close to Farms as well as Ports

                               Andhra Pradesh accounts for ~70% of the total shrimp farming in India

                                                                                    Our facilities are in proximity to one
                                                                                    another, enabling smooth transition of
                                                                                    products to the next stage

                                                                                     ▪ 10 - 200 kms from the farms

                                                                                     ▪ ~20 kms from Kakinada port
                                                                                     ▪ ~150 kms from Vishakapatnam port

                                                      Processing Plant

                                                      Hatchery and Farm Locations

Investor Presentation 9MFY18                      Apex Frozen Foods Limited                                           16
Long Standing Relationships with Reputed Brands
Our key distributors… …The end customers (Retail/Food Service Companies)
Chicken of the Sea Walmart WinCo
frozen foods FOODS
OCEAN WORLD Kroger
VENTURES
Sysco
US.
Pacific Seafood FOODS
Long-standing relationship directly with customers - one of the significant growth factors
Investor Presentation 9MFY18 Apex Frozen Foods Limited 17Quality Control Certifications act as Entry Barrier Investor Presentation 9MFY18 Apex Frozen Foods Limited 18
Founded by Promoters with Extensive Experience …

          Industry knowledge, relationships and experience of the founders has enabled sustained growth

                         Karuturi Satyanarayana Murthy, Chairman and Managing Director
                         ▪     Founding Promoter of the company and has an experience of over 20 years in aquaculture industry
                         ▪     Responsible for making strategic decisions and decisions relating to business development and
                               overall administration
                         ▪     Active member of the Rotary International Club

                         Karuturi Subrahmanya Chowdary, Executive Director
                         ▪     Promoter of the company with experience of 12 years in aquaculture industry.
                         ▪     Played a significant role in the development of our business
                         ▪     Involved in the business operations and marketing activities of our Company.

Investor Presentation 9MFY18                        Apex Frozen Foods Limited                                            19
… Supplemented by a Strong First Line of Management
Deep knowledge and operational experience makes the first line of management strong
Ch Vijaya Kumar, G. V. Raghava Raju, H. Rajashekhar, DR. T. Rambabu
Chief Financial Officer Purchase Manager Operations Manager Farms In-charge
• Aged 41 years, is a • Aged 46 years, he ▪ Holds a degree in ▪ Aged 43 years, holds
CA with a B.Com has 25 years of Bachelor of Fisheries a Ph.D on Microbial
from Andhra experience as a Sciences from Diseases of Shrimp
University Purchase Manager University of and Pond
Agriculture Sciences, Environmental
• Handles the finance • Responsible for Bangalore and an Quality, ICAR SRF
function for the qualitative raw MBA in Intl Business project fellowship
Company material at and M.Sc. In
competitive prices • Has over 20 years of Aquaculture
from farms in and work experience in
around Andhra sea-food processing • Has a strong
Pradesh industry research background
Investor Presentation 9MFY18 Apex Frozen Foods Limited 2006
Annual Financial Highlights
Investor Presentation 9MFY18 Apex Frozen Foods Limited 21Robust Growth in Revenue and Profits…
Total Income (Rs mn) EBITDA (Rs mn) & Margin (%) PAT (Rs mn) & Margin (%)
FY13 2,553 FY13 8.7% 222 FY13 3.7% 94
FY14 5,143 FY14 6.3% 325 FY14 2.6% 134
FY15 6,040 FY15 6.3% 378 FY15 3.1% 186
FY16 6,082 FY16 7.5% 454 FY16 3.2% 197
FY17 7,095 FY17 7.8% 557 FY17 3.5% 249
Margin expansion led by growing
Grown at a CAGR of 29% in-house farming and share of VAP Grown at a CAGR of 28%
Note: The above data is as per Restated Financials of the Company
Investor Presentation 9MFY18 Apex Frozen Foods Limited 22…Led by Strong Financial Discipline, Leading to…
Net Debt to Equity (x) Working Capital (Days) Book value (Rs/share)
FY13 2.36 FY13 75 FY13 16
FY14 1.95 FY14 48 FY14 19
FY15 1.53 FY15 54 FY15 23
FY16 0.99 FY16 51 FY16 31
FY17 1.04 FY17 60 FY17 40
Improved D/E led by… …largely stable working capital… …and growing surplus profits
Note: The above data is as per Restated Financials and based on calculation as follows:
1. Net D/E = (Total debt – Cash & equivalents)/Networth 2. WC days = Inventory days + Debtor days – Creditor days 3. BVPS = Networth/Total no. of outstanding shares
Investor Presentation 9MFY18 Apex Frozen Foods Limited 23…Enhanced Profitability for Stakeholders
Return on Net Worth (%) Return on Capital Employed (%)
FY13 38.6% FY13 13.7%
FY14 43.1% FY14 15.7%
FY15 39.6% FY15 16.2%
FY16 30.0% FY16 15.4%
FY17 29.0% FY17 14.7%
Consistently generating high Return Ratios
Note: The above data is as per Restated Financials and based on calculation as follows:
1. RoNW = PAT/Average Networth*100 2. RoCE = EBIT*(1-tax rate)/Average Capital Employed*100
Investor Presentation 9MFY18 Apex Frozen Foods Limited 24Profit & Loss Highlights Profilt & Loss (Rs mn) FY13 FY14 FY15 FY16 FY17 Total Income 2,553 5,143 6,040 6,082 7,095 Raw Material 1,895 4,013 4,890 4,675 5,492 Manufacturing cost 151 225 270 406 513 Employee Expenses 104 226 258 233 249 SG&A Expenses 180 353 244 314 284 EBITDA 222 325 378 454 557 EBITDA Margin (%) 8.7 6.3 6.3 7.5 7.8 Depreciation 25 45 4 49 63 Other Income 2 3 3 1 2 Interest 56 80 96 104 112 Profit Before Tax 143 204 282 302 384 Tax 49 70 96 105 135 Profit After Tax 94 134 186 197 249 PAT Margin (%) 3.7 2.6 3.1 3.2 3.5 Note: The above data is as per Restated Financials of the Company Investor Presentation 9MFY18 Apex Frozen Foods Limited 25
Balance Sheet Highlights

   Standalone (Rs mn)                               FY15               FY16      FY17            Standalone (Rs mn)            FY15    FY16         FY17
   Shareholder’s Funds                                 560              753       968
                                                                                                 Non-current assets             523     632          857
   Share capital                                       240              240       240
                                                                                                 Gross block                    599     756         1,023
   Reserves & Surplus                                  320              513       728
                                                                                                 Less: acc. Depreciation         76     124          187
   Non-current liabilities                             103              131       225
                                                                                                 Net block                      523     632          836
   Long term borrowings                                 94              119       210

   Deferred tax liability                                 8              10         15           Other non-current assets          -      1           21

   Long term provisions                                   1               2          -           Current Assets                1,128   1,156        1,717

   Current liabilities                                 989              904      1,382
                                                                                                 Inventories                    503     596          638
   Short term borrowings                               777              642       847
                                                                                                 Trade receivables              502     415          828
   Trade payables                                      115              161       309
                                                                                                 Cash & cash equivalents         16      18           46
   Other current liabilities                            35               31         44
                                                                                                 Short term loans & advances    107     127          205
   Short term provisions                                61               70       181

   Total Laibilities                                1,651              1,788     2,574           Total Assets                  1,651   1,788        2,574

   Note: The above data is as per Restated Financials of the Company

Investor Presentation 9MFY18                                              Apex Frozen Foods Limited                                            26
For further information, contact:
Mr. Subhramanya Choudary
Ms. Pooja Sharma
Executive Director
pooja.sharma@stellar-ir.com
ir@apexfrozenfoods.com
Investor Presentation 9MFY18 Apex Frozen Foods Limited 27You can also read