FY 2017 Results Presentation - Milan, March 9th 2018 - Prada Group
←
→
Page content transcription
If your browser does not render page correctly, please read the page content below

FY 2017 Results Presentation
      Milan, March 9th 2018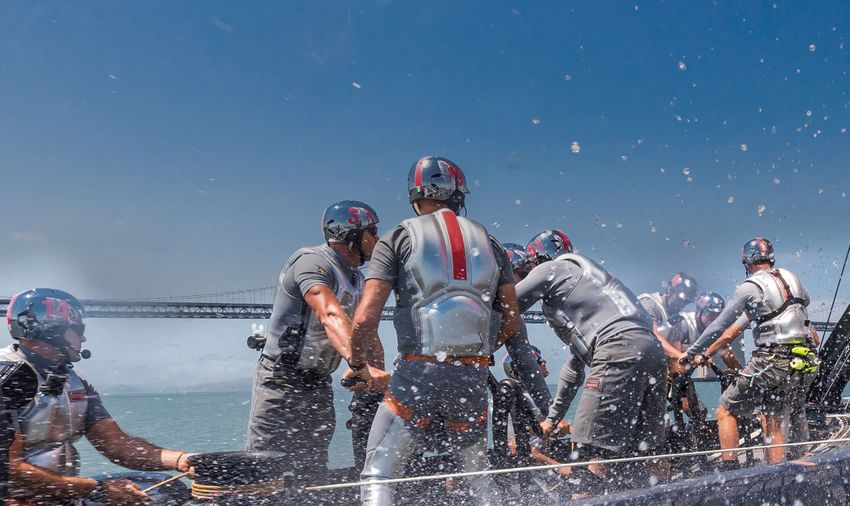
Agenda

       Presentation
       14:00 – 14:30

               Patrizio Bertelli – CEO
               • 2017 Overview

               Alessandra Cozzani – CFO
               • FY 2017 Financial Review

               Patrizio Bertelli – CEO
               • Business Update

               Chiara Tosato – Prada General Manager and Digital Director
               • Digital Transformation

               Patrizio Bertelli – CEO
               • Outlook

       Q&A Session
       14:30 – 15:00

FY 2017 Results Presentation – March 9th 2018                               1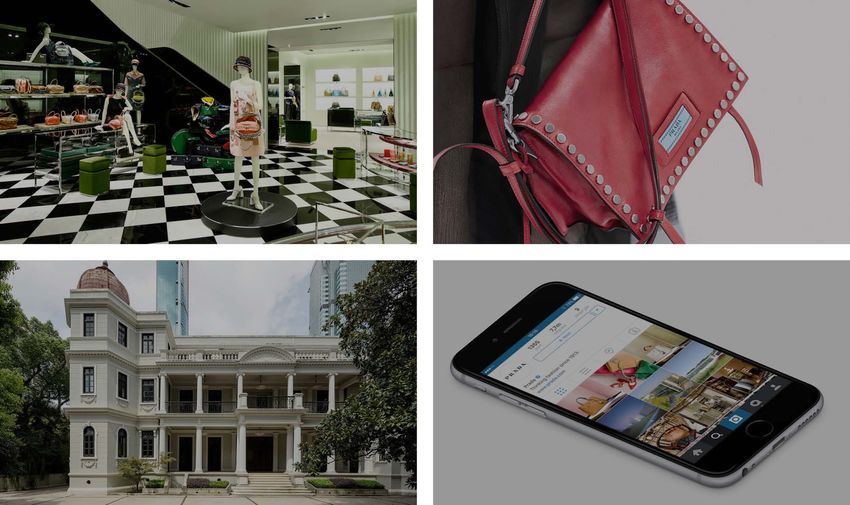
2017 Overview
                                                 Patrizio Bertelli
                                                       CEO

FY 2017 Results Presentation – March 9th 2018                        2
2017 Overview
                                 Successful transformation gathering momentum

     Business transformation gathered pace during 2017 with clear positive effects
     seen in the second part of the year and continuing into 2018

     Thanks to our ongoing strategic initiatives, signs of turnaround are now evident

        • Sequential improvement across all regions during 2017

        • Success of latest leather goods collections

        • Positive performance of RTW demonstrating our leadership position in design and innovation

        • Strong growth in Wholesale mainly driven by e-tailers

FY 2017 Results Presentation – March 9th 2018                                                          3
2017 Financial Review
                                                   Alessandra Cozzani
                                                          CFO

FY 2017 Results Presentation – March 9th 2018                           4
FY 2017: at a glance
                                                       A year of stabilization
Condensed P&L

 €m                                                               FY 17 (*)            FY 16 (*)     % change

 Net Revenues                                                     3,056.5             3,170.5        -3.6%
 Gross Margin                                                     73.5%                72.0%
 EBITDA                                                           588.0                    634.5     -7.3%
 EBITDA Margin                                                    19.2%                20.0%
 EBIT                                                             360.0                    405.6     -11.2%
 EBIT Margin                                                      11.8%                12.8%
 Net Income                                                       248.9                    260.2     -4.3%
 Net Income margin                                                 8.1%                    8.2%

• Net Revenues down by 2% at constant FX, showing a positive trend in the second part of the year
   (+1% at constant FX and -3% reported)
• Improved quality of sales and supply chain efficiencies delivering higher Gross Margin
• Operating Expenses well under control despite continuing investment in digital and communication
• Net income broadly in line year on year
(*) Pro-forma 12 months January – December unaudited

FY 2017 Results Presentation – March 9th 2018                                                                   5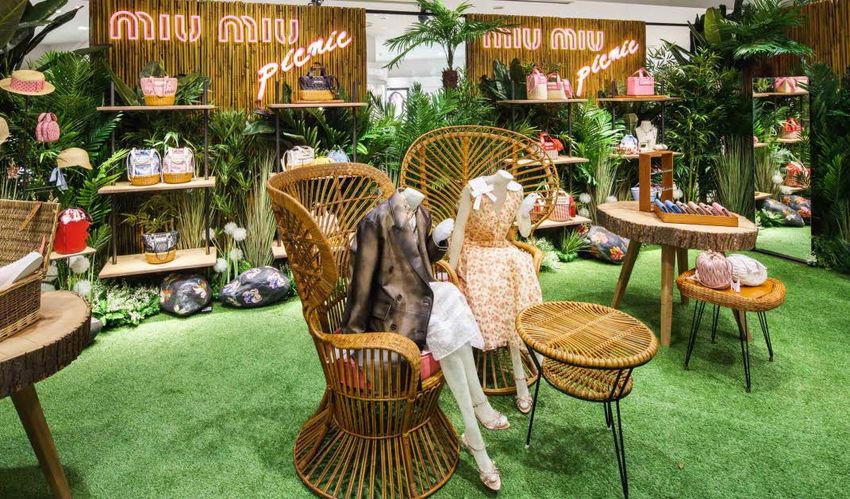
FY 2017: at a glance
                                                 Sound financial structure
Condensed Balance Sheet and Cash Flow
  €m                                                                             31 Dec 17   31 Jan 17
 Non current assets                                                                2,565      2,600
 Net operating working capital                                                     546         556
 Other current assets / (liabilities), net                                         (21)        51

 Other non current assets / (liabilities), net                                     (121)      (121)

 Net invested capital                                                              2,970      3,086
 Consolidated shareholders’ equity                                                 2,866      3,105
 Net financial position (surplus)/deficit                                          104         -18

 Equity + Net Financial Position                                                   2,970      3,086

 Operating cash flow                                                             447 (*)       632
 Capital expenditure                                                             251 (*)       251

• Strong operating cash flow
• Working capital in line with last year and Capex remains fully self-financed

(*) 11 months

FY 2017 Results Presentation – March 9th 2018                                                            6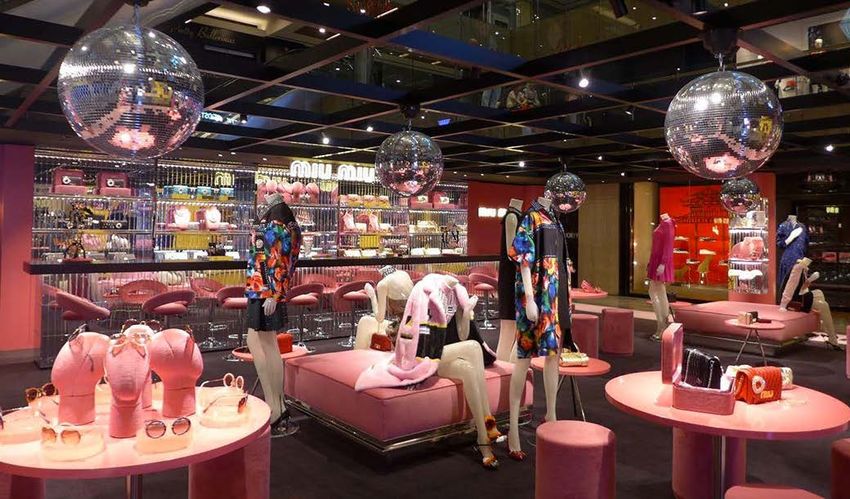
Net sales by Channel
                                        Sequential improvement across the year

 % change same FX                                  Jan             Feb-July              Aug-Dec    FY 17

 Retail                                            -7%               -8%                    -3%     -6%

 Wholesale                                        +39%               +4%                   +34%     +19%

 Total                                            +4%                -6%                   +1%      -2%

Retail
• Underlying trends sequentially improved in Aug-Dec17
• Partially impacted by ongoing reduction in markdown sales

Wholesale
• Strong performance also with the contribution from existing and new partnerships with e-tailers

FY 2017 Results Presentation – March 9th 2018                                                               7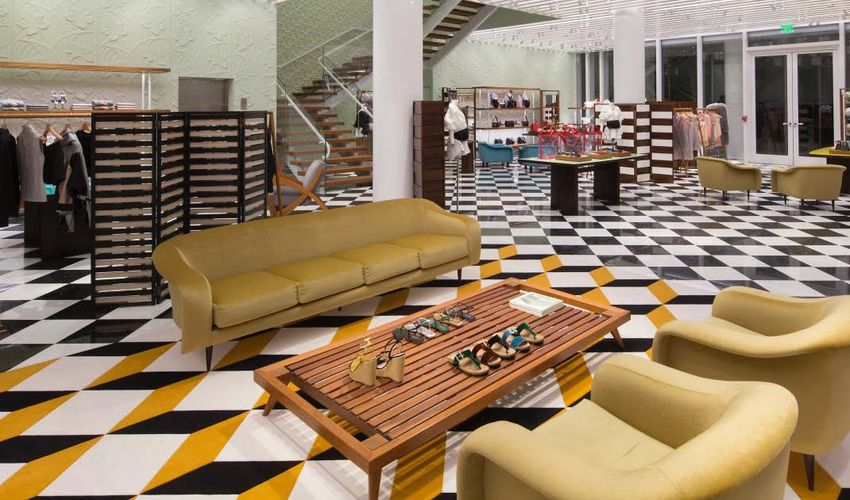
Net sales by Geography
                              All regions improved - Greater China the bright spot

  % change same FX                                  Jan         Feb-July              Aug-Dec               FY 17

 Europe                                                            -7%                  +6%                  0%
 Far East                                                          -1%                  +1%                 +1%
       Greater China                                               +5%                  +10%                +8%
 Americas                                                          -6%                   -3%                -4%
 Japan                                                            -14%                   -6%                -11%
 Middle East                                                      -13%                   -3%                -9%
 Others                                                           -29%                   -2%                -13%
 Total                                              +4%            -6%                  +1%                 -2%

Europe
  • Improvement in Aug-Dec17 driven by Wholesale
Far East
  • Double digit organic growth in Aug-Dec17 in Greater China, including HK and Macau
Americas
  • US improved particularly towards the end of the year thanks to stronger local consumption
Japan and Middle East
  • Declining trends significantly mitigated in Aug-Dec17 thanks to improving tourism and domestic demand

FY 2017 Results Presentation – March 9th 2018                                                                       8
Net sales by Product
                                           Encouraging trends across categories

  % change same FX                                   Jan             Feb-July   Aug-Dec   FY 17

 Leather Goods                                                         -8%        0%      -3%
 Ready to Wear                                                        +4%        +10%     +7%
 Footwear                                                              -9%       -4%      -7%
 Other                                                                +6%        -5%      -1%
 Total                                               +4%               -6%       +1%      -2%

Leather goods – encouraging trends
  •    Trends turned positive in Aug-Dec17 at Prada in key regions
  •    Success of latest collections and iconic lines

Ready to wear – very positive performance continuing
  •    Positive trends for both Prada and Miu Miu
  •    Acceleration in the second part of the year

Footwear – sales contraction mitigated
  •    Successful launch of sneakers for both men and women

FY 2017 Results Presentation – March 9th 2018                                                     9
Net sales by Brand
Prada resuming growth
% change same FX Jan Feb-July Aug-Dec FY 17
Prada -5% +4% 0%
Miu Miu -10% -10% -9%
Church’s -10% -8% -8%
Other +12% +2% -4%
Total +4% -6% +1% -2%
Prada
• Organic trends improved in the second part of 2017 driven by all categories
Miu Miu
• 12 strategic closures and 90 renovation projects realized in 2017 had a temporary impact on sales, while
positioning Miu Miu for recovery in 2018
• Sustained growth in RTW
Church’s
• Temporary impact of Wholesale network restructuring
FY 2017 Results Presentation – March 9th 2018 10Gross margin development
Boosted by better quality of sales
73.5%
72.0% +0.7%
+0.8%
FY 2016 Full price Other FY 2017
• Strong gross margin development supported by higher contribution from full-price sales
• Additional contributions from forex and industrial efficiencies
FY 2017 Results Presentation – March 9th 2018 11Operating costs
Investing in the brand within a streamlined cost structure
Operating expenses (€m)
+0.5% -20
+7
+12 1,886
1,876 1,886 +10
171 1,876
191
123 130
173 185
1,389 1,399
H1 16
FY H117
FY 17 FY 16 Selling A&P PD G&A FY 17
Selling Advertising & Promotion Positive Change Negative Change
Product Development G&A
• Operating expenses broadly in line yoy
• Effective cost management despite increasing expenses in advertising and digital
FY 2017 Results Presentation – March 9th 2018 12Capex
Investing in quality and new store concepts to enhance customer experience
Capex (€m)
251 (*) 251 (**)
100
141
151
110
2017 2016
Corporate&Industrial Retail
• 2 net openings in 2017 - 25 openings and 23 closures
• 140 renovation and relocation projects
• Increased investments in production to safeguard quality and strengthen know-how
(*) 11 months ; (**) 12 months
FY 2017 Results Presentation – March 9th 2018 13Cash flow
Operating cash flow (€m) Net working capital (€m)
As % of net sales
20% 17% 18% 18%
674 556 553 546
625 527 563 570
365
267 239
208
314 286 267 290
H1 16 H2 16 H1 17 5-months 17
-265 -256 -277 -314
Jul 31, 2016 Jan 31, 2017 Jul 31, 2017 Dec 31, 2017
• Consistently strong operating cash flow Trade Receivables Trade Payables Inventory
• Working capital management well under control
• Normalization of inventory level in 2017
FY 2017 Results Presentation – March 9th 2018 14Net financial position
(€m)
210 (212)
10
218 (308)
18
NFP Net Income Net Operating D&A Capex Dividends Other NFP
Jan-17 Working Capital Jul-17
Dec-17
(104)
(40)
Positive Change 11 months
Negative Change 11 months
FY 2017 Results Presentation – March 9th 2018 15Dividend policy
(€m) 307
281 281 281
230
192
2012 2013 2014 2015 2016 2017
Dividend
payout (%) 37% 45% 62% 85% 111% 88% (*)
Dividend 7.5
per share (€ cents) 9 11 11 11 12
(*) based on 11 months
FY 2017 Results Presentation – March 9th 2018 16Business Update
Patrizio Bertelli
CEO
FY 2017 Results Presentation – March 9th 2018 17Several factors have contributed to business recovery
RETAIL MERCHANDISING
The focal point for Brand integrity
Customer interactions delivering results
UNLOCKING
VALUE FROM
RETAIL
NETWORK
COMMUNICATION DIGITAL
Targeting a global audience Digital transformation driving growth
FY 2017 Results Presentation – March 9th 2018 18Retail
The focal point for customer interactions
Leveraging our best-in-class digitally integrated
store network remains our key priority
• Optimization of global retail portfolio ongoing
- 25 store openings and 23 closures
- 140 renovation and relocation projects
• Investment in store experiences
- Roll-out of more than 75 pop-up stores
with unique aesthetic expressions across
all brands
- Digital retail: improved CRM interactions
through the introduction of new in-store
digital tools
• Introduction of new concept stores with different
architectural designs (i.e. Miami)
FY 2017 Results Presentation – March 9th 2018 19Retail
Pop-up stores building excitement and customer engagement
• Roll-out of 75 pop-up stores in 2017
to target new customer segments through
unconventional selling propositions
• Complemented by engaging social media campaigns to
drive discussion among key influencers and customers
• Key benefits:
• Widen the client base: more than 50% of purchases
made by new customers
• Strong brand statement translated into a wider
brand awareness
• Communicate product novelties in an innovative
way
• Drive traffic/sales to neighbouring stores benefitting
from the buzz generated by the pop-ups
• Prada Silver Line concept well received and to be
further developed in 2018
FY 2017 Results Presentation – March 9th 2018 20Merchandising
Brand integrity delivering results
• Leather goods - balance between iconic and newness
achieved
– Widening product offering in all strategic price ranges
– Reinterpretation of iconic products (Galleria,
Black Nylon) conveyed by strong digital campaigns
– Successful take off of new lines:
Etiquette, Elektra, Monochrome, Diagramme
– Strong performance of Viaggio
– More localized merchandising strategy
– Prada turned positive in the second part of the year
• RTW – consistently strong performance demonstrating
design leadership
– Positive trends for both Prada (men and women)
and Miu Miu
– Successful reception of Resort Collection
– New lifestyle propositions
– Increased focus on MtM for formal items for men
• Footwear – recovery on track
– Successful launch of new sneakers
(i.e. Prada Cloudbust) for both men and women
driving volume
FY 2017 Results Presentation – March 9th 2018 21Communication
Targeting a global audience
Prada Rong Zhai
• A historical residence, dating 1918 and designated as a cultural patrimony of the Jing’an
district in Shanghai, was brought to its original splendor and magnificence following a long,
painstaking restoration process undertaken by Prada
• Opening celebrated in October with a fashion show of the Prada Resort 2018 collection as well
as an exhibition dedicated to the restoration work. Pre-order event followed in December
• Gained a hugely successful following on social media
FY 2017 Results Presentation – March 9th 2018 22Communication
Targeting a global audience
Prada Double Club Miami
• The “Prada Double Club Miami” by Carsten Höller is an art installation to be experienced
as a fully-functioning nightclub
• Opened in December in occasion of the new Prada concept store opening during Art Basel
Miami Beach
• Unique approach to entertainment and hospitality, creating a dialogue between
contemporary art, music, lifestyle and design
FY 2017 Results Presentation – March 9th 2018 23Communication
Targeting a global audience
Luna Rossa – America’s Cup
• Entered in sponsorship agreement for the participation of Luna Rossa sailing team in the
36th edition of the America’s Cup
• The cup will consist of a preliminary series (to take place in 2019-2020), the challenger
selection series (to take place in January/February 2021) and the America’s Cup match
(to take place in the first half of 2021) providing global brand exposure with accompanying
events and social media campaign
• First time role for Prada as naming and presenting sponsor of the entire sailing competition
providing additional brand exposure
FY 2017 Results Presentation – March 9th 2018 24Digital Transformation
Chiara Tosato
Prada General Manager and Digital Director
FY 2017 Results Presentation – March 9th 2018 25Digital transformation driving growth
E-commerce roll-out on track
• Launched new omnichannel e-commerce platform • Platform on track for global roll-out by year-end
Prada.com in China • Improved online presence across all brands
• Growing relationships with premium e-tailers
- Enhanced online services
- Shipping from main Prada stores • Planning a direct presence on major marketplaces
worldwide
- Pick-up in store
- Book an appointment in store, virtual assistant, • Double digit growth in sales, both direct as well as
chat option, “shop the look” on e-tailers
- Improved and simpler navigation with a
“mobile first” approach
- Wider product choice for all product categories
for men and women
- Integrated with social WeChat and Alipay
FY 2017 Results Presentation – March 9th 2018 26Digital transformation driving growth
Digital retail
• The path to digital transformation in Retail started in 2016 pursuing these
goals:
- Engage with customers to offer tailored experiences across all
touchpoints
- Empower employees to deliver personalized services
- Optimize in-store operations to increase efficiency
• We have equipped all our sale assistants with “personal” digital devices
to interact with our customers in a more effective and trustworthy way
• More than 200,000 customized personal messages sent by our sales
assistants every month to inform our customers of the latest arrivals
• Launch in 2018 of a “Big Data” project with Microsoft, to improve our
analysis and business intelligence capabilities. This new project will
enable us to consolidate our customer relations through further
personalization of our customer’s experience
FY 2017 Results Presentation – March 9th 2018 27Digital transformation driving growth
Investing in digital communications
Increased investment in digital communications to deliver
a consistent message across all channels
• Digital advertising represents an increasing portion of media
spending
• Creative content to support “pop-up” stores
Successful launch of digital campaigns
• Digital only campaigns to attract younger and new
audiences
- The Postman’s Gifts most viewed-ever video in Prada’s
history with millions of viewers
- Prada Black Nylon
- Miu Miu Women Tales
- Miu Miu Whispers
Strategy is delivering results
• Successful sales driver in particular in leather goods and
sneakers
• Addressing younger audiences, seeing growth in Gen Y
FY 2017 Results Presentation – March 9th 2018 28Outlook
Patrizio Bertelli
CEO
FY 2017 Results Presentation – March 9th 2018 29Outlook
Looking back. Walking forward.
• The recent performance of the Group is the result of
our strategic initiatives aimed at meeting customers’
expectations while respecting the iconic heritage of
our world renowned brands; that’s the "Prada way" to
compete in the current fast-changing environment
• We’ll continue to nurture our creativity with our
unique way to observe contemporary society and to
interpret market trends
• We’ll focus on improving the productivity of our global
retail network further strengthening integration
between offline and online offering a seamless
experience
• We’ll continue investing in brand equity through
unconventional communication tools conveying our
value and vision in a unique experience
• 2018 will be the beginning of a new chapter of the
Group’s history based on long term sustainable
growth
FY 2017 Results Presentation – March 9th 2018 30Q&A SESSION
APPENDIX

FY 2017 Results Presentation – March 9th 2018              32
Retail overview - 625 Dos at 31 Dec 17
                                                            2 Net openings yoy

                                                             EUROPE: 229 (+9)               JAPAN: 79 (+1)

                                                                                 ASIA (EX-JAPAN): 184 (-4)
              AMERICA 112 (-3)

                                                                  MIDDLE EAST AND
                                                                   OTHER : 21 (-1)

Note: Total of 625 Dos includes 3 Marchesi shops in Italy

FY 2017 Results Presentation – March 9th 2018                                                                33
Group P&L €m FY 2017 (*) FY 2016 (*) % change Net Sales 3,008.3 98.4% 3,126.0 98.6% Royalties 48.2 1.6% 44.4 1.4% Net Revenues 3,056.5 100.0% 3,170.5 100.0% -3.6% COGS (810.9) 26.5% (888.8) 28.0% Gross Margin 2,245.6 73.5% 2,281.7 72.0% -1.5% Design & Product Development (130.5) 4.3% (123.5) 3.9% Advertising & Promotion (184.7) 6.0% (173.0) 5.5% Selling (1,399.3) 45.8% (1,389.0) 43.8% G&A (171.1) 5.6% (190.6) 6.0% Operating Expenses (1,885.6) 61.7% (1,876.1) 59,2% +0.5% EBIT 360.0 11.8% 405.6 12.8% -11.2% Net Financial Income (Expenses) (5.0) 0,2% (17.0) 0.5% Income Taxes (105.3) 3.4% (122.4) 3.9% Tax rate% 29.7% 31.5% Group Net Income 248.9 8.1% 260.2 8.2% -4.3% D&A 228.0 7.5% 228.9 7.2% EBITDA 588.1 19.2% 634.5 20.0% -7.3% (*) Pro-forma 12 months January – December unaudited FY 2017 Results Presentation – March 9th 2018 34
Net Sales by Channel
                                                                                       % change     % change
     €m                               FY 2017 (*)                FY 2016 (*)          as reported   same FX

    Retail                       2,444                 81%    2,649            85%       -8%          -6%
    Wholesale                     564                  19%    477              15%      +18%         +19%

    Total                        3,008                 100%   3,126            100%      -4%          -2%

(*) Pro-forma 12 months January – December unaudited

FY 2017 Results Presentation – March 9th 2018                                                                  35
Net Sales by Geography
% change % change
€m 2017 (*) 2016 (*)
as reported same FX
Europe 1,170 39% 1,182 38% -1% 0%
Far East 973 32% 984 31% -1% +1%
Greater China 645 21% 618 20% +5% +8%
Americas 432 14% 456 15% -5% -4%
Japan 337 11% 394 13% -15% -11%
Middle East 93 3% 105 3% -11% -9%
Others 4 0% 5 0% -10% -13%
Total 3,008 100% 3,126 100% -4% -2%
(*) Pro-forma 12 months January – December unaudited
FY 2017 Results Presentation – March 9th 2018 36Net Sales by Product
% change % change
€m 2017 (*) 2016 (*) as reported same FX
Leather Goods 1,703 56% 1,793 57% -5% -3%
Ready to Wear 625 21% 593 19% +5% +7%
Footwear 624 21% 682 22% -8% -7%
Others 57 2% 58 2% -3% -1%
Total 3,008 100% 3,126 100% -4% -2%
(*) Pro-forma 12 months January – December unaudited
FY 2017 Results Presentation – March 9th 2018 37Net Sales by Brand
% change % change
€m 2017 (*) 2016 (*) as reported same FX
Prada 2,461 82% 2,512 80% -2% 0%
Miu Miu 459 15% 515 16% -11% -9%
Church’s 71 2% 81 3% -12% -8%
Other 17 1% 18 1% -5% -4%
Total 3,008 100% 3,126 100% -4% -2%
(*) Pro-forma 12 months January – December unaudited
FY 2017 Results Presentation – March 9th 2018 38You can also read