Siltronic Investor Presentation - October/November 2018 - Siltronic AG

Page created by Philip Long
 
CONTINUE READING
Siltronic Investor Presentation - October/November 2018 - Siltronic AG
Siltronic Investor Presentation

October/November 2018

                                  © Siltronic AG 2018
Siltronic Investor Presentation - October/November 2018 - Siltronic AG
MARKET UPDATE

                © Siltronic AG 2018
Siltronic Investor Presentation - October/November 2018 - Siltronic AG
Increasing silicon demand supported by 1 stable and 4 growing
end applications

Wafer demand, in bn cm², 2017/2018 expected growth, in %
                        +8%                                                                                                                                                         +6.8%

                                                   -1%
                                                                          +10%                      +33%
                            20,8                                                                                                                                                             77,8
                    19,3                                                                                                      +5%                                                72,8

                                              11,3 11,2
                                       9,4                               8,8     9,7                         9                                                       33,6
                                                                                                   6,8                       6,5     6,8
                                                                 5,6
             2,5                                                                            0                        2,1

               Mobiles /                  Desktop,                   Industrial              Solid State               Automotive                                          Total market
              smartphones                 notebook                                             Drives
                                        & server PCs                                           (SSD)

                                                         2000        2017        2018e                                                                           2000        2017         2018e

Source: Data based on IHS Markit, Technology Group, Semiconductor Silicon Demand Forecast Tool, Q3 2018. Results are not an endorsement of Siltronic. Any reliance on these results is at the third party’s
own risk. Visit technology.ihs.com for more details.

                        Siltronic Roadshow Presentation                                                                                                    ® Siltronic AG 2018
                        October / November 2018
                                                                                                                                                                                                 3 of 37
Siltronic Investor Presentation - October/November 2018 - Siltronic AG
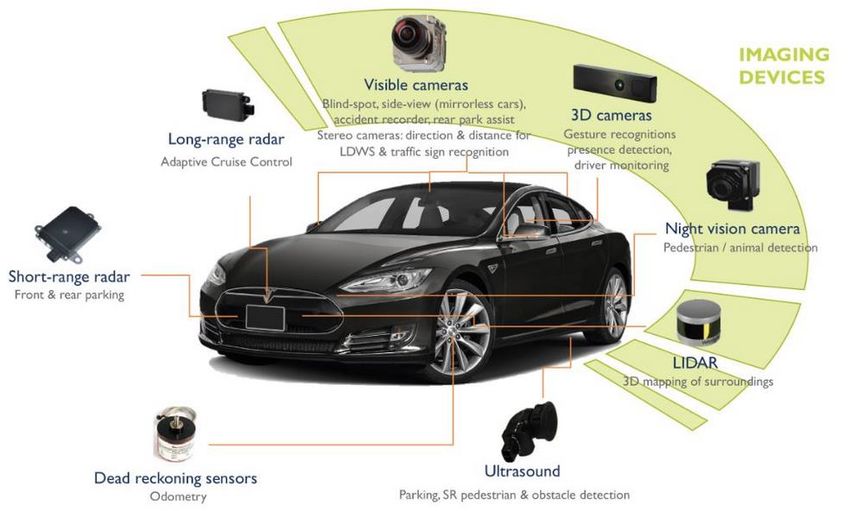
Growth in memory driven by SSD, computing and smartphones

DRAM growth

 Growth in servers
 Increase in DRAM density in servers and smartphones
 Growing Artificial Intelligence functionality

NAND growth

 SSD growing with data traffic and HDD substitution                                           Source: Apple.com

 NAND growth in smartphones due to higher density per unit (e.g. iPhone XS with up to 512 GB).
 NAND prices sliding from a high level due to over-supply. Sliding NAND prices not negative for
  wafer demand as falling prices will increase SSD demand in PCs (price elasticity)
 Customers’ demand still shows ~10% growth (CAGR 18-23)

             Siltronic Roadshow Presentation                                   ® Siltronic AG 2018
             October / November 2018
                                                                                                                   4 of 37
Siltronic Investor Presentation - October/November 2018 - Siltronic AG
Automotive growth in all diameters with 300 mm to grow faster
than other diameters

 Infotainment, connectivity and ADAS become standard, driven by consumer request and
  government mandates

 ADAS, infotainment and connectivity require advanced logic as well as large amounts of memory

 Change in car architecture towards domain and inter-domain control requires fewer, but advanced
  MCUs instead of large amounts of simple MCUs for each electronic control unit

 Advanced process nodes for logic are on 300 mm

                                                                                                   Source: Yole 2018

            Siltronic Roadshow Presentation                                  ® Siltronic AG 2018
            October / November 2018
                                                                                                                  5 of 37
Siltronic Investor Presentation - October/November 2018 - Siltronic AG
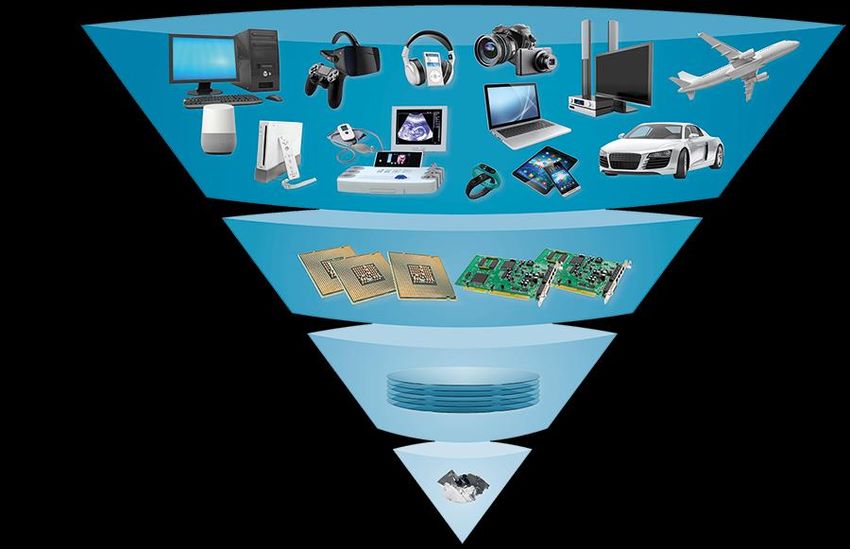
Investor key messages

 Fundamental NAND growth intact

 Smartphone content additionally supported by CIS development

 Significant investment and ramp in new fabs by NAND players

 Demand of most automotive semi customers strengthening

 We don’t see any significant change in the market demand, but we might see some volatility
  triggered by political events and Chinese phone inventories in the short-term

            Siltronic Roadshow Presentation                                  ® Siltronic AG 2018
            October / November 2018
                                                                                                   6 of 37
Siltronic Investor Presentation - October/November 2018 - Siltronic AG
Financials improved strongly over the last years

    Adjusted1 financial                                                                                                                                                       Q1-Q3 /
    figures (EUR million)
                                                                 2013                    2014                    2015                   2016                  2017
                                                                                                                                                                                2018

    Sales                                                       875.5                   853.4                  931.3                   933.4             1,177.3               1,068.5

    EBIT                                                       (87.3)                  (31.6)                       2.7                  27.0                235.7                 358.8

    EBIT margin in %                                           (10.0)                     (3.7)                     0.3                     2.9                 20.0                  33.6

    EBITDA                                                      112.6                   117.7                  124.0                   146.0                 353.1                 428.6

    EBITDA margin in %                                            12.9                    13.8                    13.3                   15.6                   30.0                  40.1

    CapEx                                                         39.7                    40.7                    75.0                   88.8                123.2                 141.3

    Free cash flow                    2                           64.7                    86.3                    37.4                   19.0                169.6                           -

    Net cash flow                 2                                       -                       -                      -               39.6                124.8                 272.7

1   Figures 2013-2014 adjusted for consolidation effects resulting from acquisition of SSW and restructuring
2   Starting 2018, Siltronic will be reporting the key figure „net cash flow“ instead of „free cash flow“. Net cash flow represents free cash flow without the time shifts created by inflow and return of customer
    prepayments which, due to the size, impairs the meaningfulness of free cash flow.

                        Siltronic Roadshow Presentation                                                                                                            ® Siltronic AG 2018
                        October / November 2018
                                                                                                                                                                                                            7 of 37
Siltronic Investor Presentation - October/November 2018 - Siltronic AG
Siltronic Outlook for 2018 (as of October 25, 2018)

   EBITDA margin               approximately 40%

        ROCE                   clearly higher than in 2017

    Net cash flow              clearly higher than in 2017

        Sales                  slightly above EUR 1.4bn, depending on FX effects update

        R&D                    approx. 5% of sales

    Cost position              negative effect on savings potential due to tariff increases and inflation

                               assuming an EUR/USD exchange rate of 1.20 and an EUR/JPY exchange rate of 130 negative
     FX effects
                               FX impact of approx. EUR 60m on sales and approx. EUR 40m on EBITDA

    Depreciation               approx. EUR 90m

      Tax rate                 between 15% and 20%

   Financial result            relatively stable

       CapEx                   approx. between EUR 260m and EUR 280m

  Earnings per share           significantly higher than in 2017

                 Siltronic Roadshow Presentation                                                            ® Siltronic AG 2018
                 October / November 2018
                                                                                                                                  8 of 37
Siltronic Investor Presentation - October/November 2018 - Siltronic AG
Q3 2018 Financials

                     © Siltronic AG 2018
Siltronic Investor Presentation - October/November 2018 - Siltronic AG
Q3 sales 5% higher than in previous quarter
Sales, in EUR million

                                                                    Comment

                                                          379.8      Positive
                                                361.3                  ASP increase y-o-y and q-o-q
                  328.1                 327.4                          One-off effect of EUR 8m in
   308.1
                                                                        Q3/2018: conversion of a
                                                                        customer from sea freight to air
                                                                        freight
                                                                       Slight tailwind from USD q-o-q

                                                                     Negative
                                                                       Headwind from USD y-o-y
                                                                        (but not as much as expected at
                                                                        the beginning of the year)

  Q3 2017       Q4 2017               Q1 2018   Q2 2018   Q3 2018

            Siltronic Roadshow Presentation                                      ® Siltronic AG 2018
            October / November 2018
                                                                                                       10 of 37
EBITDA and EBITDA-margin further up
EBITDA margin in %; EBITDA in EUR million
                                                                   Comment

                                                                    Positive
                                                          42.2
                                                40.4                  Higher ASP y-o-y and q-o-q
                  36.8                  37.4
   34.6                                                               Slight tailwind from USD
                                                                       q-o-q
                                                                      Slightly lower cost per wafer
                                                                       area q-o-q
                                                          160.2
                                                146.0
                 120.9                 122.3
  106.5                                                             Negative
                                                                      Headwind from USD y-o-y
                                                                       (but not as much as
                                                                       expected at the beginning of
 Q3 2017       Q4 2017               Q1 2018   Q2 2018   Q3 2018       the year)

           Siltronic Roadshow Presentation                                      ® Siltronic AG 2018
           October / November 2018
                                                                                                      11 of 37
Strong growth of net profit
Result and income tax, in EUR million

                                                                             Comment
                                                           -22.1              Net profit in Q3/2018 about
                                                                               17% up vs. Q2/2018
             -24.2
                                                                              Higher ASPs and slightly lower
                                                                               cost of sales per wafer area
                                                                               contributed
                                                136.7                         EUR 22.1m expenses for
    122.2                                                                      taxes in Q3/2018
                                                                    114.6
                            98.0
                                                                              Tax rate of 16% in Q3/2018

            Q2/2018                                     Q3/2018
    Result before income tax            Income tax   Result for the period

            Siltronic Roadshow Presentation                                          ® Siltronic AG 2018
            October / November 2018
                                                                                                           12 of 37
Equity further increased due to strong profit for the period,
solid equity ratio stable at about ~48%
Balance sheet, in EUR million

                          Sep 30,         Dec 31, Comments             Equity and            Sep 30, Dec 31,       Comments
Assets
                           2018           2017    Sep 30, 2018         liabilities            2018 2017            Sep 30, 2018
Non-current                652.4           546.6                       Equity                841.7     637.9
  PP&E                      587.1           513.3
                                                    21 intangibles       Siltronic           822.1     637.3
  Other fixed                43.8            32.0   (related to SSW)
                                                    1 hedging            Other                                     Samsung’s 22% in
  Securities and                                                                              19.6       0.6       SSW
                                                                         shareholders
  fixed-term                 21.5             1.3
  deposits                                                             Liabilities           898.1     614.5
Current                    1,087,4          705.8                        Pension
                                                                                             373.6     367.2       Germany and US
  Inventories and                                                        provision
                            152.0           149.9
  contract assets                                                                                                  37 personnel related
                                                                         Other provisions    124.5      54.6       (e.g. early retirement)
  Trade
                            167.4           159.9
  receivables                                                            Trade liabilities    91.6      67.1
  Other current              73.7            53.9   4 hedging            Customer
                                                                                             241.4      69.8
                                                                         prepayments
  Cash, fixed term
                                                                                                                   50 employee-related
  deposits and              694.3           342.1                        Other                67.0      55.7       11 hedging
  securities
Total
                        1,739.8          1,252.4                       Total                 1,739.8   1,252.4

                Siltronic Roadshow Presentation                                                        ® Siltronic AG 2018
                October / November 2018
                                                                                                                                      13 of 37
Net financial assets exceed EUR 700 million for the first time

Net financial assets, in EUR million

                                                     716   Comment

                                               603
                                                             Prepayments of EUR 171.5m
                                                              (net) received until
                                         491                  September 2018

                    342
    295

           Siltronic Roadshow Presentation                           ® Siltronic AG 2018
           October / November 2018
                                                                                           14 of 37
Strong net cash flow despite investments in the future
Capex and NCF, in EUR million
                                                                                        Comments

                                           112.4                                         Net cash flow of EUR 93.0m in
                                                                                          Q3 2018

                                                                                         Capex increase in Q3 related to:

                                                                                           capacity expansion in 2019
                                                                                           new crystal pulling hall in
                                                                          93.0              Singapore
                                                            67.1                           ongoing automation projects
   60.6                       61.4                                               62.8
                                                                   45.2                  Capex in 9M 2018: EUR 141.4m
                                                   33.4
          16.9                                                                           Expected capex in Q4 2018:
                                                                                          approx. EUR 120-140m
                       -4.6
                                                                                         Capex guidance for FY 2018
   Q3 2017             Q4 2017              Q1 2018         Q2 2018       Q3 2018
                                                                                          unchanged EUR 260m-280m
                                          NCF       Capex

                 Siltronic Roadshow Presentation                                                   ® Siltronic AG 2018
                 October / November 2018
                                                                                                                          15 of 37
APPENDIX

           © Siltronic AG 2017
Capex 2018: Investment in the future

Investment, in EUR million                                     Comments
                                                    ~260-280
                                                      ~20       Capex of EUR ~140m for 70k wafers/month
                                                                 over 2 years

 Prepayments for 2020                                ~50-70     Capex in 2018 includes new crystal pulling hall
 capacity increase                                               in Singapore to create sufficient crystal pulling
 Capex crystal pulling                                           capacity to further expand wafer capacity in
 hall
 Capex for 70k/m.
                                                                 2020

 Base Capex                       123                           Due to long lead-times additional crystal pullers
                                                     ~110        already ordered
                                   ~30                          Prepayments for capacity additions in 2020
                                                                 already in 2018
                                                                Capex base level to sustain business:
                                   ~90
                                                      ~80         MOB (maintenance of business)
           54
                                                                  Capabilities
                                                                  Cost reductions
   Ø 2014-2016                    2017               2018e
                                                                  Automation

                  Siltronic Roadshow Presentation                                        ® Siltronic AG 2018
                  October / November 2018
                                                                                                               17 of 37
Increasing FX exposure due to higher margins

FX exposure
                                                USD exposure 2018
        100%
                                                   hedging ratio approx. 40%
 EUR

                                     EBITDA       excl. profit
  JPY   roughly
          1/4                                      hedging ratio approx. 75%

                                      100%
                                                JPY exposure 2018
                                                   hedging ratio approx. 30%

                       EUR           roughly
                                       2/3
                                                  excl. profit
 USD    roughly
          2/3                                      hedging ratio approx. 50%
                        JPY
                       SGD
                       USD

        Sales                           Costs
        2018e                           2018e

           Siltronic Roadshow Presentation                        ® Siltronic AG 2018
           October / November 2018
                                                                                        18 of 37
At FX rates (1.20/130) negative impact on sales by approx. EUR
60m and on EBITDA by approx. EUR 40m

Change USD, in EUR million                      Change JPY, in EUR million

1 ct     ~ EUR 8.0m sales                       1 JPY     ~ EUR 2.5m sales

         ~ EUR 6.5m EBITDA unhedged                       ~ EUR 2.0m EBITDA unhedged

         ~ EUR 4.5m EBITDA after hedging                  ~ EUR 1.0m EBITDA after hedging

        2017                          2018e             2017              2018e
         1.13                            1.20           127                  130

         ~ EUR -55m sales                                 ~ EUR -8m sales

         ~ EUR -35m EBITDA                                ~ EUR -4m EBITDA

           Siltronic Roadshow Presentation                             ® Siltronic AG 2018
           October / November 2018
                                                                                             19 of 37
Increasing demand for electronic devices and new applications
drive semiconductor growth, which in turn fuels silicon demand

Electronics value chain 2017

                                Electronics
                            USD 1,504 bn

                                    Semiconductors
                                               USD 400 bn

                      Semiconductors silicon wafers
                                                                USD 8.7 bn

                                  Silicon for electronic applications
                                                                                  USD 1.1 bn
Source: Electronics (IC Insights), Semiconductors (WSTS, only silicon-based), Silicon wafers (SEMI SMG), Electronic applications (estimate)

                        Siltronic Roadshow Presentation                                                                                       ® Siltronic AG 2018
                        October / November 2018
                                                                                                                                                                    20 of 37
Siltronic is a strong wafer supplier with leading-edge technology

Top 5 wafer producers serve more than 90% of market across all diameters

                                                                                   10%
                                                                       18%
                                                                                                15%

                                                              27%

                                                                                       30%

                                                      SK Siltron       Siltronic   Shin Etsu   Sumco   GlobalWafers

Sources: reported company revenues FY 2017, converted to USD million

                      Siltronic Roadshow Presentation                                                                 ® Siltronic AG 2018
                      October / November 2018
                                                                                                                                            21 of 37
Customer base well diversified across all major semiconductor
silicon wafer consumers

Siltronic is a supplier to all top 20 Silicon wafer consumers

                  Siltronic well positioned at all          Top 10 customers represent ~73%
                  major Silicon consumers                   of 2017 revenues

Source: Company Information, Siltronic

                       Siltronic Roadshow Presentation                    ® Siltronic AG 2018
                       October / November 2018
                                                                                                22 of 37
International manufacturing network supports
market leadership and business focus

                                                                   Freiberg         CP*   300 mm

                                                       Germany
                  Portland                  200 mm

United States

                                                                   Burghausen       CP*   300 mm                SD*

►   Central R&D hub in Burghausen

►   High volume facilities for 300 mm
    in Germany and Singapore

►   Among world’s newest & largest                                 SSW        CP*    300 mm            SSP          200 mm
    fabs in Singapore
                                                       Singapore

*CP = Crystal Pulling | *SD = 150 mm and smaller

                     Siltronic Roadshow Presentation                                          ® Siltronic AG 2018
                     October / November 2018
                                                                                                                       23 of 37
Continuous improvement of key ingot and wafer properties to
meet customers‘ requirements

Ingot                                                     Wafer

   doping level
                                mechanical stability                  edge flatness

                                                           flatness
 purity                                                                                 uniformity

                                            resistivity

                                                                           surface cleanliness
 oxygen content                                               shape
                               homogeneity

          Siltronic Roadshow Presentation                                  ® Siltronic AG 2018
          October / November 2018
                                                                                                 24 of 37
Siltronic is focused on growing 300 mm and attractive 200 mm
business.

Development of total wafer demand per diameter, in mn 300 mm equivalents per month

                                                                                                             Strong
7                                                                                                            demand
             300 mm             200 mm             SD (pol/epi)                                                 &
6                                                                                                            growth

5

4

3                                                                                                           Stable &
                                                                                                            attractive
2

1                                                                                                            Mid-term
                                                                                                             decline
0
 2010            2011           2012          2013      2014      2015   2016   2017   2018
Source: SEMI up to Sep 2018

                      Siltronic Roadshow Presentation                                         ® Siltronic AG 2018
                      October / November 2018
                                                                                                                         25 of 37
Silicon area demand continues to grow

Silicon wafer demand, in bn in2                                                                                                                  +7%
                                                                                                                           +10%
                                                                                                                                                           12.6e
                                                                                                                                           11.8
                                                                                                                         10.7
                                                                                                       10.4
                                                                                     10.1
              9.4
                               9.0                9.0               9.1

            2010              2011              2012              2013              2014              2015              2016              2017              2018
Source: Data based on IHS Markit, Technology Group, Semiconductor Silicon Demand Forecast Tool, Q3 2018 (Estimate 2018). Results are not an endorsement of Siltronic. Any reliance on these results is
at the third party’s own risk. Visit technology.ihs.com for more details. Further Source: SEMI (Silicon Area until 2017).

                       Siltronic Roadshow Presentation                                                                                                  ® Siltronic AG 2018
                       October / November 2018
                                                                                                                                                                                             26 of 37
Smartphone growth slowing, however silicon content increasing
with more memory and other features

                       Smartphone production                                                                                Wafer area in smartphones
 1500                                                                                   15%               20                                                                                     15%

 1000                                                                                   10%                                                                                                      10%

                                                                                                          10

   500                                                                                  5%                                                                                                       5%

       0                                                                                0%                   0                                                                                   0%
                 2015              2016              2017           RF 2018                                            2015               2016               2017            RF 2018
                         mn units                 YoY growth in %                                                                  bn cm2                 YoY growth in %
Source: Data based on IHS Markit, Technology Group, Semiconductor Silicon Demand Forecast Tool, Q2 2018. Results are not an endorsement of Siltronic. Any reliance on these results is at the third party’s
own risk. Visit technology.ihs.com for more details

                        Siltronic Roadshow Presentation                                                                                                    ® Siltronic AG 2018
                        October / November 2018
                                                                                                                                                                                                27 of 37
Major semiconductor devices in the Apple iPhone 8 Plus
 (256 GB model)

2 main cameras                                                              Front-facing camera
  ~ 2 cm² Si                                                                     ~ 1 cm² Si

                                                                            SoC Package-on-Package
                                                                                 Processor                 3GB DRAM
                                                                                  ~ 1 cm² Si                ~ 2.5 cm² Si
Flash NAND (256 GB)
  ~ 9 cm² Si

                                                                            Broadband processor
                                                                                  ~ 1 cm² Si

Some additional features:
  3 Power management ICs – vs. 2 in iPhone 7               Processor includes Image Signal Processor and Video Encoder
  Time-of-Flight chip introduced at iPhone 7               Wireless Charging
 Source: Apple, TechInsights, Siltronic Marketing

                         Siltronic Roadshow Presentation                                        ® Siltronic AG 2018
                         October / November 2018
                                                                                                                         28 of 37
Car shipments growing slowly, silicon content in automotive
estimated to grow by 7% (CAGR 2017-2022)

          Worldwide passenger car shipments                                                                                     Wafer area in automotive
 80                                                                                     10%                                                                                                      10%
                                                                                                          9000

                                                                                                          6000

 40                                                                                     5%                                                                                                       5%

                                                                                                          3000

   0                                                                                    0%                       0                                                                               0%
           2017         RF           RF          RF           RF           RF                                           2017         RF   RF   RF   RF   RF
                       2018         2019        2020         2021         2022                                                      2018 2019 2020 2021 2022
                         mn units                 YoY growth in %                                                                  mn cm2                  YoY growth in %
Source: Data based on IHS Markit, Technology Group, Semiconductor Silicon Demand Forecast Tool, Q2 2018. Results are not an endorsement of Siltronic. Any reliance on these results is at the third party’s
own risk. Visit technology.ihs.com for more details.            Other Source: Statista

                        Siltronic Roadshow Presentation                                                                                                    ® Siltronic AG 2018
                        October / November 2018
                                                                                                                                                                                                29 of 37
Within a car, most silicon is used for powertrain, infotainment
and safety

    2018 silicon demand in automotive, in %

                                                                                          Other
                                                                                        Automotive

                                                                             Chassis &                        Powertrain
                                                                             Safety (incl.
                                                                               ADAS)

                                                                                                        Infotainment
                                                                                                             and
                                                                                                        Connectivity

                                                                                  Body &
                                                                                Convenience
                                                                     300 mm  200 mm  SD
1   ADAS = advanced driver assistance system
    Source: Data based on IHS Markit, Technology Group, Semiconductor Silicon Demand Forecast Tool, Q3 2018. Results are not an endorsement of Siltronic. Any reliance on these results is at the third party’s
    own risk. Visit technology.ihs.com for more details.

                            Siltronic Roadshow Presentation                                                                                                    ® Siltronic AG 2018
                            October / November 2018
                                                                                                                                                                                                    30 of 37
Silicon demand for NAND driven by growing demand for solid-
state drives and increasing storage in smartphones
NAND silicon area demand by applications, bn cm² p.a.

                      20

                      16

                      12

                        8

                        4

                        0
                                        2014                         2016                         2018                         2020                         2022
                             Solid-State Drives                  Smartphones                  Memory Cards                   Tablet Computers                    Others

Source: Data based on IHS Markit, Technology Group, Semiconductor Silicon Demand Forecast Tool, Q3 2018. Results are not an endorsement of Siltronic. Any reliance on these results is at the third party’s
own risk. Visit technology.ihs.com for more details.

                        Siltronic Roadshow Presentation                                                                                                    ® Siltronic AG 2018
                        October / November 2018
                                                                                                                                                                                                31 of 37
NAND is the growth engine in the memory sector
Silicon area for DRAM only shows moderate growth
Split of memory silicon area market by DRAM and NAND, bn cm² p.a.

                                    30

                                    20

                                    10

                                      0
                                                   2014                    2016                    2018                    2020                   2022
                                                                                    DRAM                        NAND

Source: Data based on IHS Markit, Technology Group, Semiconductor Silicon Demand Forecast Tool, Q3 2018. Results are not an endorsement of Siltronic. Any reliance on these results is at the third party’s
own risk. Visit technology.ihs.com for more details.

                        Siltronic Roadshow Presentation                                                                                                    ® Siltronic AG 2018
                        October / November 2018
                                                                                                                                                                                                32 of 37
200 mm demand growth forecast of +4% CAGR 2017-2020 not
attractive enough to consider major investments

200 mm demand by category, in k/w per month

 7,000
                                                                                                         Comment
 6,000
                                                                                                          200 mm demand expected to increase by +4%
 5,000                                                                                                     CAGR (2017-2020), according to IHS Markit.

 4,000
                                                                                                          Less than 1,000k wafer/month capacity
                                                                                                              expansions until 2020 announced by wafer
 3,000                                                                                                        producers
                                                                                                          Full utilization of additional capacities depend
 2,000                                                                                                        on equipment lead-times and qualification lead-
                                                                                                              times of customers
 1,000

       0
                   2017               2018 RF              2019 RF               2020 RF

                   Computing                   Mobile Phones               Industrial
                   Automotive                  Consumer                    Infrastructure

Source: Data based on IHS Markit, Technology Group, Semiconductor Silicon Demand Forecast Tool, Q3 2018. Results are not an endorsement of Siltronic. Any reliance on these results is at the third party’s
own risk. Visit technology.ihs.com for more details.
Other source: Siltronic Marketing (July 2018)

                        Siltronic Roadshow Presentation                                                                                                    ® Siltronic AG 2018
                        October / November 2018
                                                                                                                                                                                                33 of 37
Contact and Additional Information

Issuer and Contact                                           Additional Information

Siltronic AG                                                 ISIN:               DE000WAF3001
Hanns-Seidel-Platz 4                                         WKN:                WAF300
D-81737 München                                              Deutsche Börse:     WAF
                                                             Listing:            Frankfurt Stock Exchange
Investor Relations:
                                                                                 Prime Standard
Petra Mueller
email: petra.mueller@siltronic.com
Tel. +49 89 8564-3133

Financial Calendar

Preliminary financial figures             January 31, 2019
Annual Report 2018                        March 5, 2019
Q1 Quarterly Statement                    May 3, 2019
Annual General Meeting                    May 7, 2019
Half Year Report                          July 25, 2019
Q3 Quarterly Statement                    October 24, 2019

             Siltronic Roadshow Presentation                                          ® Siltronic AG 2018
             October / November 2018
                                                                                                            34 of 37
Disclaimer

The information contained in this presentation is for background purposes only and is subject to
amendment, revision and updating. Certain statements contained in this presentation may be
statements of future expectations, future financial performance and other forward-looking statements
that are based on management's current views and assumptions and involve known and unknown risks
and uncertainties. In addition to statements which are forward-looking by reason of context, including
without limitation, statements referring to risk limitations, operational profitability, financial strength,
performance targets, profitable growth opportunities and risk adequate pricing, words such as "may”,
“will”, “should”, “expects”, “plans”, “intends”, “anticipates”, “believes”, “estimates”, “predicts”, “continue”,
“projects” or “seeks”, “potential”, “future”, or “further” and similar expressions may identify forward-
looking statements. By their nature, forward-looking statements involve a number of risks, uncertainties
and assumptions which could cause actual results or events to differ materially from those expressed or
implied by the forward-looking statements. These include, among other factors, changing business or
other market conditions, currency and interest fluctuations, introduction of competitive products, poor
acceptance of new products and services, change of the corporate strategy and the prospects for
growth anticipated by the management. These and other factors could adversely affect the outcome and
financial effects of the plans and events described herein. Statements contained in this presentation
regarding past trends or activities should not be taken as a representation that such trends or activities
will continue in the future. Siltronic AG does not undertake and does not intent to undertake any
obligation to update or revise any statements contained in this presentation, whether as a result of new
information, future events or otherwise. In particular, you should not place any reliance on forward-
looking statements which speak only as of the date of this presentation.

             Siltronic Roadshow Presentation                                         ® Siltronic AG 2018
             October / November 2018
                                                                                                           35 of 37
SILTRONIC AG |   Hanns-Seidel-Platz 4
                 81737 Munich
                 Germany

                                        © Siltronic AG 2018
You can also read