AVIATION DEPARTMENT FY2021 PROPOSED BUDGET PRESENTATION - Mario Diaz, Director of Aviation J'Maine Chubb, Deputy Director of HAS Finance
←
→
Page content transcription
If your browser does not render page correctly, please read the page content below
AVIATION DEPARTMENT
FY2021 PROPOSED BUDGET PRESENTATION

Mario Diaz, Director of Aviation
J’Maine Chubb, Deputy Director of HAS Finance

May 14, 2020
Organization Chart
                                                 AVIATION DIRECTOR

                                                 TERMINAL                               ELLINGTON  AIRPORT/
                                                                                              OPERATIONS
             ADMINISTRATION                                           OPERATIONS
                                                MANAGEMENT                                   SPACEPORT

                             COMMERCIAL                   GEORGE BUSH
FINANCE & ACCOUNTING                                                                      BUSH AIRPORT
                             DEVELOPMENT                INTERCONTINENTAL
                                                                                              (IAH)
                                                             AIRPORT

   TECHNOLOGY            HUMAN CAPITAL                   WILLIAM P. HOBBY
   TECHNOLOGY             MANAGEMENTHUMAN CAPITAL            AIRPORT    HOBBY AIRPORT
                                       MANAGEMENT                           (HOU)

  EXTERNAL AFFAIRS      INFRASTRUCTURE

          EXTERNAL AFFAIRS            INFRASTRUCTURE
 RISK & REGULATORY
    COMPLIANCE

                                                                                                              2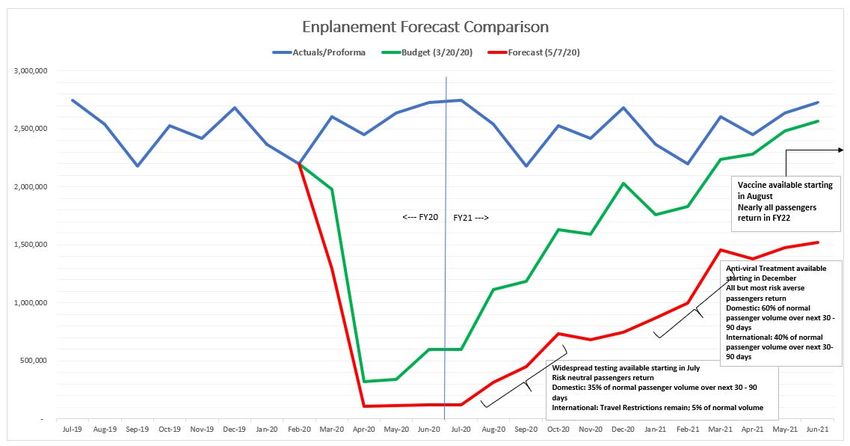
Department Programming
   We provide services to the traveling public!

        Worldwide Destinations (39 Countries w/ over 194 non‐stop destinations)

                 Parking

                         Concessions

                 Rental Cars and Ground Transportation

        Other Services

                                                                                  3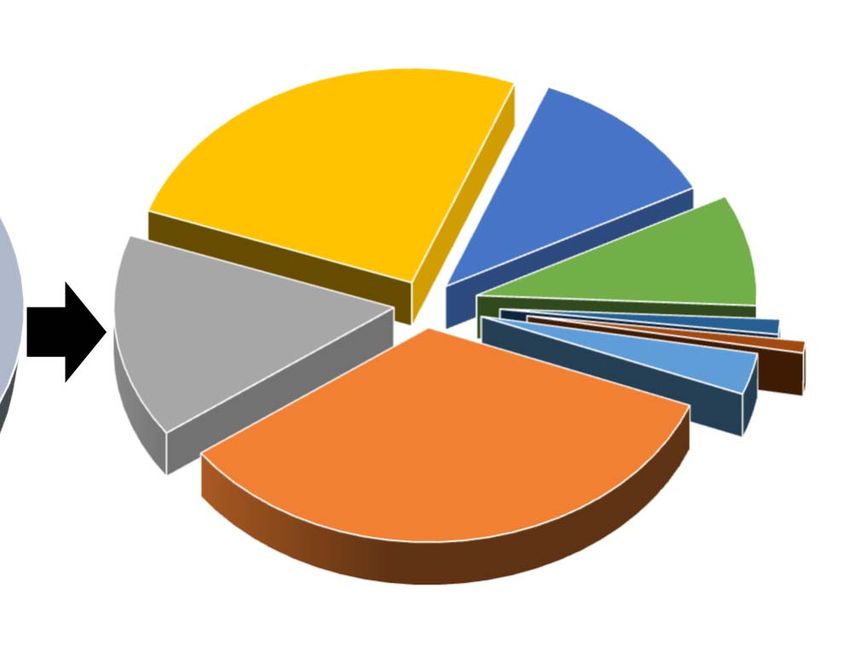
Strategic Plan 2020‐2024
                                        MISSION
       We exist to connect the people, businesses, cultures and economies of the world to
       Houston
                                        VISION
       Establish Houston Airport System as a 5‐star global air service gateway where the
       magic of flight is celebrated

                                   STRATEGIC PRIORITIES

   Make Our                  Act               Build Platforms         Invest in Our

   Passengers          Responsibly to            for Future            Partnerships

     Happy             Achieve Social,            Success             and Employees
                       Environmental

                         & Economic

                        Sustainability
                                                                                            4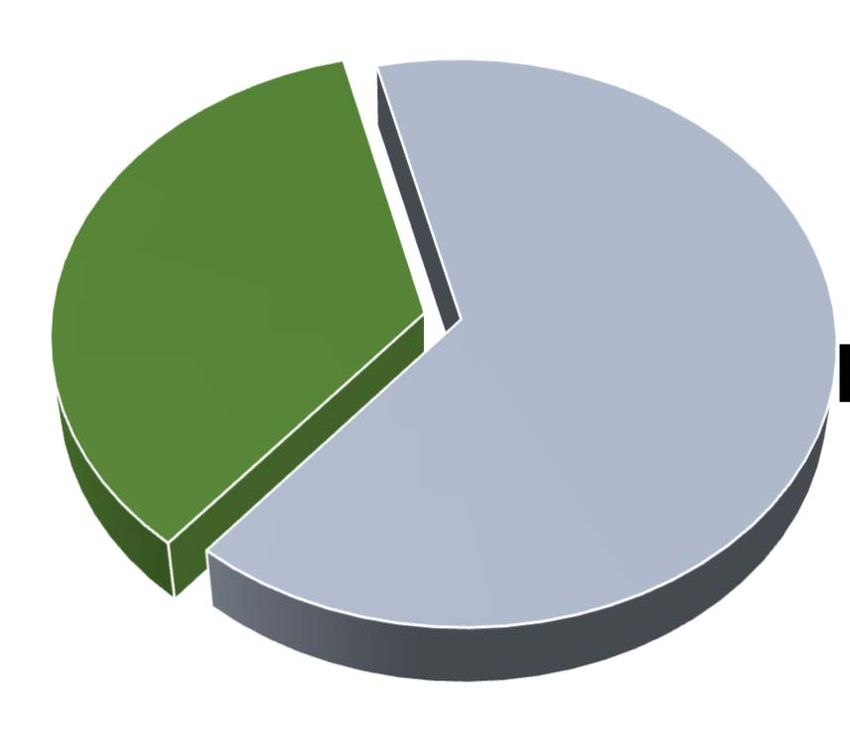
Strategic Plan – Key Accomplishments
HOU
HOU IAH
IAH
William P.
Hobby George Bush Strategy‐to‐ Full Biometric Biometric Exit
Airport Airport Budget Entry Pilot
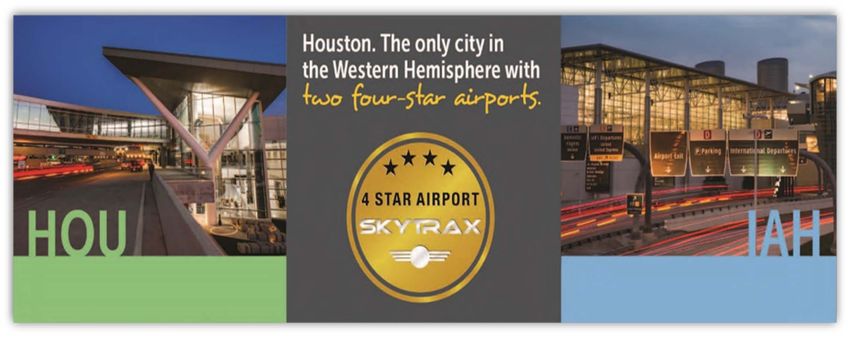
Skytrax rating improved Retained its 4‐star HAS successfully William P. Hobby Implemented a
from 4.2 to 4.3 Skytrax rating completed Strategy‐ Airport is the 1st airport Biometric Exit Pilot
5th consecutive year w/ 3rd consecutive year to‐Budget for FY21 with full Biometric Entry Program at George Bush
4‐star Skytrax rating w/4‐star Skytrax rating budget cycle for international Intercontinental Airport
passengers
5
HAS Revenues Overview
($ in thousands)
        HAS – Revenue Fund 8001        FY19      FY20        FY20       FY21      FY21 Prop     % Change
                                      Actual    Budget     Estimate   Proposed   vs. FY20 Est
Airline – Landing Fees               $84,357    $91,076    $91,076    $92,952      $1,876         2.1%
Airline – Terminal Rents and Usage   $186,006   $199,690   $197,690   $193,524    ($4,166)       (2.1%)
Fees
         Subtotal Airline Revenues   $270,363   $290,766   $288,766   $286,476    ($2,290)       (0.8%)
Parking & Ground Transportation      $122,781   $125,616   $90,540    $87,340     ($3,200)       (3.5%)
Terminal Concessions                 $41,491    $40,994    $32,567    $29,215     ($3,352)      (10.3%)
Auto Rental Concessions              $28,949    $28,884    $22,931    $21,401     ($1,530)       (6.7%)
Other                                $55,127    $59,150    $57,797    $56,491     ($1,305)       (2.3%)
         Subtotal Non‐Airline        $248,348   $254,644   $203,835   $194,447    ($9,388)       (4.6%)
         Revenues

         Total Revenue               $518,711   $545,410   $492,601   $480,923    ($11,678)      (2.4%)

                                                                                                           6
FY21 ‐ Revenues Highlights
Fund 8001
Revenue for FY2021 is proposed to be $480.9M, a decrease of $11.7M, or 2.4%
over the FY2020 Estimate
Airline revenues from landing fees and terminal rents are projected to decrease by $2.3M or
0.8%, driven by the decrease in capital expenses allocable to the airlines at IAH and HOU.
Parking and Ground Transportation revenues are projected to decrease $3.2M, or 3.5%, due
to full year impact of reduced garage parking and anticipated decrease in passenger activity
at IAH and HOU.
Terminal concession revenues are projected to decrease $3.4M, or 10.3% and car rental
concessions revenue is projected to decrease by $1.5M, or 6.7%, both driven by the
anticipated decrease in passenger activity at IAH and HOU.
Other revenue is projected to decrease by $1.3M, or 2.3%, driven primarily due to lower
projected interest rates on investments.
7
FY21 Budget ‐ Year‐End Cash Balance
($ in millions)
$100.0 AVIATION
$17.3 DIRECTOR
$325.1
$174.1
$246.9 $36.1 $12.0 $24.0 $116.6
$9.6 $3.6
ADMINISTRATION OPERATIONS
$476.9
$393.3
FY20 YE Airline Rev Collected Non‐Air Rev COMMERCIAL
CARES Act Int Income O&M Cap Eq R&R Debt Serv Int Expense Finance Fees FY21 YE
FINANCE
Cash & ACCOUNTING
Def
BUSH AIRPORT Cash
DEVELOPMET (IAH)
FY21 assumes a 30% reduction in enplanements vs. a normalized year; year‐end unrestricted cash
balance improves to $476.9M ($393.3M at the end of FY20)
HUMAN CAPITAL
TECHNOLOGY
Higher balance achieved by receipt of CARES Act proceeds and a change in Capital
MANAGEMENT
Improvement Plan funding policy that prohibits use of unrestricted cash through the end of
FY21
EXTERNAL AFFAIRS INFRASTRUCTURE
FY20 year‐end estimated Days Cash on Hand (DCOH) of 463 improves to 535 by the end of
FY21
$100M in CARES Act proceeds remain available for withdrawal in FY22
*Note – FY20 budget is based on a 30% reduction in enplanements
8
FY21 Enplanement Projections
AVIATION DIRECTOR
ADMINISTRATION OPERATIONS
COMMERCIAL BUSH AIRPORT
FINANCE & ACCOUNTING
DEVELOPMET (IAH)
HUMAN CAPITAL
TECHNOLOGY
MANAGEMENT
EXTERNAL AFFAIRS INFRASTRUCTURE
Enplanements: Budget 21.3M; Forecast 10.8M; Normalized Year 30.1M
9
Proforma HAS Revenues Overview –
64% Decline ($ in thousands)
        HAS – Revenue Fund 8001       FY20        FY20       FY21      FY21      FY21 Prop   % Change
                                     Budget     Estimate   Proposed    64%        vs. FY21
                                                                      Decline       64%
                                                                                  Decline
Airline – Landing Fees               $91,076    $91,076    $92,952    $92,952       $0         0%
Airline – Terminal Rents and Usage   $199,690   $197,690   $193,524   $193,524     ($0)        0%
Fees
         Subtotal Airline Revenues   $290,766   $288,766   $286,476   $286,476      $0         0%
Parking & Ground Transportation      $125,616   $90,540    $87,340    $34,595    ($52,745)   (60.3%)
Terminal Concessions                 $40,994    $32,567    $29,215    $13,845    ($15,370)   (52.6%)
Auto Rental Concessions              $28,884    $22,931    $21,401    $10,787    ($10,614)   (49.6%)
Other                                $59,150    $57,797    $56,491    $46,253    ($10,238)   (18.1%)
         Subtotal Non‐Airline        $254,644   $203,835   $194,447   $105,480   ($88,967)   (45.8%)
         Revenues

         Total Revenue               $545,410   $492,601   $480,923   $391,956   ($88,967)   (18.5%)

*Note – CARES Act grants for expense reimbursements will decrease airline revenue while
improving the cash position of HAS

                                                                                                       10
FY21 BUDGET ‐ YEAR‐END CASH BALANCE
($ in millions) [64% Decline in Traffic]
$150.0 $17.3 $325.1
$136.1
AVIATION DIRECTOR
$178.1 $36.1 $12.5 $24.0 $116.6
$9.3 $3.2
ADMINISTRATION OPERATIONS
$393.3 $420.2
FY20 YE Airline Rev Collected Non‐Air Rev COMMERCIAL
CARES Act Int Income O&M Cap Eq R&R Debt Serv Int Expense Finance Fees FY21 YE
FINANCE
Cash & ACCOUNTING
Def
BUSH AIRPORT Cash
DEVELOPMET (IAH)
The 64% enplanement decline scenario, considering only 85% of airline revenues earned are
collected, shows an improvement in cash position
HUMAN CAPITAL
TECHNOLOGY
FY21 year‐end unrestricted cash balance improves to $420.2M compared to $393.3M at the
MANAGEMENT
end of FY20
FY21 projected DCOH at 472 exceeds the FY20 year‐end estimate of 463
INFRASTRUCTURE
EXTERNAL AFFAIRS
Higher balance achieved by $150M expenditure recovery via CARES Act proceeds, and a
temporary Capital Improvement Plan funding policy that prohibits use of unrestricted cash
11HAS Expenditures By Category
($ in thousands)
Variance
Fund 8001 FY19 FY20 FY20 FY21 FY21 Prop/ FY20 Est.
Actual Adopted Estimate Proposed H / (L) % Change
Personnel * $ 103,269 $ 110,153 $ 104,299 $ 114,075 $ 9,776 9.4%
Supplies 8,390 9,537 8,456 6,601 (1,855) (21.9%)
Other Services & Charges 185,713 212,746 190,554 202,560 12,006 6.3%
Non-Capital 1,097 2,634 1,220 1,880 660 54.1%
HAS Revenue Fund (O&M) 8001 $ 298,469 $ 335,070 $ 304,529 $ 325,116 $ 20,587 6.8%
* ‐ FY19 Actual Personnel as shown does not include GASB NPO and OPEB year end accruals of $18.9M
Variance
Fund 8012 FY19 FY20 FY20 FY21 FY21 Prop/ FY20 Est.
Actual Adopted Estimate Proposed H / (L) % Change
Bldgs, Improvements & FFE $ 218 $ 583 $ 592 $ 2,762 $ 2,170 366.8%
Computer HW and Developed SW 1,370 4,677 1,360 4,723 3,363 247.4%
Vehicles (and Rolling stock) 2,306 9,034 5,157 4,989 (168) (3.3%)
HAS Capital Outlay Fund 8012 $ 3,894 $ 14,295 $ 7,108 $ 12,473 $ 5,365 75.5%
12FY21 ‐ Expenditures Highlights
Fund 8001
Expenditures for Fund 8001 in FY2021 are projected to be $325.1M, an
increase of $20.6M or 6.8% over the FY2020 Estimate
Personnel expenditures are budgeted to increase by $9.8M, or 9.4%, primarily due to the
realignment of the IAH and HOU staff into Operations and Terminal Management Groups,
partially offset by an increase in vacancy factor (188 FTE’s in FY2021 vs 118 FTE’s in FY2020)
Other Services & Charges are budgeted to increase by $12.0M, or 6.3%, driven by the following:
$4.3M increase in Mgmt Consulting related to increased environmental monitoring and asset
assessments, energy management program, marketing initiatives, financial/strategic and parking
consultants
$2.4M increase related to Parking contract at IAH and HOU driven by higher hourly pay rates
$2.0M due to various contractual increases in facility maintenance basic services for Skyway, Subway,
APM, HVAC and Aircraft Support offset by OSR’s now being charged to R&R (8010)
$0.9M increase related to contractual increases for security and waste disposal
$0.9M attributed to HAS portion of rate increase for property insurance
$0.5M for increases for HPD
Net all other $0.6M increase
Supplies and Non‐Capital Equipment are budgeted to decrease by $1.2M, or 12.4%, driven by
the use of Fund 8010 (Renewal & Replacement) to fund eligible costs.
HAS pays $95.6M to City of Houston in FY21 Budget for services provided by HPD, HFD, FMD,
HR, IT, Legal, Water/Sewer, etc.
13FY21 – Net Change to FY2020
Fund 8001 ($ in thousands)
Line Item Amount
FY20 Estimate $304,529
Contractual and Other Increases
New conveyance and aircraft support maintenance contracts $2,897
Parking services salary increases $2,380
Increase in health benefits $1,331
Contractual increases in maintenance contracts $986
Property insurance $943
Hope 1% pay increase $826
Other $527
Subtotal Contractual and Other Increases $9,890
Proposed Budget Increases/(Decreases)
Salaries & Benefits – Realignment w/ vacancy factor (188 FTE FY21 vs. 118 FTE FY20) $8,744
Asset assessments and environmental monitoring $1,497
Supplies $1,015
Other (559)
Subtotal Proposed Budget Increases/(Decreases) $10,697
Total Increase/(Decreases) $20,587
FY21 Proposed Budget Fund 8001 $325,116
14FY21 ‐ Expenditures Highlights
Fund 8012
Expenditures for Fund 8012 in FY2021 are projected to be $12.5M,
an increase of $5.4M or 76% over the FY2020 Estimate
The increase is primarily driven by the following:
+ $2.0M ‐ Replacement of various core switches in the HAS network that are
nearing end of life and new servers for the access control system at IAH
+ $1.6M ‐ IAH AOC project including interactive video display wall and flooring
requirements
+ $0.7M – Upgrade of HOU FIDS that did not occur in FY2020
+ $0.5M – Replacement of apron and gate light fixtures and centerline lights on
Runway 4/22 at HOU with LED lights
+ $0.5M – Upgrades/repairs to maintenance facilities at HOU
+ $0.2M ‐ Installation of “no smoke” exhaust filtration systems at IAH and HOU ARFF
stations
15FY21 Personnel vs Non Personnel
($ in thousands)
FY 2021 Fund 8001 Budget: $325,116
Non‐Personnel Breakdown
Police & Fire Other interfund
53,922 Utilities
24,004 17,687
Personnel 26%
11% 8%
$114,075 Non‐Personnel
35% 211,040 Building
maintenance Other services
65% 32,469 2,394
16% 1%
Contractual Non capital
services Supplies outlay
72,084 6,601 1,880
34% 3% 1%
16Budget History ($ in Thousands)
$350,000
99%
$300,000
97%
$250,000
95%
$200,000
93%
$150,000
91%
$100,000 89%
$50,000 87%
$‐ 85%
FY15 FY16 FY17 FY18 FY19 FY20 FY21
Current Budget $303,960 $292,786 $305,850 $310,840 $316,114 $335,070 $325,116
Actual / Projection $268,800 $286,922 $293,307 $298,068 $304,450 $304,529 $325,116
Actual % of Budget 88% 98% 96% 96% 96% 91% 100%
The average annual growth rate in budget expense FY15 to FY21 is 1.1%.
17Questions?
18Appendix
19Restricted Account Details
($ in thousands)
GL Description Justification & Cost Drivers FY21
Proposed
Budget
Interfund Police Service HAS cost of services supported by Houston Police Department at the airports. $33,648
Interfund Fire Protection HAS cost for Aircraft Rescue and Fire Fighting (ARFF) services supported by 152 $20,274
Services employees of the HFD assigned to Stations 54, 81, 92 and 99; staff provide
emergency response services for hazardous materials, technical rescue and
aircraft fire fighting and rescue incidents at the airports.
Electricity HAS cost for electricity accounts which are administered by the SPD and COH $12,932
Finance
Insurance Fees Cost for monthly property insurance premiums $6,938
Drainage Fee Service Fee is based on imperious service $4,839
Chargeback
Interfund Vehicle Services HAS cost for repair, maintenance and administrative support from FMD for all $3,800
rolling stock equipment
Indirect Cost Recovery HAS cost for services administered through the General Fund $3,063
Sewer Services HAS cost for sewer services which are administered by the Combined Utility $2,123
System (CUS) of Houston Public Works
20Restricted Account Details – Continued
($ in thousands)
GL Description Justification & Cost Drivers FY21
Proposed
Budget
Water Services HAS cost for water services administered by the Combined Utility System (CUS) $1,963
of Houston Public Works
Natural Gas HAS cost for natural gas accounts administered by SPD and COH Finance $1,768
Interfund HR Client Services HAS cost for HR operations reflecting health benefits and restricted account $1,472
increase
Application Services HAS cost for Microsoft Enterprise licenses, SAP license maintenance and $1,462
support, various enterprise application and server support personnel,
eSignature, project management, Infor, eDiscovery, Cyber Security Office
software and support, HITS budget support via the Finance Department and
other technical matters
Electricity Franchise Fee HAS cost for Franchise Administration which regulates electric utilities $379
Interfund Payroll Services HAS cost for payroll services HR operations reflecting health benefits and $336
restricted accounts increase
HEC HAS cost for calls dispatched through Houston Emergency Center $280
GIS Resolving Fund Services HAS cost for personnel, software licenses and maintenance associated with $197
City of Houston’s Enterprise Geographic Information System (EGIS)
21Restricted Account Details – Continued
($ in thousands)
GL Description Justification & Cost Drivers FY21
Proposed
Budget
KRONOS Service Chargeback HAS cost for software license and maintenance costs associated with City of $70
Houston’s Time and Attendance System (KRONOS)
Interfund Legal Services HAS cost for legal services/support from the City of Houston’s Legal $68
Department
Total $95,612
22Functional Org Chart ($’s in thousands)
Layered 5
Level
sample AVIATION DEPARTMENT
org chart
ENTERPRISE FUND
$480,923
FTEs: 1,172
OFFICE OF THE DIRECTOR FINANCE & ADMINISTRATION COMMERCIAL DEVELOPMENT INFRASTRUCTURE TECHNOLOGY
Mario Diaz J'Maine Chubb Ian Wadsworth Bob Barker Tanya Acevedo
‐ $11,114 ‐ $173,364 ‐ $36,718 ‐ $22,054 ‐ $24,125
‐ FTEs: 51 ‐ FTEs: 30 ‐ FTEs: 24 ‐FTEs: 105 ‐ FTEs: 57
‐ Office of the Director ‐ Accounts Payable ‐ Develops & Manages Lease ‐Responsible for: ‐ Provide Systems, Technologies, and
‐ Safety & Emergency Management ‐ Accounts Receivable Agreements ‐ Procuring Information to Enhance Passengers
‐ Office of Business Opportunity ‐ General Accounting ‐ Attracts/Expands Air Carrier Service ‐ Planning Experience
‐ Financial Reporting To/From Houston ‐ Designing ‐ Empowers Houston Airports to
‐ Financial Planning & Analysis ‐ Manages Food & Beverages/Retail ‐ Construc ng & Maintaining all HAS meet its Missions and Vision
‐ Internal Audit and Other Agreements Infrastructure ‐ Ensures Availability of Relevant,
‐ Corporate Strategy ‐ Provide Products to meet Parking ‐ Monitor all Facilities to Optimize Accessible and Forward Thinking
needs at Airports Sustainability and Life‐Cycle Costs Technological Platforms for
Passengers, and Business Partners
GEORGE BUSH INTERCONTINENTAL
HUMAN CAPITAL MANAGEMENT EXTERNAL AFFAIRS WILLIAM P. HOBBY AIRPORT ELLINGTON AIRPORT
AIRPORT
Harlene Hines‐Smith Saba Abashawl Steve Hennigan, Liliana Rambo Arturo Machuca
Steve Hennigan, Liliana Rambo
‐ $4,877 ‐ $5,073 ‐ $148,917 ‐ $49,993 ‐ $4,688
‐ FTEs: 19 ‐ FTEs: 19 ‐ FTEs: 600 ‐ FTEs: 242 ‐ FTEs: 25
‐ Attract, Support, Retain, and ‐ Provides consistent, high‐level ‐ Maintain highest level of Customer ‐ Maintain highest level of Customer ‐ Primary Focus is Development of
Develop Diverse Talent needed to customer service and vital support Service for Passengers, Visitors, Service for Passengers, Visitors, EFD as a Houston Spaceport
Achieve and Sustain Airport's for new and expanded air service Tenants, Team Members. Tenants, Team Members. ‐ Ensuring Safe, Secure, Efficient
Mission, Vision and Strategic development to fuel the local ‐ Ensuring Safe, Secure, Efficient ‐ Ensuring Safe, Secure, Efficient Operating Environment
Objectives economy and increase traffic through Operating Environment Operating Environment ‐ Compliance with Federal, State,
our airports ‐ Compliance with Federal, State, ‐ Compliance with Federal, State, and Local Government Regulations
and Local Government Regulations and Local Government Regulations
23Demographic Information by Gender
All HAS Employee Demographics Paygrade 29+ Demographics by
by Gender Gender
Female, Female,
404 , 37% 39 , 42%
Male, Male, 53 ,
690 , 58%
63%
Data collected on April 27, 2020
24Demographic Information by Ethnicity
All HAS Employees Distribution by Ethnicity Paygrade 29+ Distribution by Ethnicity
ASIAN , 6 ,
6.5%
HISPANIC, BLACK, 17 ,
216 , 19.7% WHITE, 189 , 18.5%
17.3%
Other, 87, ASIAN , 84 ,
DID NOT 7.7% WHITE, 36 ,
8.0% DID NOT
DISCLOSE, 39.1%
333 , 30.4% DISCLOSE,
BLACK, 269 , 27 , 29.3%
24.6%
Native
American/Alaskan HISPANIC,
3, 0.3% 6 , 6.5%
Data collected on April 27, 2020
25FY 2021 Performance Measures
Business Process Measures Priorities FY19 FY20 FY20 FY21
Actual Budget Estimates Proposed
Debt Service Coverage Ratio (DSCR) Sound Financial Management 1.65 1.67 1.50 1.50
Total M&O per Enplaned Passenger – HAS Sound Financial Management $10.01 $11.15 $11.30 $15.26
Total M&O per Enplaned Passenger – HOU Sound Financial Management $6.78 $6.90 $8.47 $9.32
Total M&O per Enplaned Passenger – IAH Sound Financial Management $6.39 $7.15 $8.47 $9.33
Total Operating Revenue per Enplaned Sound Financial Management $16.68 $17.40 $20.58 $21.69
Passenger – HAS
Total Operating Revenue per Enplaned Sound Financial Management $17.79 $18.27 $21.55 $22.76
Passenger – IAH
Total Operating Revenue per Enplaned Sound Financial Management $14.67 $14.22 $17.40 $18.00
Passenger – HOU
Expenditures Adopted Budget vs. Actual Sound Financial Management 96% 98% 90% 100%
Utilization
Revenues Adopted Budget vs. Actual Sound Financial Management 100% 100% 90% 100%
Utilization
26You can also read