DEUTZ - Results for H1 2021- Deutz AG
←
→
Page content transcription
If your browser does not render page correctly, please read the page content below
DEUTZ
– Results for H1 2021 –

August 12, 2021
Disclaimer

Unless stated otherwise, all the figures given in this presentation refer to continuing
operations.

The details given in this document are based on the information available at the
time it was prepared. This presents the risk that actual figures may differ from
forward-looking statements. Such discrepancies may be caused by changes in
political, economic, or business conditions, decreases in the technological lead of
DEUTZ’s products, changes in competition, the effects of movements in interest
rates or exchange rates, the pricing of parts supplied, and other risks and
uncertainties not identified at the time this document was prepared.

The forward-looking statements made in this document will not be updated.

2

Agenda
Agenda

Overview &
highlights of H1 2021

Dr. Frank Hiller | CEO

3
Operational and strategic highlights Significant new order growth, due in part to spending being brought forward; orders on hand up by around 110% year on year Double-digit percentage increases in unit sales and revenue; all application segments saw rises, with the exception of Stationary Equipment Significant improvement in operating profit; cost-saving effects from the successful implementation of Transform for Growth becoming increasingly tangible Confirmation of raised full-year guidance for 2021 despite the supply situation remaining difficult; guidance for free cash flow raised Strategic highlights after the reporting period New strategic partnerships agreed with AGCO and ASKO Hydrogen engine ready for the market 4

Global Transform for Growth efficiency program on track
Timeline for achieving cost savings1
€ million
Targeted cost savings to be achieved through reduction in
100 staff costs and reduction in operating and warranty costs
Voluntary redundancy program taken up by 361 employees
− 109 employees had already left the Company by the end
of H1 2021 having taken voluntary redundancy
− Total of 171 will have left the Company by the end of
2021
Total reduction of workforce2 by 275 compared with the end
of 2019 as a result of Transform for Growth, fixed-term
contracts coming to an end, and natural attrition
0
2020 2021 2022 2023
<
Gross annual cost savings Cost increases 2020–2023
<
Efficiency program provides DEUTZ with basis for securing its long-term competitiveness
5 1 Staff costs and operating and warranty costs. 2 FTEs, excluding temporary workers.
Continued successful implementation of China strategy
Further success for joint venture with SANY in H1 2021: DEUTZ Hunan (SANY JV) production planning
Units (thousands)
− Unit sales of approx. 15,000 engines 250
− Revenue of approx. €125 million Target
200
− EBIT contribution of approx. €3 million 150
Planned increase in unit sales to between 35,000 and 100
CAGR 125%
40,000 engines in 2021
50
-
2019 2020 2021e 2022e .. 202x
6
Expansion of the profitable service business is on course
Revenue New orders Orders on hand
€ million € million € million
Our service target:
+14.5% +19.7% +62.5%
195.4 205.0
approx. €400
million
170.7 171.3 35.1
21.6
revenue in 2021
H1 2020 H1 2021 H1 2020 H1 2021 H1 2020 H1 2021
Stronger business performance in H1 2021 than in the prior-year period.
Lifetime Parts Warranty and Lifecycle Solutions added to full-service portfolio;
DEUTZ's positioning as a full-service provider strengthened
Service components marketed independently under S-DEUTZ label since Q3 2021
7
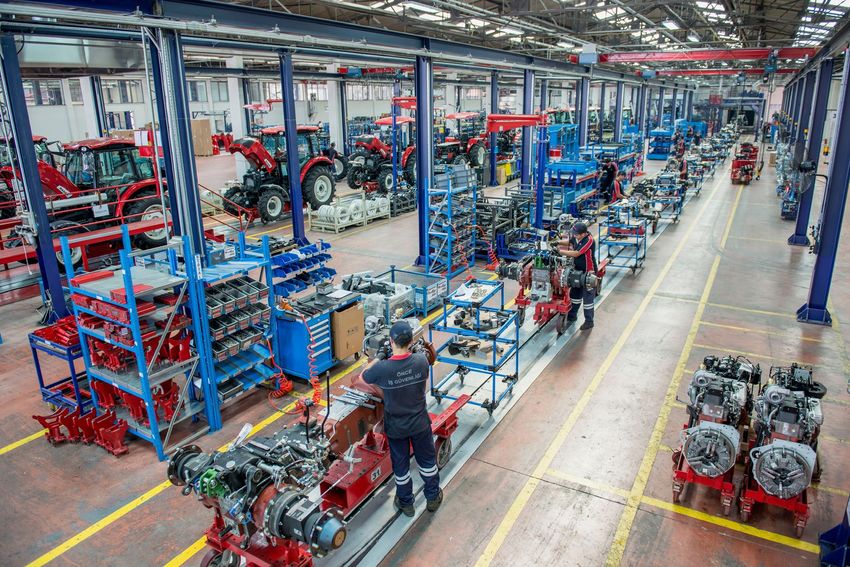
Long-term partnership with AGCO agreed
Supply of updated 6.1 liter and 4.1 liter engines
for use in selected Fendt tractors
Collaboration on development of future
technologies
Possibility of closer collaboration on sub-150 hp
engines and their components being explored
8
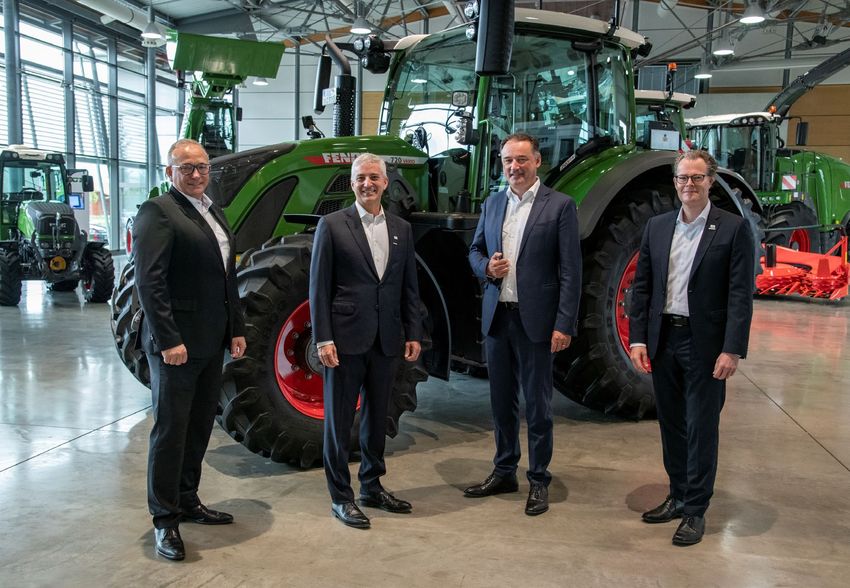
Supply agreement with ASKO
New customer in Turkey, whose existing
engine suppliers are to be phased out and
replaced by DEUTZ
Long-term supply agreement covering the
four brands MST, Basak Traktör, Starken and
ELS Lift
Medium-term expectation is for annual unit
sales in the low tens of thousands
Expansion of service business in Turkey
through ASKO's local service network
Joint venture for local engine manufacturing
planned
9
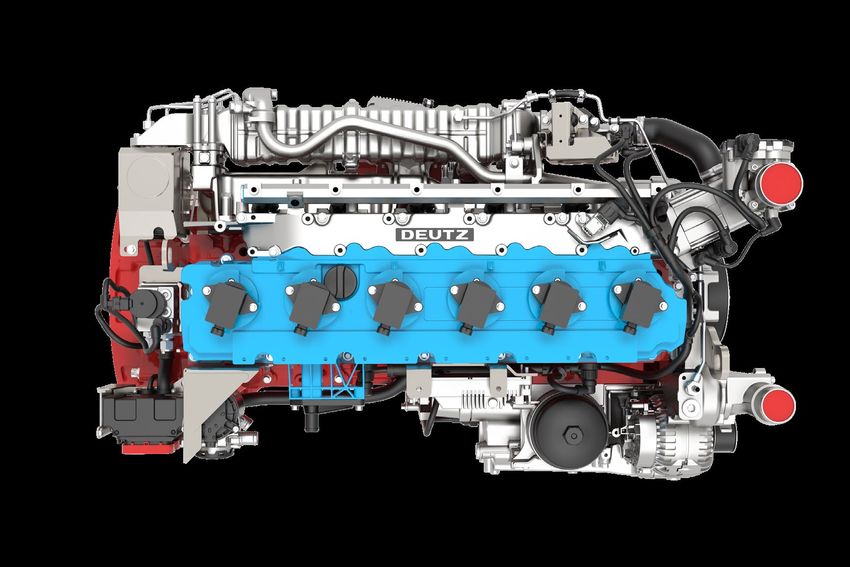
Hydrogen engine ready for the market
TCG 7.8 H2 engine meets eligibility criteria set by the EU
for zero CO2 emission
Designed for use in stationary equipment, generators, and
rolling stock
Pilot application (stationary equipment for power
generation) with a regional utility partner – scheduled to
commence at beginning of 2022
The engine is scheduled to go into full production in 2024
DEUTZ is taking the next steps toward a future of climate-neutral off-highway drive solutions
10Agenda Agenda H1 2021 in numbers Dr. Sebastian C. Schulte | CFO 11
Results for H1 2021
New orders Unit sales Revenue
€ million Units € million
+65.0% +26.8% +24.2%
1,028.8 93,627
approx. 100
73,859 18,196
770.2
623.6 16,244 620.0
< Thereof effects of spending <
brought forward Thereof Torqeedo
H1 2020 H1 2021 < H1 2020 H1 2021
< H1 2020 H1 2021
Significant increase in new orders – positive effects amounting to around €100 million in June 2021 as a result of customer
orders being brought forward in response to price adjustments, longer lead times, and the discontinuation of an engine series
Book-to-bill ratio of 1.34 (H1 2020: 1.01)
Orders on hand of €531.3 million as at June 30, 2021 (June 30, 2020: €253.5 million)
12Revenue in detail
Revenue breakdown by region Revenue breakdown by application segment
H1 2021 (H1 2020) H1 2021 (H1 2020)
Africa and Middle East Europe (excl. Germany) Miscellaneous Construction Equipment
3% (4%) 41% (41%) 7% (8%) 31% (30%)
€25.6 million €318.6 million €58.5 million €238.5 million
+4.1% +24.7% +19.4% +29.0%
Stationary
Equipment Material Handling
Asia-Pacific 7% (9%) 16% (13%)
18% (18%) €770.2 million €770.2 million
(€620.0 million) €52.9 million (€620.0 million) €120.2 million
€138.1 million -5.0% +51.4%
+28.0%
Agricultural
Machinery
Americas Germany 14% (13%) Service
17% (18%) 21% (19%) €106.2 million 25% (27%)
€130.8 million €157.1 million +30.3% €195.4 million
+16.3% +31.5% +14.5%
13Continued improvement in earnings
Operating profit (EBIT before exceptional items) (€ million) Operating profit in H1 20211 improves to €16.8 million
EBIT margin before exceptional items (H1 2020: operating loss of €49.9 million) due to
− absence of payments to suppliers going through insolvency
+€54.1 million / +17.3 PP
proceedings
16.0 − growth in the volume of business and the associated
economies of scale
0.8
+3.7% − cost savings achieved through implementation of the
efficiency program
+0.2%
-2.5%
EBIT margin before exceptional items1 increases to 2.2%
-5.1% -9.1 in H1 2021 (H1 2020: minus 8.0%)
-15.7
Net income before exceptional items1 amounts to
€14.0 million (H1 2020: net loss of €52.3 million)
-13.6%
Earnings per share before exceptional items1 came to €0.12
-38.1 (H1 2020: minus €0.43)
Q2 2020 Q3 2020 Q4 2020 Q1 2021 Q2 2021
14 1 Exceptional items amounting to an expense of €0.7 million recognized in relation to the efficiency program initiated at the beginning of 2020.R&D spending, capital expenditure, and working capital
Net R&D spending1 Capital expenditure1,2 Working capital
€ million € million € million
-14.7% -13.6% +4.3%
7.5%
5.1% 18.1% 17.0%
46.2
39.4 38.9 235.0 245.1
33.6
16.8
10.4
H1 2020 H1 2021 H1 2020 H1 2021 Dec. 31, 2020 Jun. 30, 2021
R&D ratio1 Thereof additions as a result of leases3 Working capital ratio (as at the balance sheet date)4
R&D expenditure lower overall than in prior-year period
Significantly less capital expenditure compared with the high level in H1 2020, which had been influenced by the extension
of leases and the replacement of expired leases
Decrease in working capital ratio due to rigorous management of working capital across the Group
15
1 After deducting grants. 2 Capital expenditure on property, plant, and equipment (including right-of-use assets for leases) and intangible assets, excluding capitalization of R&D.
3 Right-of-use assets for leases under IFRS 16. 4 Working capital as at the balance sheet date divided by revenue for the previous twelve months.Cash flow and net financial position
Cash flow from operating activities Free cash flow1 Net financial position
€ million € million € million
+€88.4 million +€95.4 million
44.7
9.7
-58.0 -61.4
-85.7 -83.8 -84.3
-43.7
H1 2020 H1 2021 H1 2020 H1 2021 Dec. 31, 2020 Jun. 30, 2021 Thereof lease liabilities
Sharp rise in cash flow from operating activities compared with H1 2020, mainly thanks to improved earnings performance
and more favorable level of working capital
Substantial year-on-year increase in free cash flow owing to improvement in cash flow from operating activities and reduction
in investing activities
Small rise in net debt as at June 30, 2021 compared with the end of 2020
16 1 Cash flow from operating activities and from investing activities less interest expense.Sufficient medium- and long-term funding options
Equity and equity ratio Syndicated credit lines Long-term bank loans
€ million € million / term € million / repayment profile
1,253.5
1,180.5
160
45.3%
44.3%
150
535.2 555.1
10.3 8.4
0 65 0.0
Dec. 31, 2020 Dec. 31, 2021 up to 1 year 1 to 5 years up to 1 year 1 to 5 years over 5 years
Total equity and liabilities Equity Equity ratio Available credit lines Thereof utilized
Growth in balance sheet due to the increase in current assets and current liabilities
Equity ratio remains at a comfortable level and above the target figure of 40%
Unused credit lines totaling €245 million are available
− €150 million with a term ending in November 2021, with an extension option
− €160 million with a term ending in June 2024, of which €65 million has been utilized
17Agenda Agenda Guidance Dr. Frank Hiller | CEO 18
Group guidance for 2021
Guidance for 2021
Unit sales 140,000 to 155,000 DEUTZ engines1
Revenue €1.5 billion to €1.6 billion
EBIT margin before exceptional 1.0–2.0 %
items
Free cash flow Negative low double-digit million euro amount
(previously: negative low- to mid-double-digit million euro amount)
Difficulties with the supply of some components will persist for the time being
Confirmation of raised full-year guidance for 20212 despite the supply situation remaining difficult
Final instalment of the purchase price for the sale of the Cologne-Deutz site3 now expected in 2022
Free cash flow guidance for 2021 raised despite postponed payment of the final instalment
19 1 Excluding electric boat drives from DEUTZ subsidiary Torqeedo. 2 See the ad hoc disclosure dated April 19, 2021.
3 The amount and the date of the payment depend on when the development plan for the site is formally approved by the City of Cologne and so cannot be precisely determined yet.Medium-term targets for 2023/2024
Technology-neutral approach to development of the product
portfolio and expansion of the high-margin service business
Our targets for 2023/2024:
> €2 billion
Implementation of regional growth initiatives
Systematic implementation of the Transform for Growth
efficiency program, with targeted gross annual cost savings revenue
of around €100 million in total from the end of 2022
− Adjustment of staff costs and operating costs
− Optimization of the global production network 7–8%
− Reduction of complexity EBIT margin
before exceptional items
Share of consolidated revenue attributable
to E-DEUTZ of 5–10%
DEUTZ has taken the steps that are needed for sustained profitable growth
20SAVE THE DATE
Agenda
Capital Markets Day 2021
Wednesday, November 17, 2021
at the Coreum |
Stockstadt am Rhein
21Annex
Segment overview

New orders                   H1 2021    H1 2020       YoY    Revenue                      H1 2021    H1 2020       YoY
€ million                                          change    € million                                          change
                                                       (%)                                                          (%)

DEUTZ Compact Engines           808.2      439.9     83.7    DEUTZ Compact Engines           589.5      453.7     29.9
DEUTZ Customized Solutions      182.3      165.4     10.2    DEUTZ Customized Solutions      153.7      145.0      6.0
Other                            39.8       19.5    104.1    Other                            28.5       22.5     26.7
Consolidation                    -1.5       -1.2     -25.0   Consolidation                    -1.5       -1.2     -25.0
Total                         1,028.8      623.6     65.0    Total                           770.2      620.0     24.2

Unit sales                   H1 2021    H1 2020       YoY    EBIT before except.          H1 2021    H1 2020       YoY
Units                                              change    items                                              change
                                                       (%)   € million                                              (%)

DEUTZ Compact Engines          67,399     48,173     39.9    DEUTZ Compact Engines             0.3      -49.8         -
DEUTZ Customized Solutions      8,032      9,442     -14.9   DEUTZ Customized Solutions       17.5        6.6    165.2
Other                          18,196     16,244     12.0    Other                            -1.0       -6.7     85.1
Consolidation                      0          0         -    Consolidation                    0.0        0.0         -
Total                          93,627     73,859     26.8    Total                            16.8      -49.9         -
23
Income statement
€ million H1 2021 H1 2020
Revenue 770.2 620.0
Cost of sales -631.0 -534.8
Research and development costs -45.9 -49.6
Selling and administrative expenses -79.7 -75.6
Other operating income 12.0 6.2
Other operating expenses -10.9 -15.8
Impairment of financial assets and reversals thereof -1.1 -1.4
Profit/loss on equity-accounted investments 2.5 1.1
EBIT 16.1 -49.9
thereof exceptional items -0.7 0.0
thereof operating profit/loss (EBIT before exceptional items) 16.8 -49.9
Financial income, net -2.8 -1.7
Income taxes 0.0 -0.7
Net income 13.3 -52.3
thereof attributable to shareholders of DEUTZ AG 13.3 -52.3
thereof attributable to non-controlling interests 0.0 0.0
Earnings per share (basic/diluted, €) 0.11 -0.43
24Balance sheet: assets € million Jun. 30, 2021 Dec. 31, 2020 Property, plant and equipment 362.5 361.7 Intangible assets 188.7 197.2 Equity-accounted investments 54.8 50.3 Other financial assets 4.7 4.4 Non-current assets (before deferred tax assets) 610.7 613.6 Deferred tax assets 76.7 74.2 Non-current assets 687.4 687.8 Inventories 324.7 274.2 Trade receivables 136.6 113.8 Other receivables and assets 34.8 32.8 Receivables in respect of tax refunds 8.0 7.2 Cash and cash equivalents 62.0 64.7 Current assets 566.1 492.7 Total assets 1,253.5 1,180.5 25
Balance sheet: equity and liabilities

€ million                                                     Jun. 30, 2021     Dec. 31, 2020
 Issued capital                                                        309.0             309.0
 Additional paid-in capital                                             28.8              28.8
 Other reserves                                                          -0.9              -3.9
 Retained earnings and accumulated income                              218.0             201.1
 Equity attributable to shareholders of DEUTZ AG                       554.9             535.0
 Non-controlling interests                                                0.2               0.2
 Equity                                                                555.1             535.2
 Provisions for pensions and other post-retirement benefits            137.4             148.5
 Deferred tax liabilities                                                 0.5               0.6
 Other provisions                                                       33.4              37.5
 Financial debt                                                         57.1              58.3
 Other liabilities                                                        5.7               5.9
 Non-current liabilities                                               234.1             250.8
 Provisions for pensions and other post-retirement benefits             11.8              11.9
 Other provisions                                                       82.0              83.3
 Financial debt                                                         89.2              90.2
 Trade payables                                                        216.2             153.0
 Liabilities arising from income taxes                                    2.2               2.0
 Other liabilities                                                      62.9              54.1
 Current liabilities                                                   464.3             394.5
 Total equity and liabilities                                         1,253.5           1,180.5

26
Cash flow statement (condensed)

€ million                                                                      H1 2021    H1 2020

 EBIT                                                                              16.1      -49.9
 Cash flow from operating activities                                               44.7      -43.7
 Capital expenditure on intangible assets, property, plant and equipment and
                                                                                  -32.6      -39.8
 investments
 Proceeds from the sale of non-current assets                                       0.1       0.2
 Cash flow from investing activities                                              -32.5      -39.6
 Cash flow from financing activities                                              -15.6      58.3
 Change in cash and cash equivalents                                               -3.4      -25.0

27
Questions &
answers
28Thank you for
your attention!
29Financial calendar and contact details
Financial calendar Contact
Q3 2021 quarterly statement November 10, 2021 Christian Ludwig, CFA
SVP Communications & Investor Relations
2021 annual report March 17, 2022
+49 (0)221 822 3600
2022 Annual General Meeting April 28, 2022 christian.ludwig@deutz.com
Q1 2022 quarterly statement May 5, 2022
Follow us:
30You can also read