RNC MINERALS Q2 2018 Results Conference Call - August 15, 2018
←
→
Page content transcription
If your browser does not render page correctly, please read the page content below
RNC MINERALS

Q2 2018 Results
Conference Call

      August 15, 2018

            TSX:RNX
Disclaimer
Cautionary Statements Concerning Forward-Looking Statements
This presentation provides certain financial measures that do not have a standardized meaning prescribed by IFRS. Readers are cautioned to review the stated footnotes regarding use
of non-IFRS measures.
This presentation contains "forward-looking information" including without limitation statements relating to the liquidity and capital resources of RNC, production and cost guidance,
the potential of the Beta Hunt and Reed mines, and the potential of the Dumont development project and Orford Mining’s Qiqavik , West Raglan, Jones-Keystone Loflin and Landrum-
Faulkner exploration projects..
Forward-looking statements involve known and unknown risks, uncertainties and other factors which may cause the actual results, performance or achievements of RNC to be
materially different from any future results, performance or achievements expressed or implied by the forward-looking statements. Factors that could affect the outcome include,
among others: future prices and the supply of metals; the results of drilling; inability to raise the money necessary to incur the expenditures required to retain and advance the
properties; environmental liabilities (known and unknown); general business, economic, competitive, political and social uncertainties; accidents, labour disputes and other risks of
the mining industry; political instability, terrorism, insurrection or war; or delays in obtaining governmental approvals, projected cash costs, failure to obtain regulatory or shareholder
approvals. For a more detailed discussion of such risks and other factors that could cause actual results to differ materially from those expressed or implied by such forward-looking
statements, refer to RNC's filings with Canadian securities regulators , including the most recent Annual Information Form, available on SEDAR at www.sedar.com.
Although RNC has attempted to identify important factors that could cause actual actions, events or results to differ materially from those described in forward-looking statements,
there may be other factors that cause actions, events or results to differ from those anticipated, estimated or intended. Forward-looking statements contained herein are made as of
the date of this presentation and RNC disclaims any obligation to update any forward-looking statements, whether as a result of new information, future events or results or
otherwise, except as required by applicable securities laws.
Cautionary Statement Regarding the Beta Hunt Mine
The decision by SLM to produce at the Beta Hunt Mine was not based on a feasibility study of mineral reserves, demonstrating economic and technical viability, and, as a result, there
may be an increased uncertainty of achieving any particular level of recovery of minerals or the cost of such recovery, including increased risks associated with developing a
commercially mineable deposit. Historically, such projects have a much higher risk of economic and technical failure. There is no guarantee that that anticipated production costs will
be achieved. Failure to achieve the anticipated production costs would have a material adverse impact on SLM’s cash flow and future profitability. It is further cautioned that the PEA
is preliminary in nature and includes inferred resources that are considered too speculative geologically to have the economic considerations applied to them that would enable them
to be categorized as mineral reserves. No mining feasibility study has been completed on Beta Hunt. Mineral resources are not mineral reserves and do not have demonstrated
economic viability. There is no certainty that the PEA will be realized.
Cautionary Note to U.S. Readers Regarding Estimates of Resources
This presentation uses the terms "measured" and "indicated" mineral resources and "inferred" mineral resources. The Company advises U.S. investors that while these terms are
recognized and required by Canadian securities administrators, they are not recognized by the SEC. The estimation of "measured" and "indicated" mineral resources involves greater
uncertainty as to their existence and economic feasibility than the estimation of proven and probable reserves. The estimation of "inferred" resources involves far greater uncertainty
as to their existence and economic viability than the estimation of other categories of resources. It cannot be assumed that all or any part of a "measured", "inferred" or "indicated"
mineral resource will ever be upgraded to a higher category.
Under Canadian rules, estimates of "inferred mineral resources" may not form the basis of feasibility studies, pre-feasibility studies or other economic studies, except in prescribed
cases, such as in a preliminary economic assessment under certain circumstances. The SEC normally only permits issuers to report mineralization that does not constitute "reserves" as
in-place tonnage and grade without reference to unit measures. Under U.S. standards, mineralization may not be classified as a "reserve" unless the determination has been made
that the mineralization could be economically and legally produced or extracted at the time the reserve determination is made. U.S. investors are cautioned not to assume that any
part or all of a "measured", "indicated" or "inferred" mineral resource exists or is economically or legally mineable. Information concerning descriptions of mineralization and
resources contained herein may not be comparable to information made public by U.S. companies subject to the reporting and disclosure requirements of the SEC.

                                                                                                                                                                                               2
Dumont Nickel-Cobalt Project
Central strategic focus on advancing toward a construction decision for the world’s largest
undeveloped nickel and cobalt reserves and a leading Battery Metals Project
2nd largest nickel reserve in the world,
5th largest nickel sulphide discovery ever
8th largest cobalt reserve in the world,
2nd largest undeveloped reserve
Fully permitted, shovel ready with feasibility
study complete
RNC - Waterton (RNC 28%) JV to advance Dumont
and grow nickel business
Cobalt 27 royalty acquisition underscores that
Dumont “ranks among the top battery metals
projects in the world and one of only a few nickel-
cobalt projects that will be built this cycle”1
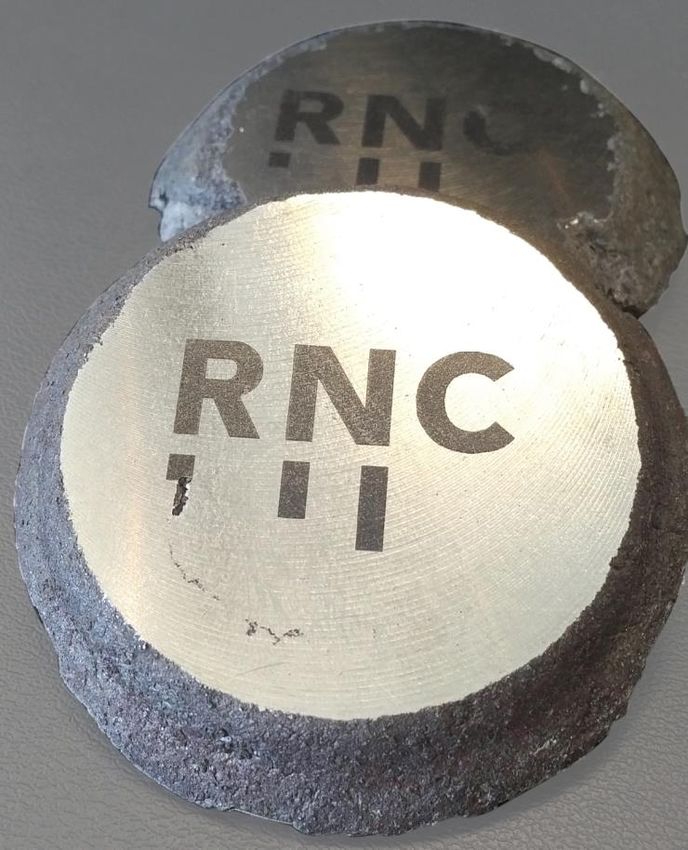
Ferro-nickel puck produced from Dumont concentrate
Positioned to deliver nickel and cobalt to global
1 Cobalt 27
markets before the end of 2020
news release February 22, 2018
3
Beta Hunt
Operating Performance
Continued improvements in grade and cash mining costs, despite constraints on tonnes
mined during Q2
Gold Material Mined Gold Mined Grade Gold Mining Cash Cost
(tonnes per day) (grams per tonne) (US$ per ounce)
3.50 1,400
2,000
3.00 1,200
1,500 2.50 1,000
2.00 800
1,000 1.50 600
1.00 400
500
0.50 200
0 0.00 0
Mined production lower than planned in Q2 due to a combination of a focus on mining the very high
grade specimen gold in certain areas of the mine (air leg / jack leg) and the delays in completing
financing for the mine in May and June which led to production constraints
4
Beta Hunt Mine – Q2 2018 Overview
Beta Hunt Mine Q2 2018 Q1 2018 Q4 2017 Q3 2017 Q2 2017
Q2 gold grade increased 24% quarter-
Gold tonnes mined (000s) 132 169 160 145.5 123
over-quarter to 3.14 g/t as production 3.14 2.54 2.47 2.24
Gold mined grade (g/t)1 2.09
from higher grade stopes commenced Gold tonnes milled (000s) 112 110 158 182.3 98.1
Mined gold production was 13,320 oz in Gold mill grade (g/t)1 3.24 2.36 2.39 2.23 2.07
Gold milled (ounces) 11,844 8,372 12,128 13,047 6,535
Q2, down slightly from Q1 due lower
Gold mined (ounces)1,2 13,320 13,780 12,722 10,489 8,281
mined tonnes
Gold sales (ounces) 11,508 7,978 12,896 8,659 5,891
Tonnes mined in Q2 was 132 kt, down Nickel tonnes mined (000s) 8.3 7.8 8.6 8.3 10.1
from 169 kt in Q1 as a focus on mining Nickel tonnes milled (000s) 8.3 8.7 7.0 10.2 9.6
specimen gold and financing delays Nickel mill grade, nickel (%) 2.55 1.89 2.64 2.84 2.84
Nickel in concentrate tonnes (000s) 0.19 0.14 0.16 0.25 0.24
constrained tonnages
Gold mining cash cost per ounce
Beta Hunt Gold and Nickel Operation5 Q2 2018 Q2 2017
improved by 19% to US$682 per ounce
Gold mining cash cost per ounce (US$ per ounce mined) $682 $1,032
from US$812 per ounce in Q1 Gold all-in sustaining cost, net of by-product credits (US$ per ounce sold)
3,4 $1,230 $1,786
Gold sales were 11,508 ounces in Q2, Gold C1 cash operating cost, net of by-product credits (US$ per ounce
an increase of 44% from Q1 (Q1 sales sold) 3,4
$1,185 $1,687
adversely impacted by tolling schedules Nickel C1 cash operating cost (US$ per lb. sold)4 $3.84 $3.31
and above normal seasonal rains) Nickel C1 cash operating cost (US$ per tonne sold)4 $8,467 $7,293
Nickel all-in sustaining cost (AISC) (US$ per lb. sold)4 $3.93 $4.15
Nickel all-in sustaining cost (AISC) (US$ per tonne sold)4 $8,661 $9,150
1. The difference in gold sales ounces and gold mined ounces is due to timing differences in receipt of gold sales depending on completion date of tolling campaigns.
2. As of June 30, 2018, 126.5 kt of gold mineralization from the first and second quarter 2018 production remained on the ROM pad for tolling in the subsequent quarter, compared to 105.5 kt of gold as of March 31, 2018.
3. Gold operations declared commercial production in the second quarter of 2017 with effect on July 1, 2017. Prior to July 1, 2017, gold operations were in the ramp up stage towards commercial production and operating and sustaining
costs per ounce for those periods are not comparable to other companies.
4. All-in sustaining cost, net of by-product credits, cash operating cost, net of by-product credits, cash operating cost, cash operating cost per tonne, all-in sustaining cost, and all-in sustaining cost per tonne are not recognized measures
under IFRS. Such non-IFRS financial measures do not have any standardized meaning prescribed by IFRS and are therefore unlikely to be comparable to similar measures presented by other issuers. Management uses these measures
internally. The use of these measures enables management to better assess performance trends. Management understands that a number of investors, and others who follow RNC’s performance, assess performance in this way.
Management believes that these measures better reflect RNC’s performance and are better indications of its expected performance in future periods. This data is intended to provide additional information and should not be considered
in isolation or as a substitute for measures of performance prepared in accordance with IFRS.
5. Reference is made to the Non-IFRS Measures section in RNC’s MD&A for the period ended June 30, 2018.
5
Reed Mine – Q2 2018 Overview
Reed Mine Q2 2018 Operating Review (100% basis)
Q2 production of 2.9 MM lbs copper
(1.3 kt) and 603 oz of gold
Q2 2018 Q2 2017
(RNC’s portion)
Ore (tonnes hoisted) 142,132 121,115
Q2 AISC US$0.45/lb copper (Q2 2018 Ore (tonnes milled) 161,505 123,988
Copper (%) 3.25 4.12
costs reflect the exclusion of mining
Zinc (%) 0.75 0.41
and general and administration costs Gold (g/t) 0.79 0.47
(as RNC has elected to dilute ownership Silver (g/t) 8.34 6.19
rather than continue to pay these costs
in final quarters of mine operation) Reed Mine Q2 Production and Costs (RNC’s portion)1
Q2 2018 Q2 2017
RNC’s interest to be diluted to Copper contained in concentrate (kilo tonnes) 1.34 1.41
approximately 26% Gold contained in concentrate (ounces) 603 293
Copper cash operating cost per pound sold 1,2 0.44 1.58
2018 production guidance (RNC’s Copper all-in sustaining cost per pound sold 1,2 0.45 1.66
share): 2.7-3.0 kt copper and
1. Cash operating cost per pound, and all-in sustaining cost per pound, are not recognized measures under IFRS.
0.8-1 koz of gold Such non-IFRS financial measures do not have any standardized meaning prescribed by IFRS and are therefore
unlikely to be comparable to similar measures presented by other issuers. Management uses these measures
Mine production ended in Q3/18; internally. The use of these measures enables management to better assess performance trends. Management
understands that a number of investors, and others who follow RNC’s performance, assess performance in this
way. Management believes that these measures better reflect RNC’s performance and are better indications of
processing of stockpiled ore is expected its expected performance in future periods. This data is intended to provide additional information and should
not be considered in isolation or as a substitute for measures of performance prepared in accordance with IFRS.
to continue into the fourth quarter 2. RNC has elected effective January 1, 2018 to allow its interest in the Reed Project to be diluted by not funding its
share of mining costs and general and administration costs related to production. Consequently those costs are
not included in the cost computation.
6Q2 2018 Summary
Adjusted EBITDA1 from continuing operations for the three months ended June
30, 2018 was of $9.3 million or $0.03 per share compared to $3.5 million or $0.01
per share for the three months ended June 30, 2017
In final stages of the sale process for Beta Hunt, which we expect to announce by
the end of the month2
Orford Mining (35% RNC) exploration programs underway in at Qiqavik in Northern
Quebec and the U.S. Carolinas
RNC is focused on maximizing the value of its interest in the Dumont JV.
Dumont remains one of the world's premier battery metals projects containing:
Largest undeveloped reserves of nickel
Second largest undeveloped reserves of cobalt
One of the only large-scale fully permitted shovel ready nickel-cobalt projects
1. EBITDA is a non-IFRS measure. Please refer to ”Adjusted EBITDA and Adjusted EBITDA per share” section of RNC’s Management Discussion & Analysis for
the period ended June 30, 2018
2. RNC notes that there can be no assurance that the sale process will result in a completed transaction or that, if a transaction is undertaken, as to final
terms and timing.
7RNC – Focused on Value Creation
Quebec, Canada Western Australia Quebec and Carolinas Manitoba, Canada
Dumont Nickel-Cobalt Beta Hunt Mine Orford Mining (~35%) Reed Mine (27%)
Project (28%) Gold, Nickel Producer Exploration Spin-Out
2nd largest nickel reserve Massive exploration High grade gold exploration Copper Producer
in the world, 5th largest potential - known gold projects in Northern Quebec
nickel sulphide discovery showings over 4 km strike, and U.S. Carolina Gold Belt 2018 Production
open in three directions, Guidance:
ever 2018 exploration following-
limited exploration at depth Copper: 2.7-3.0 kt;
8th largest cobalt reserve Q2 2018: mined production up on successful 2017 drill
Gold: 0.8-1 koz (RNC’s
(2nd largest undeveloped of 13.3 koz of gold and 8.3 program: multiple high-grade
share)
cobalt reserve) kt of nickel gold drill intersections up to
Dumont Ni-Co Project: Infrastructure in place to 13.7 g/t, five new surface Mine production ended
structurally low cost, large support much larger gold discoveries up to 457 g/t Au in Q3/18; processing of
scale, shovel ready operation confirm 40-km high-grade stockpile ore ongoing
“Qiqavik break” gold system
RNC - Waterton (RNC Non-core asset, strategic
28%) JV to advance alternative process Exploration underway on
underway Carolina Gold Belt properties
Dumont and grow nickel
business Trading on TSX-V: ORM
8Corporate Overview
Share Structure1:
Basic Shares Outstanding1: 384.7 million
Convertible (price: C$0.2537)2 15.1 million
Options (ave. exercise price: C$0.33) 35.1 million
Warrants (exercise price: C$0.43) 3 23.2 million
Deferred/Restricted Share Units 6.3 million
Contingent Shares 7.0 million
Fully Diluted Shares Outstanding: 471.5 million
Directors and Officers Share Ownership: ~3%
Balance Sheet Highlights:
Cash and Cash Equivalents4: C$6.8 million
Market Capitalization1: C$34.6 million
1. Shares outstanding, fully diluted shares outstanding, shareholdings and market capitalization as at August 13, 2018
2. Assumes conversion of US$3 million principal into RNC common shares in March 2019; US/C $ exchange rate at December 14, 2017
3. 16.5 million warrants @ C$0.50, 5.9 million warrants @ C$0.24 and 0.8 million compensation warrants @ C$0.34
4. Cash and cash equivalents as at June 30, 2018
www.royalnickel.com 9You can also read


