DEVELOPMENT OF A THERMO-ACOUSTIC DEVICE FOR THE CONVERSION OF SOUND WAVES INTO COLD AIR
←
→
Page content transcription
If your browser does not render page correctly, please read the page content below
ACTA TECHNICA CORVINIENSIS – Bulletin of Engineering
                                                                          Tome XIV [2021] | Fascicule 1 [January – March]

                                             1.Anayet   U. PATWARI, 1.Md. Sayeed Ul HASAN, 1.Md. Saiful ISLAM

DEVELOPMENT OF A THERMO-ACOUSTIC DEVICE FOR THE
CONVERSION OF SOUND WAVES INTO COLD AIR
1. Department   of Mechanical and Production Engineering, Islamic University of Technology (IUT), Dhaka, BANGLADESH

Abstract: Refrigerants play a decisive role in determining the cooling performance of household and commercial refrigerators.
In addition to being toxic, flammable in nature, harmful to health and also possess the potential threat to environmental crisis
like Global warming, Ozone Layer Depletion when released to atmosphere. Different approaches to establish a feasible alternate
to conventional refrigeration system has been undertaken in recent times. Thermo acoustic refrigerator (TAR) can a practicable
solution. This technology uses high intensity sound wave to convert mechanical energy to produce thermal gradient with the
help of a speaker in a resonator. In order to further improve the performance of a TAR, optimization of the sound wave is
important. Effect of sound waves of different levels of intensity, pitch and amplitude has been investigated in this study. Also
use of Phonics as input to the system is also investigated. It was noticed that maximum thermal gradient was achieved while
using sinusoidal waves as input signal.
Keywords: thermo acoustics, refrigerator, cooling performance, sound waves, thermo acoustic refrigerator (TAR), intensity,
pitch and amplitude

INTRODUCTION                                                      to optimize the design and performance of thermos-acoustic
Thermo acoustics is an emergent technology that uses the          refrigerator. They proposed a systematic approach that
phenomenon of interaction of sound fields with solids to          provides fast engineering estimates for initial design
develop heat pumps or heat. Sound waves in air are                calculations based on first law analysis [7]. Different studies
longitudinal waves. The medium in which they move                 to predict the impact of different parameters on the
undergoes vibrations, thus experiences compression and            performance of thermos-acoustic refrigerator have been
rarefaction. This is associated with change in temperature        undertaken. Akhavanbazaz et al. investigated the impact of
and pressure. When the gas carrying a wave is brought in          gas blockage on the cooling performance [8]. Anayet U
contact with a solid surface, it absorbs the heat as the gas      Patwari et al. investigated the application of TAR in turning
gets compressed [1]. Acoustic waves cause oscillation while       process and found effective in machining process [9]. In this
propagating through a medium. This oscillation can be used        study, the effect of some design parameters such as wave
as pressure waves on neighboring media. To produce the            pattern, frequency, pitch & amplitude of input signal were
thermo acoustic effect, these oscillations in a gas should        investigated. In addition to that, use of some Phonics as
occur close to a solid surface so that heat can be transferred    input signal as alternate to pure sinusoidal waves were also
to and from the surface. A stack of closely spaced parallel       the key objective of this study. The theme concept of the
plates is placed inside the thermo acoustic device to provide     study is to use this technique for automotive refrigeration
such a solid surface. The thermo acoustic phenomenon              system that can convert any sorts of sound waves like music
occurs by the interaction of the gas particles and the stack      to cold wave for getting cooling effect inside the automobile
plates. The discovery of the thermos-acoustic phenomenon          cabin. From the study, it has been found that using sine wave
goes back to more than a century ago. It was discovered that      at high level of amplitude and pitch enhances the
acoustic oscillations in a pipe might be excited by suitable      performance of thermo-acoustic refrigerator.
placement of a hydrogen flame inside in the late 18th century     ACOUSTICAL THEORY
[2]. The oscillation was also found by glass blowers when a       Thermo acoustics waves cause oscillation while propagating
hot glass bulb was attached to a cool glass tube, i.e. the tube   through a medium. This oscillation can be used as pressure
tip sometimes emitted sound [3]. The investigation on             waves on neighboring media. To produce the thermos-
thermo acoustics began with these occasional findings. But        acoustic effect, these oscillations in a gas should occur close
the significant work in this area was started about two           to a solid surface so that heat can be transferred to and from
decades ago at the Los Alamos National Laboratory by the          the surface. A stack of closely spaced parallel plates is placed
research group of researchers led by Greg Swift. They have        inside the thermos-acoustic device to provide such a solid
developed different types of thermos-acoustic refrigerators       surface. The thermos-acoustic phenomenon occurs by the
and heat engines [4]. Garret et al. developed a Space             interaction of the gas particles and the stack plates. There
Thermo-Acoustic Refrigerator (STAR). The cryocooler was           are three characteristics of the acoustic wave which are
flown on the Space Shuttle Discovery (STS-42) in January,         necessary to understand the thermos-acoustic process.
1992 [5]. Tijani et al. successfully achieved as low              These characteristics are Intensity, amplitude and pitch.
temperature -65°c which is one of the lowest reported
temperature till date [6]. Wetzel et al. developed algorithm

                                                                                                           57 | F a s c i c u l e 1
ACTA TECHNICA CORVINIENSIS – Bulletin of Engineering
Tome XIV [2021] | Fascicule 1 [January – March]
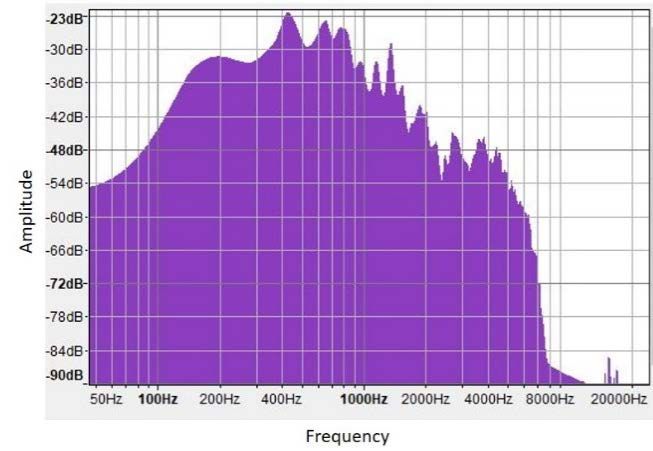
contact surface to exchange heat. Heat exchangers are used
in both sides of the stack.
(a)
Figure 2. Schematic Diagram of TAR developed for this study
A thermocouple is used to determine the temperature
difference between hot and cold air. The brief description of
the different components developed in this study as shown
(b)
in Figure 3 are given below:
Loud speaker:
Loud speaker supplies the required acoustic power to drive
the system. It should be compact, powerful and light weight.
For these reasons an R-2430, 100 watt, 3.5 inch, 3 way
speaker was used. The speaker was kept inside a PVC made
speaker housing as PVC was readily available and thermally
insulating.
(c)
Figure 1. Different wave patterns used in the study
Speaker Housing:
(a) Sinusoidal; (b) Square; (c) Triangular It is made of PVC. Speaker is inserted inside it. Two holes
were drilled at the back, one for electrical wiring of the
The intensity of a wave is the rate of energy per unit time speaker and another for charging the gas.
which is transferred per unit area of a surface that the wave Stack:
impinges on. It’s also gives a measurement of direction of the It is the heart of Thermo-acoustic refrigerator. It is a porous
energy flow in some direction but not in others. The medium that increases the heat exchange surface area. To
amplitude of a sound is the measure of its power and the unit guarantee low thermal conductivity of the stack Mylar sheet
is in decibels. It refers to the distance of the maximum was chosen. A spiral stack of Mylar sheet is constructed
vertical displacement of the wave from its mean position. In wounding around a PVC dowel of 1.5-inch diameter. A
sound, it refers to the magnitude of compression as well as channel structure between the layers is realized with the
expansion experienced by the medium through which the help of 0.25 mm fishing lines. Fishing lines were attached to
sound wave is travelling. It is expressed either as the Mylar sheet with the help of Glue gun and glue sticks.
instantaneous values or mostly as peak values. The frequency For the first 200 lines a distance of 1 cm was maintained and
of a sound wave is what our ear understands as pitch. A for the rest a distance of 3 cm up to the diameter of the stack
higher frequency sound has a higher pitch, and a lower became 3.5 inch. Then it was inserted inside the stack
frequency sound has a lower pitch. Frequency in a sound housing. Housing is made of 3.5 inch PVC pipe. PVC material
wave refers to the rate of the vibration of the sound travelling is chosen for its low thermal conductivity and insulation.
through the medium. The wave pattern configuration is Resonator Tube:
important to know because these effect the pressure Resonator tube is the body of the thermos-acoustic
amplitude inside the tube. Thermo acoustic refrigerator uses refrigerator in which the sound wave propagates. It consists
several waves pattern to generate pressure along the of three major parts. First part consists of a large diameter
resonator tube. In this paper sine wave, square wave and PVC pipe called stack housing which contains the stack,
triangle wave have been used for experimental purpose, followed by a smaller diameter Copper tube and the last part
which is shown in Fig 1. is the Buffer volume. Copper tube has relatively higher
EXPERIMENTAL DESIGN thermal conductivity and its diameter is 2 inch and 29 cm in
Figure 2 shows the construction of a simple thermos- length.
acoustic refrigerator. It contains a resonator tube made of Buffer Volume:
PVC pipe and Copper tube and it contains the inert gas as The buffer volume is to be used to simulate open-end
working fluid. A loud speaker is used to produce the resonator. It is a conical shaped copper tube with a taper
necessary acoustic power to drive the system. A stack, the angle of about 90 and a diameter of 2.35 inch and gradually
heart of the TAR which is a porous medium is placed inside increasing up to 2.85 inch. The total length of this buffer
the resonator to increase the gas solid interaction and volume is 15 cm.
58 | F a s c i c u l e 1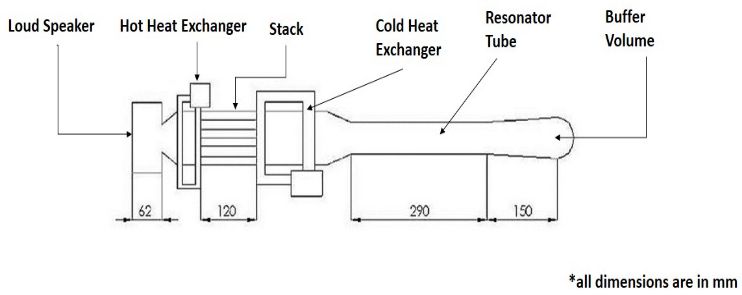
ACTA TECHNICA CORVINIENSIS – Bulletin of Engineering
Tome XIV [2021] | Fascicule 1 [January – March]
Heat Exchanger: Parametric Study of Bengali Phonics:
Two heat exchangers are made of 0.25-inch Copper coil. For the second part for the study, A Phonics has been used
These are placed in both sides of the stack. as input signal. This phonics was recorded and edited using
Audio Recorder. Effect of different level of amplitude and
pitch of the phonics on thermal gradient has been studied.
Spectrum Analysis of the Phonics Used has been analyzed to
generate spectrum graph. It depicts the graph of frequencies
(the horizontal scale in Hz) against amplitudes (the vertical
scale in dB). Plots are made using a mathematical algorithm
known as a Fast Fourier Transform or FFT. This gives a value
for each narrow band of frequencies that represents how
(a) (b) much of those frequencies is present. All the values are then
interpolated to create the graph. The spectrum analysis of
this phonics is shown in Figure 4.
(c) (d)
(e) (f)
Figure 4. Spectrum analysis of Phonics
RESULT & DISCUSSION
Amplitude Testing of Pure waves
For the first part of the study different modification have
been made for a 750 Hz sound wave. Different frequencies of
different wave form (Sinusoidal, Square & Triangular) have
(g)
been studied. Figure 5 depicts the effect of amplitude change
Figure 3. Different components of TAR; (a) Speaker, (b) Speaker
Housing, (c) Stack, (d) Heat Exchanger, (e) Resonator Tube, (f) on temperature change for 750 Hz in different wave form.
Buffer Volume, (g) Assembled view 7.5
RESEARCH METHODOLOGY
Experiments have been performed by changing different 7
parameters for Thermo acoustics. Different properties that
Temp.Diff.(ºc)
characterize the sound wave are changed and its effects have Sine Wave
been tested in the experiments. Two similar experiments 6.5 Triangular
Wave
have been performed in the study (a) Amplitude test of pure Square Wave
waves (b) Parametric study of phonics. 6
These experimental conditions were selected arbitrarily and
kept constant throughout the study. Gas used in this study
5.5
is Nitrogen as it was readily available in the laboratory and 0.1 0.4 0.5 1
it is inert in nature and kept in atmospheric pressure inside Amplitude (dB)
the resonator tube. A CIE 305 Thermometer was used to Figure 5. Effect of Amplitude change
measure the temperature at the inlet and outlet of the cold on Temperature Difference
heat exchanger.
From the graph, it is evident that Temperature difference is
Amplitude Test of Pure Waves:
highest 7°c when operating at an amplitude of 0.5 dB for
Effect of amplitude change of different wave form like
sinusoidal waveform. A steady temperature difference of
Sinusoidal, Triangular and Square on temperature gradient
6.2°C while the system was tested with triangular wave. For
have been studied. For the completion of this study a
square wave form the highest temperature gradient obtained
reference frequency of 750 Hz has been modified to generate
is 6.7°c at 0.1 dB level. Use of sinusoidal waves at high level of
different wave form using Audio Recorder.
amplitude results in enhanced performance of TAR.
59 | F a s c i c u l e 1ACTA TECHNICA CORVINIENSIS – Bulletin of Engineering
Tome XIV [2021] | Fascicule 1 [January – March]
Parametric Test of Phonics: Amplitude Test of increased pitch can result in better performance for the
Phonics thermo-acoustic performance. The use of Phonics instead of
The recorded phonics was modified at different levels from pure waves can be an alternative approach in thermo
7dB to 30 dB and tested. Figure 6 depicts the effect of acoustic phenomenon. It may be a scope of using a recorded
amplitude change on temperature change for Bengali phonics instead of pure wave that has been used in TAR
Phonics. system. This study shows that thermal gradient can be
achieved not only with the use of pure waves but also a
7
customize phonics.
6
References
5 [1] Bhansali, P. S, Patunkar, P. P, Gorade, S. V, Adhav, S. S, Botre,
S. S. “An Overview of Stack Design for Thermoacoustic
Temp.Diff. (ºc)
4
Refrigerator.” International Journal of Research in
3 Engineering and Technology, 4(6), 68Y72, 2015.
2 [2] Putnam, A. A., Dennis, W. R. “Survey of Organ‐Pipe
Oscillations in Combustion Systems.” The Journal of the
1
Acoustical Society of America, 28(2), 246-259, 1956.
0
7 10 15 20 25 30
[3] Swift, G. W. “Thermoacoustic engines.” the Journal of the
Amplitude (dB) Acoustical Society of America, 84(4), 1145-1180, 1988.
[4] Swift, G. W. “Thermoacoustic engines and
Figure 6. Effect of Amplitude change refrigerators.” Physics today, 48(7), 1995.
on Temperature Difference [5] Garrett, S. L., Adeff, J. A., Hofler, T. J. “Thermoacoustic
refrigerator for space applications.” Journal of thermophysics
The graph depicts that maximum temperature difference and heat transfer, 7(4), 595-599, 1993.
obtained is 5.8°c at 15 dB. Although the performance is not [6] Tijani, M. E. H., Zeegers, J. C. H., De Waele, A.T.A.M.
satisfactory but the lower thermal difference obtained in this “Construction and performance of a thermoacoustic
process suggests that instead of pure waves the use of refrigerator.” Cryogenics, 42(1), 59-66.2002.
Phonics can be an alternative approach to achieve thermal [7] Wetzel, M., Herman, C. “Design optimization of thermo-
gradient in thermo acoustic study. acoustic refrigerators.” International journal of
Pitch Test of Phonics: refrigeration, 20(1), 3-21, 1997.
[8] Akhavanbazaz, M., Siddiqui, M. K., Bhat, R. B. “The impact of
The unedited Phonics is changed with the use of software.
gas blockage on the performance of a thermoacoustic
The change in pitch of a particular sound can be in refrigerator.” Experimental thermal and fluid science, 32(1),
percentage of the pitch of the unaltered sound. If the pitch is 231-239, 2007.
decreased the sound becomes deepened. Similarly increasing [9] Patwari, A. U., Habib, M. A., Islam, M. S., Hasan, M. S. U.
the pitch sharpens the sound. Figure 7 shows the effect of “Development of Thermo Acoustic Device for Cooling Effect
temperature change in percentage of the Phonics. It is in Machining Process.” International Conference on
evident that for increasing in the pitch increases the Mechanical, Industrial and Materials Engineering 2017
temperature difference. Maximum temperature difference of (ICMIME2017) 28-30 December, 2017, RUET, Rajshahi,
6.2 °c at +25% pitch change whereas lowest temperature Bangladesh.
gradient is obtained at -25% pitch change. Temperature
change increases with the increase of pitch.
6.4
6.2
6
Temp.Diff. (ºc)
5.8
5.6
5.4
5.2
5
-25% -15% 0% 15% 25%
Change of Pitch in pe rce ntage
Figure 7. Effect of Pitch change
on Temperature Difference ISSN: 2067-3809
CONCLUSION copyright © University POLITEHNICA Timisoara,
Selection of appropriate wave is crucial for the performance Faculty of Engineering Hunedoara,
of the optimum performance of a TAR. It has found that 5, Revolutiei, 331128, Hunedoara, ROMANIA
sinusoidal waves with relatively higher amplitude and http://acta.fih.upt.ro
60 | F a s c i c u l e 1You can also read