RESULTS OF THE KRUSTY WARM CRITICAL EXPERIMENTS
←
→
Page content transcription
If your browser does not render page correctly, please read the page content below
Nuclear and Emerging Technologies for Space, American Nuclear Society Topical Meeting
 Richland, WA, February 25 – February 28, 2019, available online at http://anstd.ans.org/

                                RESULTS OF THE KRUSTY WARM CRITICAL EXPERIMENTS

                                                David I. Poston, Rene Sanchez, Patrick McClure

                     Los Alamos National Laboratory, Los Alamos, NM 87545, 505-667-4336, poston@lanl.gov

     The Kilowatt Reactor Using Stirling TechnologY                                  the COMET lift table, which is operated by the Nuclear
(KRUSTY) was a prototypic nuclear-powered test of a 5-                               Criticality Experiments Research Center (NCERC). The
kWt Kilopower space reactor. This paper presents results                             nuclear testing campaign at NCERC lasted from November
from the KRUSTY critical experiments, which were                                     2017 to March 2018. A companion paper in these
completed prior to the final system test. The first set of                           proceedings documents the full nuclear system test5.
criticals were “cold” or zero-power criticals; i.e. the core
was not heated by fission power. These were followed by
three “warm” criticals, where fission power heated the
core to 200, 300 and 450 C respectively. These criticals
provided the data and confidence required to proceed with
the KRUSTY nuclear system test. The criticals also
provided valuable data for the benchmarking of codes
applicable to all nuclear systems. Overall, the results of the
KRUSTY criticals, cold and warm, matched extremely well
with the pre-test predictions

I. INTRODUCTION
     The Kilowatt Reactor Using Stirling TechnologY
(KRUSTY) was designed to be representative of a 5-kWt
Kilopower1,2 space reactor. KRUSTY was designed,
developed, manufactured, and tested for
each incremental reactivity
change (e.g. adding or
subtracting BeO) within a
few cents.
Several criticals were
performed to determine the
worth of an internal B4C rod,
which is the proposed
reactivity control for a flight
system. Boron carbide
“pucks” (~95% enriched in
10
B) were incrementally
stacked onto a mock “control
rod” assembly, which was
manually inserted into the
core though a penetration in
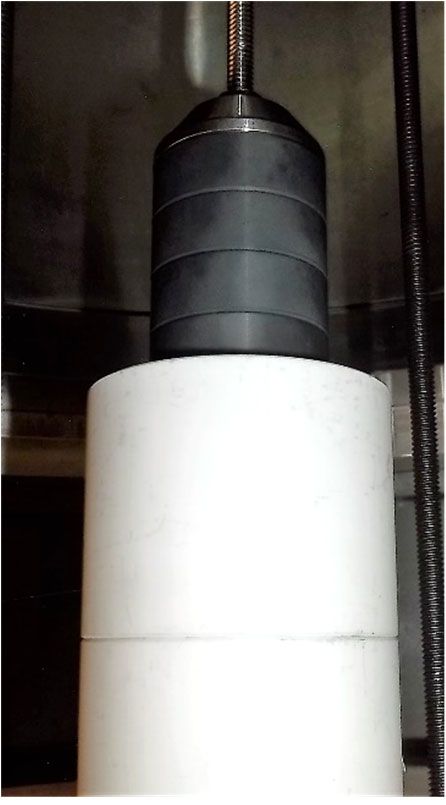
the lower vacuum vessel. Fig 4. B4C (dark grey) pucks
Figure 4 shows four 1.27-cm stacked on top of BeO
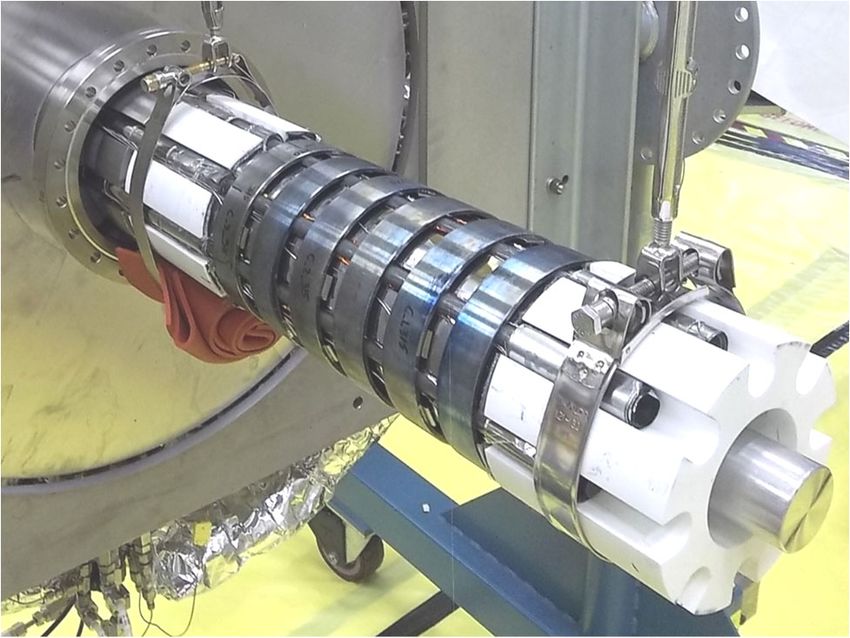
Fig 3. The lower shielding and radial reflector being installed enriched B4C pucks stacked (white) axial reflector pieces.
on the COMET platen, which consists of stacked 1”-thick rings
on top of the lower axial
of SS-304 (shiny), B4C (dark grey), and BeO (white). Yellow
tape holds thermocouple wires.
reflector plugs. Above the B4C stack is the SS316 conical,
thin-walled washer and the centering rod. The reactivity
worth of the B4C ranged from ~3 cents/mm near the bottom
III. ZERO-POWER CRITICALS of the core to ~6 cents/mm near the axial center of the core.
There were two distinct sets of zero-power “cold” These results also agreed very well with the MCNP model.
criticals. The “component” criticals and the “KRUSTY”
criticals. The component criticals removed the heat pipes, IV. 15-CENT WARM CRITICAL
core clamps, insulation, and vacuum vessel to provide The nuclear-heated or “warm” criticals began in the
cleaner data for criticality benchmarking. KRUSTY was same manner as the cold criticals, but the power is allowed
not specifically designed to be a highly precise to increase unabated until sensible power heats the fuel and
benchmarking experiment; i.e. there was enough provides reactivity feedback. The controls are then left
uncertainty in fuel and reflector position to potentially untouched to monitor the temperature and power as the
cause 10-20 cents of uncertainty in integral k-eff. However, passive transient proceeds.
the relative perturbations in reactivity are likely accurate to
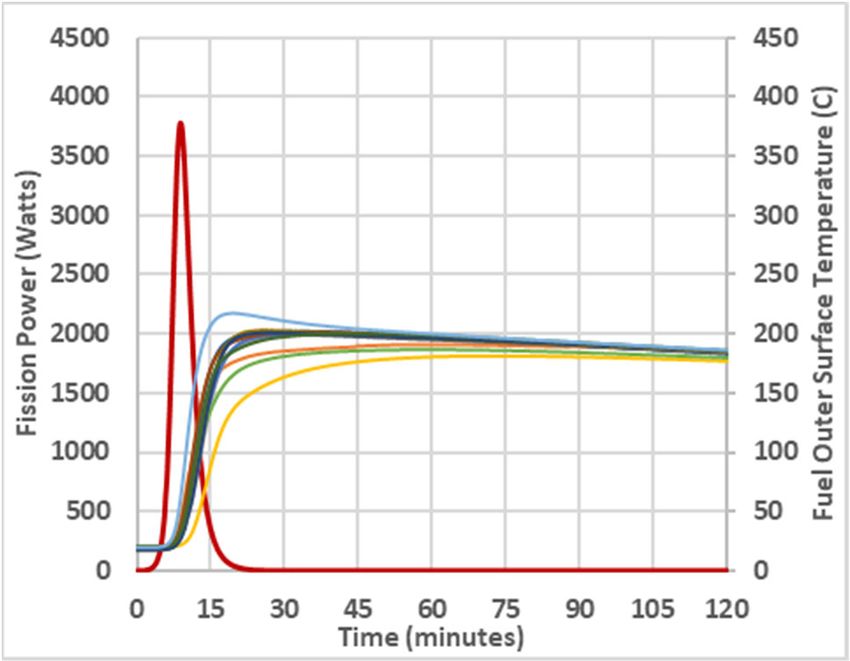
a few cents. The second set of zero-power criticals The fission power and fuel thermocouple (TC)
evaluated the fully assembled KRUSTY configuration, temperature readings from the 15-cent run are shown in
which was used for the full system test. The primary goal Fig. 4.
of these criticals was to get an accurate correlation of
system reactivity versus BeO stack height and platen
position.
A total of 91 criticality measurements were taken. In
each case, the platen was raised to make the reactor slightly
supercritical (keff >1) and the rate of power increase was
measured to provide a relatively accurate calculation of the
reactivity (within a cent or two). Soon after these
measurements were recorded, they were compared to
predictions from the neutronics code MCNP6. The MCNP
model was tweaked (by adjusting gap tolerances, densities,
unspecified impurities) to best represent the entire suite of
criticality results. The updated model was then used to
determine what thickness of BeO radial reflector to load
onto Comet for the warm criticals and the final reactor test.
Note that the initial, unadjusted MCNP model predicted the
first critical very well (within 30 cents) using ENDF/B7.1 Fig. 4. Power and temperature data from 15-cent run.
data. Apart from the integral k-eff, the model predicted
2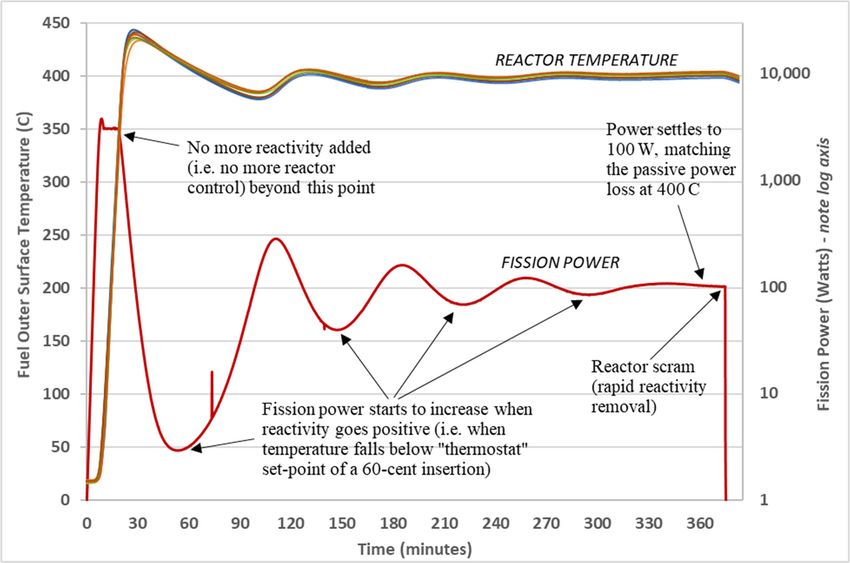
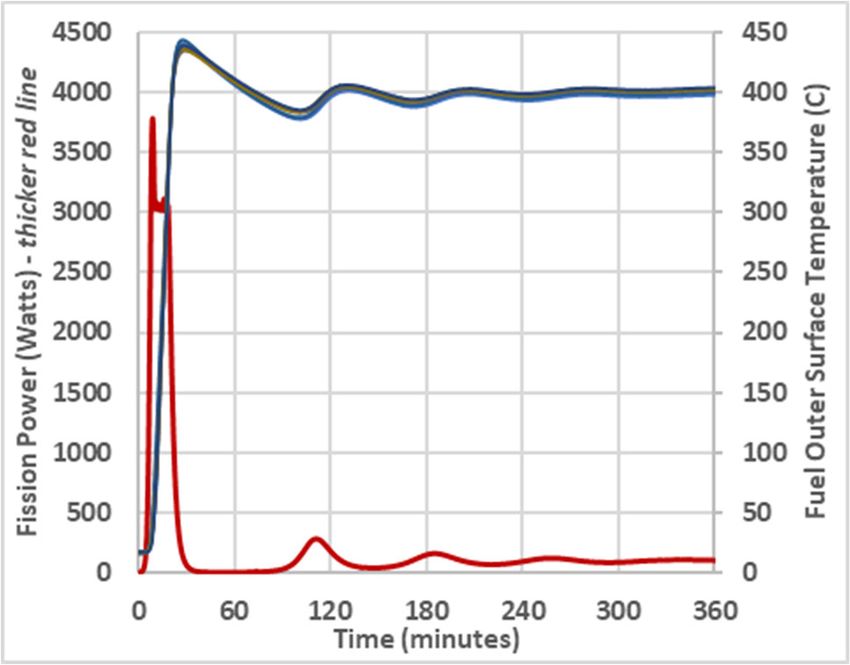
The fission power that is plotted in Fig. 4, and all Figure 5 plots the 15 cent run on a longer time scale.
graphs in this report, is actually the normalized neutron After an hour or so, all the TCs reach an equilibrium value,
detector reading. The neutron detector is a He-3 detector, because radiation heat transfer across the poorly bonded
for which the readout is Amps. The flux at the neutron gaps has brought the temperatures together. It was
detector location is almost directly proportional to the important to run this and the other warm criticals long
flux/fission in the core. Movement of the platen, which enough to monitor long-term temperature drop (indicating
effects neutron leakage from core, might have a significant passive power loss). This provided data to benchmark the
impact, but the platen does not move during this transient modeling tools in conjunction with the final system test.
(i.e. after the 15 cents is inserted). Changes in system
temperature will also have a minor effect on leakage, but V. 30-CENT WARM CRITICAL
nothing significant. Given that the red curve represents Next, the 30-cent critical was performed. The initial
fission rate, the integral of that curve can then be reactivity insertion was again ~15 cents, but after the power
normalized to the number of Joules needed to heat the fuel peaked and began to drop, the operator incremented
to the measured temperature (based on the fuel specific reactivity (lifted the platen) until a total of 30 cents had
heat and MeV/fission). Second order effects such as heat been inserted. It was decided to start every nuclear-
leakage from the core and the time dependent nature of powered test with a 15-cent free run, to ensure that the
decay power affect this normalization, but the initial guess configuration had not changed since the last test, and that
based on adiabatic heat up and “constant” decay power was nothing else might be going wrong. Reactivity was inserted
very close based on subsequent benchmarking efforts. at a rate to keep the power at ~3 kWt – actually the neutron
The peak power reached during the 15-cent free run detector Amps that corresponded to 3 kWt. This transient
was ~3.8 kWt. This was within the expected range, but a is plotted in Fig 6.
bit higher than the predicted value of 3.4 kWt. This is
apparently because the actual insertion was 15.7 cents, as
indicated by the measured reactor period (ramp rate),
which would explain this difference.
The core temperature rise for the 15-cent run was also
well within the predicted range; however, the TC readings
were not in sync. It appears that some TCs had better
thermal bonding than others, and that only one TC was well
bonded (the blue line on Fig.2), which reached ~220 C. As
the subsequent tests went to high temperatures, the
thermal-bonding appeared to get much better; which is to
be expected, since the TCs are spring-loaded against the
fuel (not physically attached). It was decided not to weld
or braze the TCs directly to the fuel to avoid potential fuel
damage, but unfortunately this caused significant lag in
most of the core temperature TCs.
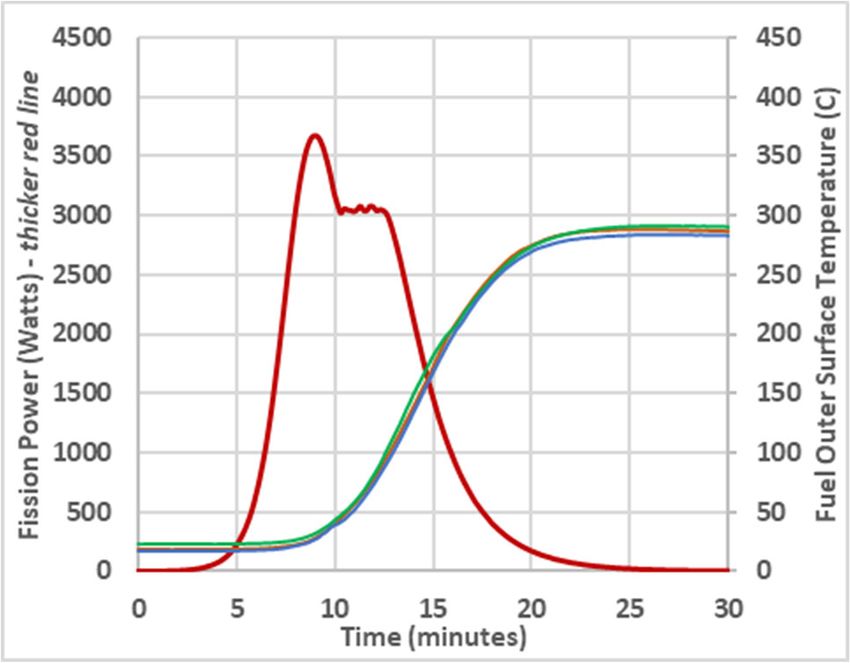
Fig. 6. Power and temperature data from 30-cent run.
The power in Fig. 6 rises to a peak similar to the 15-
cent free run, but it is slightly lower because the actual
insertion is indicated to be 15.5 cents as opposed to 15.7
cents. The point at which the operator inserts additional
reactivity to keep power constant can be clearly seen,
starting at 10 min. and ending at ~12.5 min. At that time
the platen was at a position predicted to have inserted 30
cents (note: post-test modeling indicates an actual insertion
of 29.9 cents, so the prediction was very good).
In the 30-cent run, the TC readings are much more
uniform than the 15-cent run, but there is still clearly a lag
in TC response time; i.e. the fuel should start heating
significantly when the power becomes >1 kWt (at 7 min).
It is possible that the time stamps of the two data sets
Fig. 5. Power and temperature data from 15-cent run. (power and temperature) were not properly overlaid, but
this lag was noticed in real time during each of the tests.
3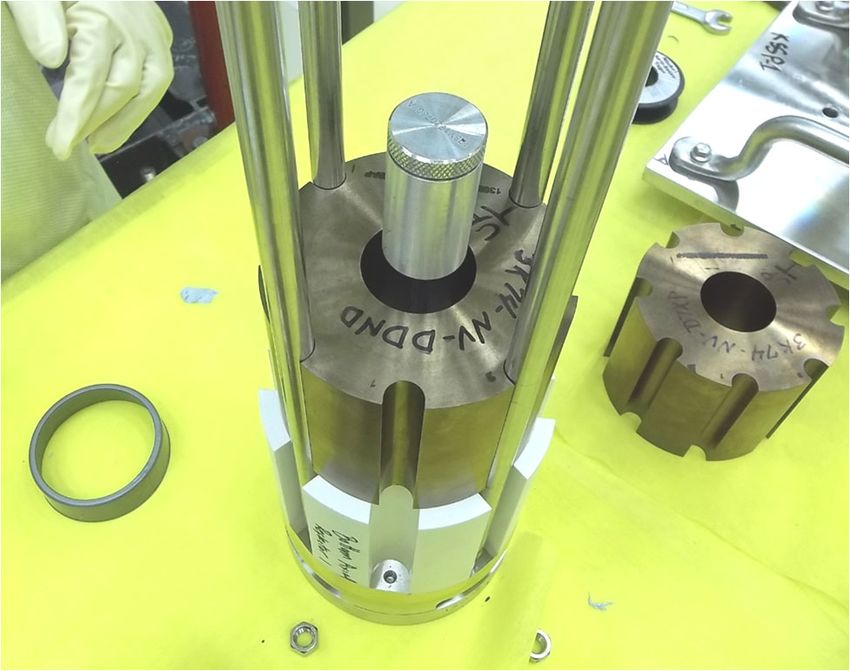
During the test, the TC lag created unease in the control                The power and fuel temperatures from the 60-cent run
room because the neutron detectors indicated high power             are shown in Fig. 8.
but the core was not heating up. Fortunately, due to the
simple nature of the system, it was decided to continue
because there was no possibility for the core to overheat.
    Figure 7 plots the 30-cent run on a longer time scale.

                                                                    Fig. 8. Power and temperature data from 60-cent run.
                                                                         The power in Fig. 8 once again rose to a peak similar
                                                                    to the other warm criticals, corresponding to a 15.5 cent
                                                                    insertion. As with the 30-cent run, the operator began to
Fig. 7. Power and temperature data from 30-cent run.                insert additional reactivity at 10 min. to keep power at
     The long-term temperature drop in Fig. 7 indicates the         ~3kWt. In this case reactivity was inserted to a predicted
heat loss from the fuel is ~30 W, which is very useful data         value of 60 cents, which occurs at 18 min. on Fig. 8 (note:
to benchmark the heat transfer mechanisms from the fuel,            post-test modeling indicates an actual insertion of 58.5
in particular the effectiveness of the multi-layer insulation       cents – not as well predicted as the 30-cent run, but not
(mli). If this case was allowed to run for 10s of hours, the        surprising because there wasn’t as much zero-power
fuel would have eventually cooled enough to produce                 criticals data to help predict this magnitude of insertion).
positive reactivity. Then the power would have risen to                  The key value on Fig. 8 is the peak TC reading. The
ultimately match the heat loss and the core would have              peak recorded temperature was 446 C, only 1 degree from
coasted at ~200 C. Instead, this passive behavior was               the safety basis prediction, so clearly within 10%. In the
demonstrated in the 60 cent run.                                    best scenario, this prediction might have been +/-2% (or 9
                                                                    C), so nailing it within 1 C was sheer luck. Regardless, it
V. 60-CENT WARM CRITICAL                                            checked the box for proceeding with the full system test.
     The final warm critical was conducted in the same                   Figure 9 plots the 60-cent run on a much longer time
fashion as the 30-cent run, except that the operator                scale, in this case 6-hours to let the transient fully evolve.
continued to insert reactivity until 60 cents was inserted.
This test was crucial to the success of the KRUSTY
campaign. First, it would confirm the passive dynamic
response predicted for the system. Second, it provided the
authorization basis to proceed with the full system test. The
latter was a novel approach to providing the safety basis for
a nuclear test. The ability to adequately model the dynamic
performance of KRUSTY existed only within the design
team (using the code FRINK7). Safety reviewers could rely
on simplified nuclear calculations (due to the neutronic
simplicity of KRUSTY) but an independent transient
system model would have taken substantial time and effort.
Thus, it was proposed that the design team would predict
the peak TC reading for the 60-cent run, and if the result
was within 10% then the final test could proceed, otherwise
KRUSTY would not be given authorization for the final
full-system test. An official predicted value of 447 C (720
K) was submitted the day before the test.                           Fig. 9. Power and temperature data from 60-cent run.

                                                                4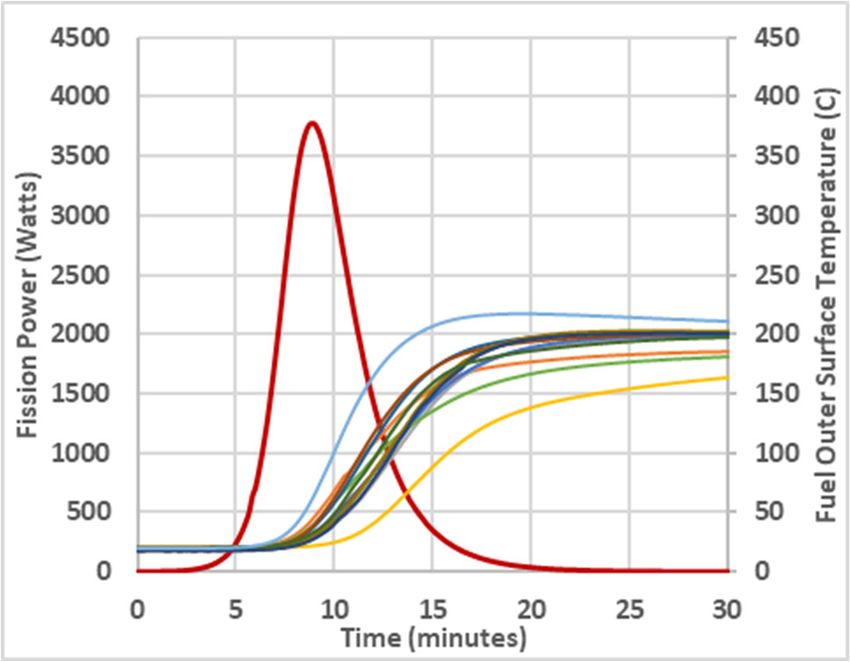
Fig. 10. Power and temperature data from the 60-cent run.

     The results in Figure 9 provided the first validation          a compact, fast-spectrum reactor, then even at much higher
that KRUSTY, and all similar Kilopower reactors, would              powers the same passive, load-following response might
provide stable operation and provide a power level equal to         remain – even with a different power conversion system or
the power drawn from the core. Figure 10 replots the data           even gas-cooling of the reactor.
in Fig.9 with the power on a log scale (and in larger
format), to better show this dynamic. The passive response          REFERENCES
of the reactor is the same as a household thermostat – if the       1.   D. I. POSTON, et. al. “A Simple, Low Power Fission
temperature gets too cold the power/heat kicks on and vice-              Reactor…” NETS-2013, ANS (2013).
versa. In a reactor, the temperature “set-point” is
determined by the level of reactivity insertion and the             2.   M. A. GIBSON, et. al., "Development of NASA’s
passive temperature feedback of the reactor.                             Small Fission Power System…” 12th IECEC, AIAA
                                                                         2014-3458 (2014).
V. CONCLUSIONS                                                      3.   M. A. GIBSON, et. al., "NASA’s Kilopower Reactor
     The KRUSTY criticals were successful, and the                       Development …" NASA/TM—2017-219467 (2017).
passive, self-regulating dynamics of the KRUSTY reactor             4.   D. I. POSTON, et. al., “Design of the KRUSTY
were demonstrated. More-so, both the static and kinetic                  Reactor” NETS-2018, ANS (2018).
results were remarkably close to the pre-test modeling,
which underscores that this kind of reactor can be designed         5.   D. I. POSTON, et. al., “Results of the KRUSTY
without significant uncertainty in how it will actually                  Nuclear System Test” NETS-2019, ANS (2019).
operate. This is extremely important for Kilopower                  6.   C. J. WERNER, “MCNP Users Manual…” LA-UR-
systems with powers >>5 kWt, which will generally                        17-29981 (2017).
preclude the opportunity for inexpensive testing like was
done for KRUSTY. The key of the Kilopower program, is               7.   D. I. POSTON, et. al. “FRINK—A Code to Evaluate
that all reactor designs will have the same basic physics and            Space Reactor Transients,” AIP Proc., 880, 449(2007).
heat transfer as KRUSTY, and thus they should all operate
in the same manner. If the physics can be kept simple, i.e.

                                                                5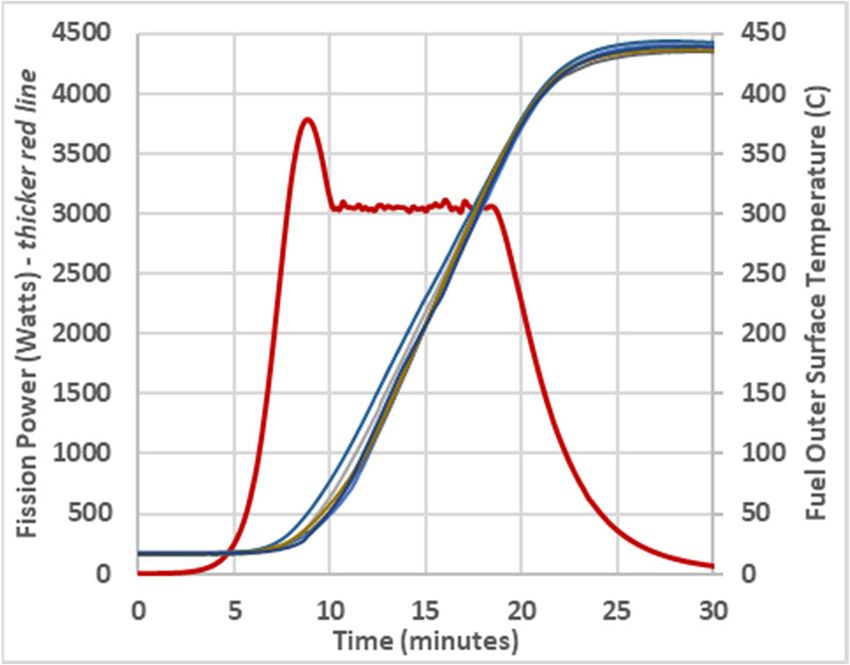
You can also read