Field Experiments and Predicting using C-LSTM Networks of Bridge Position Estimation
←
→
Page content transcription
If your browser does not render page correctly, please read the page content below
Proceedings of the World Congress on Engineering 2021
WCE 2021, July 7-9, 2021, London, U.K.

                   Field Experiments and Predicting using
                   C-LSTM Networks of Bridge Position
                                Estimation
                                           Shin Ryota, Yamamoto Kyosuke, Okada Yukihiko

                                                                             identify the bridge's location from the vehicle vibration data.
     Abstract— In this study, a bridge position determination                In most of the previous studies, only the data on the bridge
  technique was validated using real-world data. The results can             was analyzed. Therefore, the technology to extract only the
  visually judge the location of some bridges. We also performed             bridge part from the vehicle acceleration data is one of the
  supervised binary classification for bridge location estimation
  using C-LSTM. Although the accuracy is not high, it is possible
                                                                             technical challenges for the social implementation of vehicle
  to estimate the approximate location of the bridge.                        response analysis.
                                                                                              !    Bridge Screening
                                                                                                   based on
                                                                                                                                Detailed
    Index Terms—on-going monitoring, VBI system, CNN,                                                                           Inspection
  LSTM                                                                                             vehicle responses

                                                                               Sensors
                           I.   INTRODUCTION                                   on Vehicle             Intact           Intact    Damage

  B    ridges play an essential role in the transportation system.
       However, it is not efficient to perform maintenance and
  inspection of a large number of bridges uniformly. Therefore,
                                                                             Fig. 1 Conceptual Diagram of Bridge Screening

                                                                                Murai et al. [5] have verified the bridge position estimation
  we decided to prioritize the inspection of bridges with a high             from vehicle vibration data by numerical simulation.
  possibility of damage after conducting a simple screening in               Acceleration sensors are installed in the unsprung masses of
  advance. To achieve this, the condition of the bridges needs               the front and rear axles. The paper shows that the bridge can
  to be easily and quickly understood.                                       be detected by synchronizing and subtracting two-vehicle
     As a way to do this, vibration-based monitoring methods                 vibration data in the spatial domain using GPS data. This is
  are being considered. They fall into two categories. The first             based on the vehicle-bridge interaction (VBI) when a vehicle
  is "direct bridge monitoring technology," in which sensors                 travels over a bridge. The effect of noise has also been
  are installed on the bridge. Although this method can monitor              studied. As noise increases, the difference between the
  the bridge's condition with high accuracy, it is                           acceleration data obtained on the bridge and the acceleration
  time-consuming and costly because it requires the installation             data obtained on the road becomes smaller. It is pointed out
  of multiple sensors on a single bridge. Besides, even if we                that it is impossible or difficult to determine the bridge's
  build a system to monitor a bridge's condition from the                    response from the measured data because the data obtained
  acceleration data obtained, it is not easy to apply it to other            from field experiments contain various noises. Therefore, the
  bridges. The second approach is an indirect bridge                         selection of vibration waveforms requires personnel and
  monitoring technique, in which sensors are installed only on               incurs new costs, which is not desirable.
  vehicles. Yang et al. [1] proposed a vehicle response analysis                In recent years, deep learning has been widely used in
  to estimate a bridge's vibration from the vibration obtained               image recognition and signal processing [6]. There are two
  when a vehicle equipped with an accelerometer runs over the                main types of deep learning methods: convolutional neural
  bridge. Recent studies on vehicle response analysis include                networks (CNN) used for image recognition and recurrent
  estimation of natural frequencies of bridges [2], damage                   neural networks (RNN) mainly used for natural language
  detection [3, 4], and position estimation [5].                             processing and speech recognition. CNN can learn local
     However, there are challenges in socially implementing a                responses from spatial and temporal data, but they cannot
  bridge monitoring system using vehicle response analysis.                  learn sequential correlations. On the other hand, RNNs are
  One of the challenges in socially implementing a bridge                    characterized by sequential modeling, but they are not
  monitoring system using vehicle response analysis is to                    suitable for parallel processing [7]. To deal with gradient
                                                                             explosion and disappearance that occurs in general RNNs, we
                                                                             introduce the Long Short-Term Memory (LSTM) unit. This
     Manuscript received March 23, 2020; revised April 24, 2021. This work
  was partly supported by JSPS KAKENHI Grant Number 19H02220
                                                                             enables analysis, including past information [8]. Zhou et al.
  (Grant-in-Aid for Scientific Research(B)).                                 [9] proposed C-LSTM, which combines CNN and LSTM to
     Shin Ryota is a master student of University of Tsukuba, Ibaraki        learn temporal and spatial features. Various researches have
  prefecture, Japan (e-mail: s1920556@s.tsukuba.ac.jp).
     Yamamoto Kyosuke is an assistant professor of University of Tsukuba,
                                                                             been conducted using this model, such as prediction [8] and
  Ibaraki, Japan (e-mail: yamamoto_k@kz.tsukuba.ac.jp).                      anomaly detection [6] in data with temporal and spatial
     Okada Yukihiko is an associate professor of University of Tsukuba,      features. Acceleration data of a vehicle passing over a bridge
  Ibaraki, Japan (e-mail: okayu@sk.tsukuba.ac.jp).

ISBN: 978-988-14049-2-3                                                                                                                WCE 2021
ISSN: 2078-0958 (Print); ISSN: 2078-0966 (Online)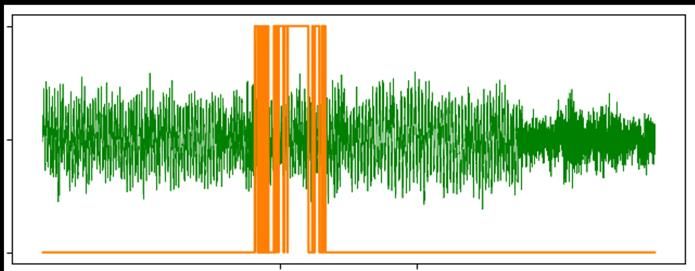
Proceedings of the World Congress on Engineering 2021
WCE 2021, July 7-9, 2021, London, U.K.

  is time-series data containing temporal and spatial features.      vehicle vibration is also excited by road surface unevenness.
  Therefore, we thought that by using C-LSTM, we could               Only the bridge response is obtained when the vehicle
  create a model that can distinguish only the part of the vehicle   vibration data is taken, and the bridge position is
  running on the bridge from the vehicle's acceleration data.        discriminated by using it in Murai et al. [5]. Fig. 3 shows a
     Therefore, we decided to focus on two things: first, to         conceptual diagram of VBI occurring when a vehicle is
  validate the bridge location estimation technique in field         traveling on a bridge, and Fig. 4 shows a conceptual diagram
  experiments. Murai et al. [5] have validated bridge position       of VBI occurring when a vehicle is passing on a road.
  estimation with numerical simulations, but not with field
  experiments. The second is developing a technique to extract
  only the part of the vehicle running on the bridge from the
  vehicle acceleration data using C-LSTM. If these are realized,
  it is expected that the social implementation of bridge
  monitoring technology using vehicle response analysis will
  become more realistic.

                   II. METHOD/BASIC THEORY                           Fig. 3 Conceptual Image of VBI on the bridge

    A. C-LSTM neural networks
     The combination of CNN and LSTM has been studied to
  obtain spatial and temporal features [9]. The schematic
  diagram of C-LSTM is shown in Figure 2. This study's
  C-LSTM model is based on Kim and Cho [6] and Kim and
  Cho [8] and consists of Convolution, Activation, Pooling,
  LSTM, and Dense. Kernel size, stride size, and activation          Fig. 4 Conceptual Image on the road
  function were adjusted to minimize the loss function's value
                                                                                                 Table 2
  calculated from the learning data. The resulting model is
                                                                                           EXTRACTED FEATURES
  presented in Table 1. CNN has two layers: a Convolution
  layer and a Pooling layer. The LSTM has 64 units, and the
  Dense layer has 32 units selected.

  Fig. 2 Conceptual Image of C-LSTM

                            Table 1
                   THE C-LSTM ARCHITECTURE
          Type                Kernel size   Stride     Param.
      Convolusion                2×1          1          192
    Activation(relu)              -            -          0
         Pooling                 2×1          2           0
      Convolusion                2×1          1         8,256
    Activation(relu)              -            -          0
         Pooling                 2×1          2           0
       LSTM(64)                   -            -       180,480
    Activation(relu)              -            -          0
       Dence(32)                  -            -        2,080
        Dence(1)                  -            -         33
   Activation(softmax)            -            -          0

    B. Signal processing for vehicle vibration
    VBI is the contact force and the bridge vibrations under the
  vehicle axes. When a vehicle enters a bridge, the vehicle
  shakes the bridge, and the bridge shakes the vehicle. The

ISBN: 978-988-14049-2-3                                                                                                  WCE 2021
ISSN: 2078-0958 (Print); ISSN: 2078-0966 (Online)
Proceedings of the World Congress on Engineering 2021
WCE 2021, July 7-9, 2021, London, U.K.

     In this study, accelerometers were installed unsprung-mass
  of the front and rear wheels of the vehicle. This is because the
  vibration component of the high frequency of road surface
  and bridge can be measured directly. The obtained
  acceleration data are subjected to position synchronization
  and subtracted in a space region. As a result, the unevenness
  of the road surface included in the measurement data can be
  reduced. The experimental data were then normalized using
  Eq (1) before being input to C-LSTM.

     Then, to reduce the computation time of C-LSTM, the
  feature quantities used by Jiang et al. [10] are calculated. A
  table summarizing the feature values used is shown in Table         Fig. 5 Vibration data of upsprung-mass front and rear wheels measured at a
  2. The respective feature values were calculated for each 1         bridge over the K River
  step with a window size of 1000.

                                                                         ]
                    III. FIELD EXPERIMENTS

                                                                             (Subtract)
    A. Experimental Settings
     Field experiments were conducted on the Tomei                       Acceleration[
  Expressway. Trucks used for essential delivery services in
  Japan were used as test vehicles, and accelerometers were
  installed unsprung-mass of the front and rear wheels for
  measurement. The sampling rate of the accelerometer was
                                                                      Fig. 6 Subtractions of front and rear vibration measured at a bridge over the
  300 Hz. The test truck has two axes at the front and one at the     K River
  rear before the front are treated as one axis. GPS sensors were
  introduced to synchronize the vehicle position with the front          In the numerical simulation conducted by Murai et al. [5],
  and rear wheel positions. In this study, the acceleration data      the bridge response could be observed by taking the
  of nine bridges were measured. The data of passing on each          difference between the front and rear wheels. However, the
  bridge are used. The bridge position in each acceleration data      results of this study are masked by noise and cannot be
  was confirmed by the author and labeled. A label of 1 was           visually identified. The results for other bridges are shown in
  given on the bridge, and 0 was given on the road. The target        Fig. 7-9.
  section of the acceleration data was determined for each
  bridge. The bridge's length and the road before and after the
                                                                         ]

  bridge were twice the lengths of the bridge. The maximum
  speed and minimum speed in the section were about 85.1
                                                                             (Subtract)

  km/h and about 68.8 km/h, and the average speed was about
                                                                         Acceleration[

  77.2 km/h. The total number of data finally obtained is
  162,695, and it consists of 9 different files. The bridge part is
  45,627 of them. For each file, 16 feature values were
  calculated with a window size of 1000, and the number of
  analysis data was 39,343,600.
    B. The results and discussions of field experiments               Fig. 7 Subtractions of front and rear vibration measured at a bridge over the
                                                                      O River
     Unlike numerical experiments, the spacing of data points
  in the spatial domain is different because the vehicle speed is
                                                                        ]

  not constant [2]. Therefore, the acceleration data measured
  unsprung-mass of the front wheels and the rear wheels are
                                                                            (Subtract)
                                                                        Acceleration[

  interpolated simultaneously. Then, the mutual correlation of
  the front axis's acceleration and the rear axis was obtained,
  and the difference was obtained at the position where the two
  waveforms matched most [5]. As an example of the
  difference after the position synchronization, acceleration
  data measured under the springs of the front and rear wheels        Fig. 8 Subtractions of front and rear vibration measured at a bridge over the
  near the bridge over the K River and vibration data after the       A River
  position synchronization are shown in Fig. 5-6.

ISBN: 978-988-14049-2-3                                                                                                                 WCE 2021
ISSN: 2078-0958 (Print); ISSN: 2078-0966 (Online)
Proceedings of the World Congress on Engineering 2021
WCE 2021, July 7-9, 2021, London, U.K.
]
]
(Subtract) 1
(Subtract)
Acceleration[
Acceleration[
0.5
0
in out
Fig. 9 Subtractions of front and rear vibration measured at a bridge over the P
River Fig. 11 Subtractions of front and rear vibration measured at a bridge over the
S River and prediction result
In Fig. 7, peaks appeared at both the entry and exit positions.
]
Compared with the results obtained in Fig. 6, it can be seen
1
that the peak amplitude at the position of entry or exit to the
(Subtract)
bridge is approximately the same. In Fig. 8, a peak can be
Acceleration[
observed only at the time of penetration. Besides, no peak 0.5
was observed in Fig. 9. Finally, two of the nine bridges
peaked at in and out, and two bridges peaked at either in or
out. Although bridges could not observe peaks at many 0
bridges, the bridge response was theoretically included in the in out
difference data. Therefore, it can be assumed that the bridge Fig. 12 Subtractions of front and rear vibration measured at a bridge over the
response could not be visualized because it was affected by B River and prediction result
other noises. The method of obtaining the difference after the
position synchronization corresponds to the processing for Although it cannot be said that the accuracy is high, it is
removing the road surface unevenness. Therefore, the vehicle possible to specify the bridge position roughly. In this study,
response may be visualized if the noise generated by the the window size was determined to be 1000 regardless of the
influence of temperature, wind, bridge damage, etc. other bridge length. The closer the bridge is to the center, the more
than the road surface irregularity can be removed. it swings. Therefore, the structure learned by C-LSTM may
differ depending on the length of the bridge. In order to
C. The results and discussions of Prediction
improve this, it is necessary to change the window size for
We performed supervised learning of binary classification each bridge. The data used for the analysis is only the data
using C-LSTM. 70% of the analysis data were used as obtained by taking the difference between the front axis and
learning data and 30% as verification data. The epoch size is the rear axis under the spring in one trial. A study conducted
500, and the batch size is 512. Mean Squared Error was used by Locke et al. [4], which examined the relationship between
as the loss function, and accuracy was used as the evaluation various noises and bridge damage detection using CNN,
value. The training data loss after learning was 0.1998, and combined various data such as vehicle weight, vehicle speed,
the correct answer rate was 71.7%. On the other hand, the test and time of day. Malekjafarian et al. [11] used 100 measured
data showed a loss of 0.216, and the correct answer was data to develop bridge damage detection technology using
70.86%. Each bridge was fitted using the learned model. neural networks. These studies may help improve prediction
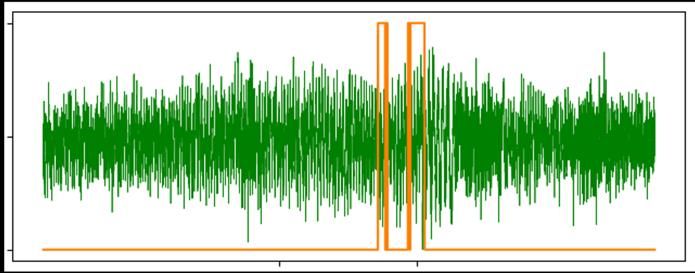
When the predicted value obtained exceeds the threshold accuracy.
value 0.5, 3 of the obtained predicted values giving 1 are
shown in Fig. 10. The acceleration data is normalized by Eq IV. CONCLUSION
(1). Further, it is determined that the predicted value
In this study, the verification of the bridge position
exceeding the threshold σ from Eq (2) exists on the bridge.
estimation technique verified in the simulation was carried
0.5 was set in this study.
out in the field experiment. In this study, we focused only on
eliminating the effects of road surface irregularities so that
noise reduction from temperature, wind, bridge damage, Etc.,
remains as a research subject. We also performed supervised
binary classification for bridge location estimation using
]
1 C-LSTM. The analytical results showed that it was possible
to roughly specify the bridge position, though the accuracy
(Subtract)
was not high. However, since the window size is constant, the
Acceleration[
0.5 structure learned by C-LSTM may differ depending on the
length of the bridge. There are also still issues with the
quantity and quality of learning data.
0
in out
Fig. 10 Subtractions of front and rear vibration measured at a bridge over the
F River and prediction result
ISBN: 978-988-14049-2-3 WCE 2021
ISSN: 2078-0958 (Print); ISSN: 2078-0966 (Online)Proceedings of the World Congress on Engineering 2021
WCE 2021, July 7-9, 2021, London, U.K.
REFERENCES
[1] Yang, Y.B., Lin, C.W., and Yau, J.D., “Extracting bridge frequency
from the dynamic response of a passing vehicle”, Journal of Sound
and Vibration, vol.272, pp.471-493, 2004.
[2] H. Wang, T. Nagayama, J. Nakasuka, B. Zhao, and D. Su, “Extraction
of bridge fundamental frequency from estimated vehicle excitation
through a particle filter approach”, Journal of Sound and Vibration,
Vol.428, pp.44-58, 2018.
[3] K. Yamamoto, and Y. Takahashi, “Experimental Validation of Bridge
Screening Method based on Vehicle Response Analysis”, Proc. of
World Congress on Engineering 2017, vol.2, pp.928-933, London,
U.K., July 5-7, 2017.
[4] Locke, W., Sybrandt, J., Redmond, L., Safro, I., and Atamturktur, S.,
“Using drive-by health monitoring to detect bridge damage
considering environmental and operational effects”, Journal of Sound
and Vibration, vol.468, 115088, 2020.
[5] Murai, R., Miyamoto, R., Yamamoto, K., and Okada, Y., “Numerical
Experiments of Bridge Position Estimation for On-Going Monitoring”,
Proceedings of the World Congress on Engineering 2019. pp.474-479,
London, U.K., July 3-5, 2019.
[6] Kim, T. Y., and Cho, S. B., “Web traffic anomaly detection using
C-LSTM neural networks”. Expert Systems with Applications, vol.106,
pp.66-76, 2018.
[7] Donahue, J., Anne Hendricks, L., Guadarrama, S., Rohrbach, M.,
Venugopalan, S., Saenko, K., and Darrell, T., “Long-term recurrent
convolutional networks for visual recognition and description”, In
Proceedings of the IEEE conference on computer vision and pattern
recognition, pp. 2625-2634, 2015.
[8] Kim, T. Y., and Cho, S. B., “Predicting the household power
consumption using CNN-LSTM hybrid networks”. In International
Conference on Intelligent Data Engineering and Automated Learning,
pp. 481-490, Springer, Cham, 2018.
[9] Zhou, C., Sun, C., Liu, Z., and Lau, F., “A C-LSTM neural network for
text classification”, arXiv preprint arXiv:1511.08630. 2015.
[10] Jiang, W., Hong, Y., Zhou, B., He, X., and Cheng, C., “A GAN-Based
Anomaly Detection Approach for Imbalanced Industrial Time Series”,
IEEE Access, vol.7, 143608-143619. 2019.
[11] Malekjafarian, A., Golpayegani, F., Moloney, C., and Clarke, S., “A
machine learning approach to bridge-damage detection using
responses measured on a passing vehicle”, Sensors, vol.19(18), 4035,
2018.
ISBN: 978-988-14049-2-3 WCE 2021
ISSN: 2078-0958 (Print); ISSN: 2078-0966 (Online)You can also read