Earthquake Early Warning System Prototype Based on Lot using Backpropagation Algorithm - Portal Garuda
←
→
Page content transcription
If your browser does not render page correctly, please read the page content below
Proceeding of the Electrical Engineering Computer Science and Informatics
Vol. 7, October 2020 ISSN: 2407-439X
Earthquake Early Warning System Prototype Based
on Lot using Backpropagation Algorithm
Adi Pranesthi Budhi Irawan Casi Setianingsih
School of Electrical Engineering School of Electrical Engineering School of Electrical Engineering
Telkom University Telkom University Telkom University
Bandung, Indonesia Bandung, Indonesia Bandung, Indonesia
adipranesthi@student.telkomuniversity.ac.id budhiirawan@telkomuniversity.ac.id setiacasie@telkomuniversity.ac.id
Abstract—Earthquakes are vibrations that occur on the pattern used during training. Backpropagation neural network
earth's surface due to the sudden release of energy from the is used to classify the type of earthquake Sembalun Mount
inside that creates seismic waves. An earthquake is caused by Rinjani, Lombok, using one year of data (1995) by dividing
the movement of the earth's crust (the earth's plate). The the data into two parts: the training data and test data [1].
frequency of a region refers to the type and size of earthquakes
experienced during a period. Along with the development of B. Analysis of Earthquake Speed Acceleration in Sumatra
early earthquake detection system technology provides a Using Artificial Neural Network Backpropagation
solution to minimize earthquake events. This research will Method (Toni, Widianto, 2019)
discuss the system's design to determine the occurrence of
Research has been conducted on soil acceleration analysis
earthquakes through time pattern analysis and Peak Ground
using Artificial Neural Networks (ANN), which aims to
Acceleration value. By using the Radial Basis Function Method,
which later to minimize the loss of life from earthquakes. And
analyze and predict soil densities in Sumatra. This study uses
help the main tools owned by the government. This study aims ground acceleration data recorded through the accelerograph
to determine the occurrence of earthquakes from Peak Ground at three stations in West Sumatra, namely Padang Panjang
Acceleration values and time analysis patterns, which are Geophysical Station (PAPA), Ketaping Meteorological
obtained from the decision of the Backpropagation method with Station (PATA), and Maritim Teluk Bayur (PATU) Station.
an accuracy rate of 88%. This data processor uses the backpropagation method. Data
processing is done with two types of data sharing, namely data
Keywords—earthquake, low power wide area network, sharing with a ratio of 50:50 and a ratio of 80:20. After the
backpropagation, peak ground acceleration training and testing process, it was found that the data sharing
with an 80:20 ratio got better results than the data sharing with
I. INTRODUCTION a 50:50 ratio. Overall, it can be concluded that ANN in the
An earthquake is a natural phenomenon, one of which training process can predict the acceleration of the ground
occurs due to the shifting of the plates on the earth's surface; quite accurately, but in the testing process, the error value
earthquakes are destructive, so that in each event almost obtained is quite large, so ANN is not able to predict the
always gives material and immaterial losses. This is important acceleration of land data correctly. [2].
to be developed, given the previous seismograph tools.
Seismographs have the disadvantage of being too strong if III. SYSTEM METHOD
vibrations make the seismograph unable to take notes because This chapter explains what will be done and provides an
the recorder can be damaged. With this tool, it will not be the overview of the equipment's design to be made. To get
primary tool that the government will use to predict natural earthquake data, sensors that are used consist of GPS sensors
disasters, but it can at least help to read patterns of earthquakes and MPU-6050. The Arduino Pro Mini will then be
through time pattern analysis and official data from BMKG. controlled, and then the data will be sent through the LoRa
The tool will read the pattern of an earthquake based on a network. Other modules as support and laptop as a source:
specific time range and the latitude and longitude of the
location of the vibration, and then the data is processed using
an application that will be submitted with LoRa to the
database so that the data will be directly displayed on the
website.
II. RELATED WORK
A. Application of Artificial Neural Network Back-
propagation to Classify the Type of Earthquake Mount
Rinjani (Ishak, Bulkis Kanata, L.A Syamsul Irfan Akbar,
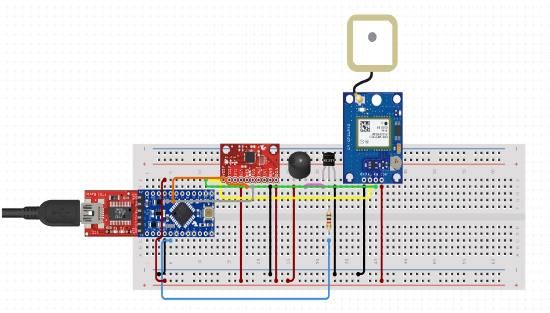
2016) Fig. 1. Design tool.
This research applies a backpropagation neural network to
Start with hardware design. The sensor used consists of
classify the type of earthquake Sembalun Mount Rinjani,
GPS sensors and MPU -6050. Arduino will control the sensor;
Lombok. Network Backpropagation neural network is trained
after that, data will be sent to the Antares server using LoRa
to strike a balance between the system's ability to recognize
Shield. Data will be received by Antares which contains
patterns used during training and the network's ability to
Longitude and Latitude data, Peak Ground Acceleration
provide the correct response to the input pattern with the
86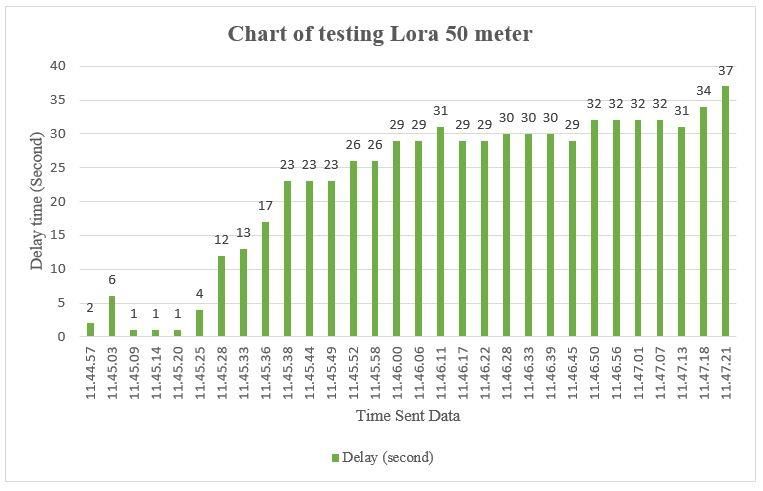
Value, around installing the equipment. After that, the data 4) Data in Antares
will be used to predict an earthquake's impact using the Radial The data to be displayed are longitude, latitude, and
Base Function algorithm with these parameters. The results Peak Ground Acceleration data. Antares is an Internet of
will be displayed on the web. Thing (IoT) platform, as cloud storage is explicitly created for
Hardware design is one of the first steps in making sensors. developing software and websites built [4].
Where sensors can read values and data obtained and run in The parameters that will be used consist of 2, namely:
the future.
1. Longitude and Latitude.
1) Installation of Sensor Devices
2. Peak Ground Acceleration.
In this research, the website design uses python
programming language as the back end and javascript as the
front end. Website appearance consists of 2 parts, namely a
system decision containing the results of determinations or
predictions from the model and the latest system data section
that includes Antares data. Designing this application
designed two different views: the YES decision page,
earthquake, and NO decision.
Fig. 2. Schematic tool. We provide an earthquake warning system in real-time
using PGA and machine learning to determine a direction
In this process, the sensor that will be used is TinyGPS from the picture below.
Neo6mv2. This sensor has four pins, namely Vcc, TX, RX,
ground pins. Each will be connected to the Arduino Pro Mini, Display on the web if the detected vibration is an
except the Vcc is connected to the Vcc MPU-6050 then to the earthquake.
SV Arduino Pro Mini pin. Pin TX is connected to pin D4, pin
RX will be connected to pin D3 on Arduino, and finally, the
ground pin will be connected to the ground pin on Arduino pro
mini.
GPS sensor functions to determine longitude and latitude
in the form of coordinates. And this distance data can be used
in the next process, whether there is Peak Ground
Acceleration in units (g) in the coordinate or close to the
previous coordinate by using a time pattern analysis.
Furthermore, the second sensor is the MPU-6050 to
measure the magnitude of Peak Ground Acceleration. This
sensor consists of four pins, namely Vcc, ground, SDA, and
SCL Vcc pins will be connected to the Arduino Pro Mini Fig. 3. UI display if earthquake.
voltage source 3.3v, ground to Arduino ground and the SDA
pin will be connected to the SDA pin on Arduino, and finally, Display on the web if the system decision is not an
the SCL pin is connected to the pin SCL on Arduino pro mini. earthquake.
The buzzer is then connected to the D8 digital pin for the
buzzer to tell if the parameter has passed the safe limit.
2) Data Reading
The sensor will read the data according to its function.
GPS sensor to determine longitude and latitude. At the same
time, the MPU-6050 sensor is used to measure Peak Ground
Acceleration. After the data is obtained, it will be sent to the
Antares platform using the LoRa network.
3) Send Data
The data to be sent consists of three data in the form of
strings to the Antares platform. Data sent in the form of
Longitude and Latitude (Longitude and Latitude), Peak Fig. 4. UI display, if not earthquake.
Ground Acceleration with units (g). The protocol used by
LoRa is LoRaWAN, with a frequency of 915 MHz. End In this research, the Radial Backpropagation artificial
devices function for receivers and transmitters, each gateway neural network method is used to make decisions that support
will be connected to the end device in its coverage area, and the occurrence of an earthquake or not. Based on Longitude
the gateway will forward the data to the network server, and Latitude, then for the final decision, Peak Ground
LoRa.id, and the data will be received by the Antares Acceleration data is used and supporting decisions. The final
platform [3]. decision on this system is whether an earthquake occurred or
no earthquake occurred. Which is a type of binary
classification? The architectural model used is as shown
below:
87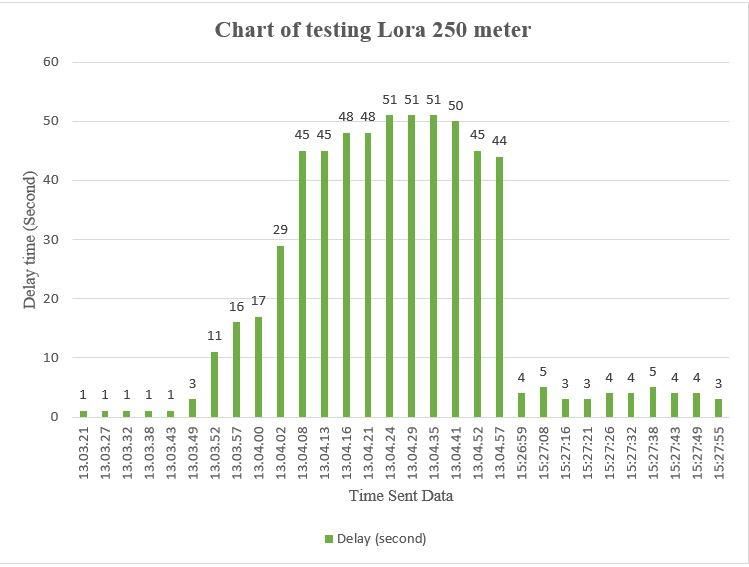
Fig. 5. Backpropagation architecture.                                     perform model testing using data sets, calculate accuracy, and
                                                                          save the model
    The backpropagation architecture consists of 4 layers, with
the first layer being the input layer, the first layer composed               The model formed is then integrated with the website
of 2 nodes where the first input (x1) is the latitude, and the            application. A final decision is made in the website
second input (x2) is longitude. The second and third layers are           application, where the input model is real-time data from
hidden layers where each layer has ten nodes with a Relu                  Antares consisting of longitude data, latitude data, and PGA.
activation function. The Relu function changes the weight                 The data is received by the web server running the Website
value that passes through the node to the maximum amount.                 application. Then it is processed in a supporting decision
And the last layer is the output layer wherein the layer of               model that requires longitude, latitude, and final decision of
adding all the weights of the third layer occurs.                         Peak Ground Acceleration data. Supporting decisions and
                                                                          final decisions can be explained by the pseudocode below.
   Where in general, the process starts from the preparation
of data, training, until testing the model that has been built.                           IV.   IMPLEMENTATION AND TESTING
The data preparation stages are making a dataset on BMKG                      Tests are carried out to determine whether the system is
data obtained in the form of excel in 2014 - 2018, into one               made to run by the original purpose. Where sensors can
whole file in comma-separated values. It starts by taking data            retrieve data correctly and test LoRa network performance.
from Excel, bringing together data from 2014 - 2018, filtering            The sensor is used to retrieve data from the accelerometer
out invalid data where some data is not used.                             sensor. For testing, the accelerometer sensor will measure the
                                                                          acceleration of the sensor movement. This is because the
                                                                          sensor used is a type of motion sensor, where the sensor only
                                                                          reads the value of the sensor movement itself.
                                                                              1) Accelerometer Sensor Test

                                                                                   TABLE I.     ACCELEROMETER TEST RESULT
                                                                          Testin      Gravit     Acc     Acc    Acc {Acc x} {Acc x}      {Acc
                                                                          g           y           X       Y      Z     ^2      ^2         x}^2
                                                                          1           1         0,15     -     -0,98 0,0225 0,0049       0,960
                                                                                                     0,08                                4
                                                                          2           0,99      0,14     -     -0,98   0,0196   0,0064   0,960
                                                                                                        0,08                             4
                                                                          3           1         0,15    0,08   -0,98   0,0225   0,0064   0,980
                                                                                                                                         1
                                                                          4           1,01      0,15    0,07   -0,99   0,0225   0,0049   0,960
                                                                                                                                         4
                                                                          5           1         0,14    0,08   -0,98   0,0196   0,0064   0,960
                                                                                                                                         4
Fig. 6. Backpropagation training and testing.                             6           1         0,15    0,08   -0,98   0,0225   0,0064   0,960
                                                                                                                                         4
    The next stage is the training of the backpropagation                 7           1         0,15    0,07   -0,99   0,0225   0,0049   0,980
model. In general, the process can be seen in the flow chart.                                                                            1
Starting from taking a data set, then separating the data set into        8           1,01      0,15    0,06   -0,98   0,0225   0,0036   0,960
                                                                                                                                         4
a data train and data test. Train the model using a data train,

                                                                     88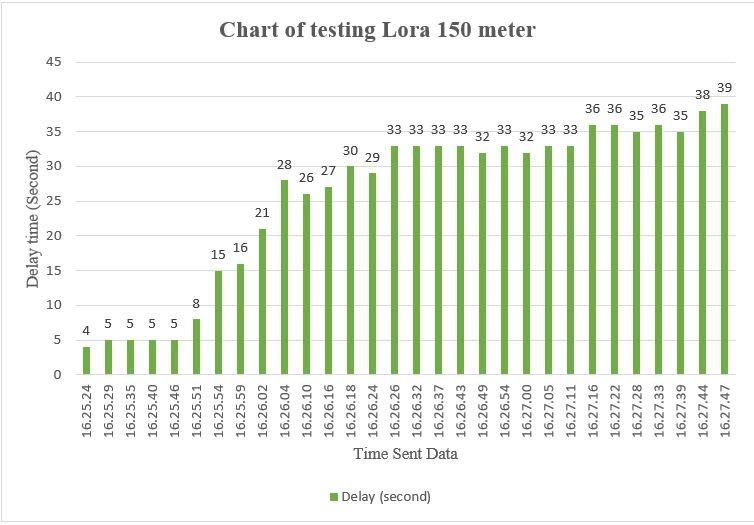
The results obtained by calculating the average values on acc z ^ 2 = 0.9801
the X, Y and Z-axis will be used to get the Peak Ground Steps taken to measure gravity
Accelerometer value used as our parameter. gravity = √ (0.0225 + 0.0025 + 0.9801) = 1.01
Peak Ground Acceleration calculation formula.
Gravity calculation formula.
Information: PGA = | ((1.01-1.01) × 1000) / 1 | = 0
〖Acc x〗 ^ 2 = 0.0225 The results obtained to get a value of 0, where Peak Ground
Acceleration is included in the safe parameter.
acc y ^ 2 = 0.0025
2) Lora Test Result
Fig. 1. Graph of 50 meter LoRa test result.
TABLE II. 50 METER LORA TEST RESULT TABLE III. 150 METER LORA TEST RESULT
Testing Start Data Delay Distance Status Testing Start Data Delay Distance Status
Sending Sent (second) (meter) Sending Sent (second) (meter)
1 11.44.57 11.44.59 2 50 Sent 1 16.25.24 16.25.28 4 150 Sent
2 11.45.03 11.45.09 6 50 Sent 2 16.25.29 16.25.34 5 150 Sent
3 11.45.09 11.45.10 1 50 Sent 3 16.25.35 16.25.40 5 150 Sent
4 11.45.14 11.45.15 1 50 Sent 4 16.25.40 16.25.45 5 150 Sent
5 11.45.20 11.45.21 1 50 Sent 5 16.25.46 16.25.51 5 150 Sent
6 11.45.25 11.45.29 4 50 Sent 6 16.25.51 16.25.59 8 150 Sent
7 11.45.28 11.45.40 12 50 Sent 7 16.25.54 16.25.09 15 150 Sent
8 11.45.33 11.45.46 13 50 Sent 8 16.25.59 16.25.15 16 150 Sent
9 11.45.36 11.45.53 17 50 Sent 9 16.26.02 16.26.23 21 150 Sent
10 11.45.38 11.46.01 23 50 Sent 10 16.26.04 16.26.32 28 150 Sent
11 11.45.44 11.46.07 23 50 Sent 11 16.26.10 16.26.36 26 150 Sent
12 11.45.49 11.46.12 23 50 Sent 12 16.26.16 16.26.43 27 150 Sent
13 11.45.52 11.46.18 26 50 Sent 13 16.26.18 16.26.48 30 150 Sent
14 11.45.58 11.46.24 26 50 Sent 14 16.26.24 16.26.53 29 150 Sent
15 11.46.00 11.46.29 29 50 Sent 15 16.26.26 16.26.59 33 150 Sent
16 11.46.06 11.46.35 29 50 Sent 16 16.26.32 16.27.05 33 150 Sent
17 11.46.11 11.46.40 31 50 Sent 17 16.26.37 16.27.10 33 150 Sent
18 11.46.17 11.46.46 29 50 Sent 18 16.26.43 16.27.16 33 150 Sent
19 11.46.22 11.46.51 29 50 Sent 19 16.26.49 16.27.21 32 150 Sent
20 11.46.28 11.46.58 30 50 Sent 20 16.26.54 16.27.27 33 150 Sent
21 11.46.33 11.47.03 30 50 Sent 21 16.27.00 16.27.32 32 150 Sent
22 11.46.39 11.47.09 30 50 Sent 22 16.27.05 16.27.38 33 150 Sent
23 11.46.45 11.47.14 29 50 Sent 23 16.27.11 16.27.44 33 150 Sent
24 11.46.50 11.47.22 32 50 Sent 24 16.27.16 16.27.52 36 150 Sent
25 11.46.56 11.47.28 32 50 Sent 25 16.27.22 16.27.58 36 150 Sent
26 11.47.01 11.47.33 32 50 Sent 26 16.27.28 16.28.03 35 150 Sent
27 11.47.07 11.47.39 32 50 Sent 27 16.27.33 16.28.09 36 150 Sent
28 11.47.13 11.47.44 31 50 Sent 28 16.27.39 16.28.14 35 150 Sent
29 11.47.18 11.47.52 34 50 Sent 29 16.27.44 16.28.22 38 150 Sent
30 11.47.21 11.47.58 37 50 Sent 30 16.27.47 16.28.26 39 150 Sent
89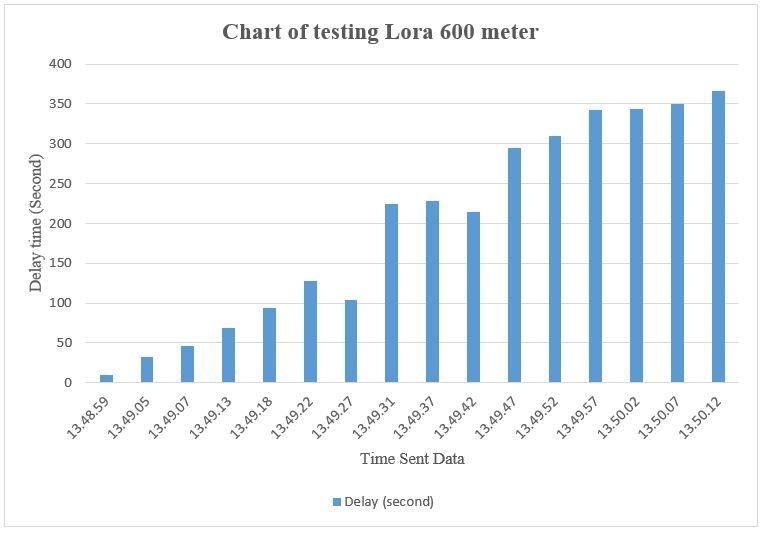
That way, you can calculate the percentage level of packet                      That way, the calculation of throughput obtained from
loss in sending data to Antares. To calculate the percentage of                  sending data using a LoRa within 50 meters is:
packet loss by using the following formula:
                                                                                    Throughput = (30 x 12) / 144 = 2,5bps.
   With such an accuracy obtained from sending data using
LoRa within 50 meters is:                                                            Based on the above calculation, the throughput of 2.5BPS
                                                                                 is obtained.
     packet loss = (30 -30) / 30 × 100% = 0%.

Fig. 2. Graph of 150 meter LoRa test result.                                               packet loss = (30 -30) / 30 × 100% = 0%
                                                                                    That way, the calculation of throughput obtained from
    That way, you can calculate the percentage level of packet                   sending data using a LoRa within 150 meters is:
loss in sending data to Antares. To calculate the percentage of                     Throughput = (30 x 12) / 143 = 2,51749 bps
packet loss by using the following formula:
                                                                                 Based on the above calculation, the throughput of 2.51749
  With such an accuracy obtained from sending data using                         bps is obtained.
LoRa within 150 meters is:
                                                          TABLE IV.    250 METER LORA TEST RESULT
                           Testing              Start           Data Sent    Delay (second)   Distance (meter)   Status
                                               Sending
                              1                13.03.21         13.03.22            1               250           Sent
                              2                13.03.27         13.03.28            1               250           Sent
                              3                13.03.32         13.03.33            1               250           Sent
                              4                13.03.38         13.03.39            1               250           Sent
                              5                13.03.43         13.03.44            1               250           Sent
                              6                13.03.49         13.03.52            3               250           Sent
                              7                13.03.52         13.04.03            11              250           Sent
                              8                13.03.57         13.04.13            16              250           Sent
                              9                13.04.00         13.04.17            17              250           Sent
                              10               13.04.02         13.04.31            29              250           Sent
                              11               13.04.08         13.04.53            45              250           Sent
                              12               13.04.13         13.04.58            45              250           Sent
                              13               13.04.16         13.05.04            48              250           Sent
                              14               13.04.21         13.05.09            48              250           Sent
                              15               13.04.24         13.05.15            51              250           Sent
                              16               13.04.29         13.05.20            51              250           Sent
                              17               13.04.35         13.05.26            51              250           Sent
                              18               13.04.41         13.05.31            50              250           Sent
                              19               13.04.52         13.05.37            45              250           Sent
                              20               13.04.57         13.05.41            44              250           Sent
                              21               15.26.59         15.27.05            4               250           Sent
                              22               15.27.08         15.27.13            5               250           Sent
                              23               15.27.16         15.27.19            3               250           Sent
                              24               15.27.21         15.27.24            3               250           Sent
                              25               15.27.26         15.27.30            4               250           Sent
                              26               15.27.32         15.27.36            4               250           Sent
                              27               15.27.38         15.27.42            5               250           Sent
                              28               15.27.43         15.27.47            4               250           Sent
                              29               15.27.49         15.27.53            4               250           Sent
                              30               15.27.55         15.27.58            3               250           Sent

                                                                            90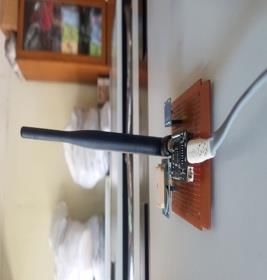
Fig. 3. Graph of 250 meter LoRa test result.
That way, you can calculate the percentage level of packet That way, the calculation of throughput obtained from
loss in sending data to Antares. To calculate the percentage sending data using a LoRa within 150 meters is:
of packet loss by using the following formula: Throughput = (30 x 12) / 152 = 2,36842 bps.
With such an accuracy obtained from sending data using Based on the above calculation, the throughput of 2.36842
LoRa within 250 meters is: bps is obtained.
packet loss = (30 -30) / 30 × 100% = 0%.
Fig. 4. Graph of 600 meter LoRa Test Result
That way, you can calculate the percentage level of packet 3) Backpropagation Model Test
loss in sending data to Antares. To calculate the percentage of Changing the variable Train set, test set, alpha, and epoch
packet loss by using the following formula: can show the highest results or accuracy done in previous
That way, the accuracy obtained from sending data using research [6], [7].
a LoRa within 600 meters is: TABLE V. BACKPROPAGATION MODEL TEST
packet loss = (30 -16) / 30 × 100% = 46.667%
No Train Set Test Set Alpha Epoch Accurate
Based on the above calculation, Packet Loss is 46.667%, 70% 30% 0,000001 1000 86%
1
which means that the data sent from LoRa is successfully sent.
2 80% 20% 0,000001 1000 85%
From Table IV, we can calculate the throughput of data 3 90% 10% 0,000005 1000 88%
transmission to Antares. To calculate the percentage of
throughput using the following formula: Testing the Backpropagation model consists of, namely:
Train Set: The part of the dataset that we train to make
That way, the calculation of throughput obtained from predictions or run functions from another ML algorithm
sending data using a LoRa within 600 meters is:
according to their respective goals
Throughput = (16 x 12) / 73 = 2,63013699 bps Test Set: The part of the dataset that we test to see its
Based on the above calculation, it is obtained throughput of accuracy, or in other words, to see its performance.
2.63013699 bps from 16 data that were successfully sent. Alpha: Tuning parameters in the model.
Epoch: Iteration Backpropagation
The highest accuracy obtained is 88% obtained from this
test. This test itself was carried out to find out the right
calculation to get the best results.
91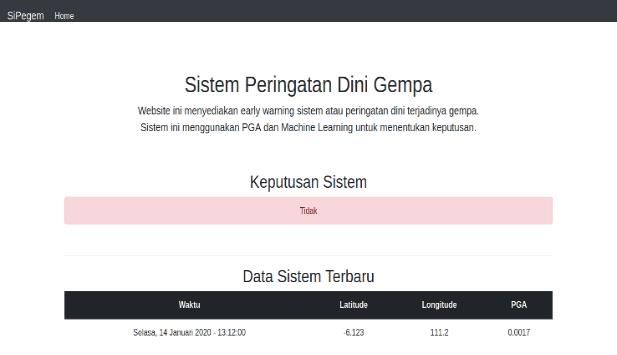
TABLE VI.              BMKG DATA
                            No          Date        Time Latitide     Longitude          Depth         Magnitudo
                             1       05/01/1/4    11:32:08 -6,09       105,37              5              5,2
                             2       12/01/1/4    10:46:50 -8,49       109,43              5              4,4
                             3       22/01/1/4    17:41:12 -6,79       106,76              5              4,0
                             4       03/11/1/4    08:56:30 -7,74       105,96              5              4,8
                             5       09/04/1/4    02:21:20 -7,31       106,79              8              3,3
                             6       06/01/1/4    01:10:09 -9,09       106,04             10              4,7
                             7       06/01/1/4    01:39:01 -9,58       107,07             10              4,5
                             8       14/01/1/4    02:27:15 -8,05       107,35             10              3,8
                             9       14/01/1/4    06:45:35 -7,47       107,54             10              3,3
                            10       17/01/1/4    02:52:51 -8,23       107,29             10              4,3
                            11       02/02/1/4    22:31:37 -7,67       108,61             10              3,8
                            12       03/02/1/4    22:36:42 -7,01       128,26             10              5,8
                            13       05/02/1/4    22:58:30 -6,60       105,07             10              4,1
                            14       06/02/1/4    23.40.00 -7,90       107,27             10              3,7
                            15       10/02/1/4    08:40:32 -8,43       108,59             10              4,1
                            16       11/02/1/4    09:32:06 -8,05       107,40             10              3,6
                            17       16/02/1/4    10:50:02 -7,84       106,63             10              4,6
                            18       21/02/1/4    07:41:03 -8,52       105,12             10              4,9
                            19       23/02/1/4    08:58:41 -8,11       108,30             10              4,4
                            20       26/02/1/5    19:41:04 -7,93       106,31             10              4,3

    The table above is the official data from BMKG that we                                              REFERENCES
use as parameters in this research. BMKG is the Indonesian                [1]   Kanata, B. and Akbar, L.S.I., 2018. Penerapan Jaringan Syaraf Tiruan
Agency for Meteorological, Climatological, and Geophysics.                      Backpropagation Untuk Mengklasifikasi Jenis Gempa Gunung Rinjani
This data is processed using the backpropagation method as                      Sembalun, Lombok. Dielektrika, 3(2 Agustus), pp.140-149.
a decision-maker supporting an earthquake's occurrence, or                [2]   Widianto, T., Abdullah, Z. and Pujiastuti, D., 2019. Analisis
an earthquake did not occur [5].                                                Percepatan Tanah Gempa di Sumatera Menggunakan Jaringan Syaraf
                                                                                Tiruan Metode Backpropagation. Jurnal Fisika Unand, 8(1), pp.64-71.
                       V.    CONCLUSION                                   [3]   Lundell, D., Hedberg, A., Nyberg, C. and Fitzgerald, E., 2018, June. A
                                                                                routing protocol for LoRa mesh networks. In 2018 IEEE 19th
    All sensors are running, but the stability is slightly                      International Symposium on" A World of Wireless, Mobile and
disturbed due to minimal capacity, and the MPU-6050 sensor                      Multimedia Networks"(WoWMoM) (pp. 14-19). IEEE.
can measure Peak Ground Acceleration (m/s2) values. The                   [4]   "ANTARES," [Online]. Available: https://antares.id/id/index.html.
network for urban areas that we recommend is a maximum                          [Accessed 12 March 2019].
distance of 250 meters; more than that, packet loss is vast. The          [5]   Andriani, F.D., Iryanti, M. and Sari, I.L., Analisis Pola Waktu Mula
                                                                                Anomali Polarisasi Sinyal Sebelum Gempa Bumi Di Wilayah Aceh
system is running correctly, and if the device is installed at the              Dan Sumatera Utara. Wahana Fisika, 2(2), pp.118-128.
test site, the system cannot send data but does not enter the
                                                                          [6]   Setyadi, N.A., Nasrun, M. and Setianingsih, C., 2018, December. Text
Antares platform due to the limited reach of the LoRa                           Analysis For Hate Speech Detection Using Backpropagation Neural
gateway. This study aims to determine the occurrence of                         Network. In 2018 International Conference on Control, Electronics,
earthquakes from Peak Ground Acceleration values and time                       Renewable Energy and Communications (ICCEREC) (pp. 159-165).
analysis patterns, which are obtained from the decision of the                  IEEE.
Backpropagation method with an accuracy rate of 88%.                      [7]   Taqyudin, M.I., Irawan, B. and Setianingsih, C., 2019, August. Wood
                                                                                Classification Based on Fiber Texture Using Backpropagation Method.
                                                                                In 2019 International Conference on Sustainable Engineering and
                                                                                Creative Computing (ICSECC) (pp. 245-250). IEEE.

                                                                     92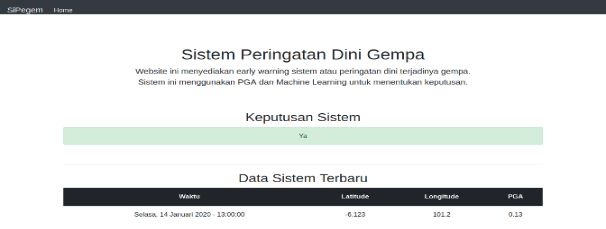
You can also read