Supplement of BARRA v1.0: kilometre-scale downscaling of an Australian regional at- mospheric reanalysis over four midlatitude domains - GMD
←
→
Page content transcription
If your browser does not render page correctly, please read the page content below
Supplement of Geosci. Model Dev., 14, 4357–4378, 2021
https://doi.org/10.5194/gmd-14-4357-2021-supplement
© Author(s) 2021. CC BY 4.0 License.

Supplement of
BARRA v1.0: kilometre-scale downscaling of an Australian regional at-
mospheric reanalysis over four midlatitude domains
Chun-Hsu Su et al.

Correspondence to: Chun-Hsu Su (chunhsu.su@bom.gov.au)

The copyright of individual parts of the supplement might differ from the article licence.
A. Data sets used in assessment

     The reference data sets used in the assessment of BARRA-C are summarized in Table S1. AWAP provides gridded daily
     0.05 × 0.05° analysis of station observed maximum and minimum 2 m temperature data, and raingauge-based daily
     accumulation of precipitation. The grids for temperature are generated using an optimized Barnes successive-correction
 5   method that applies weighted averaging to the station data. Topographical information is included by using anomalies from
     long-term (monthly) averages in the analysis process. By contrast, the ratio of observed rainfall to monthly average is used in
     the analysis process of precipitation. Readers are referred to Jones et al. (2009) for details. The root-mean-squared error
     (RMSD) of the daily maximum temperature analysis is around 1-1.5 K over the BARRA-C domains. The error is higher
     around Nullarbor Plain (northwest of the BARRA-AD domain) due to a relatively sparse network, and the Southeastern
10   highlands (BARRA-SY domain) due to strong temperature gradients between the coast and mountains. The analysis errors
     are larger for daily minimum temperature than for daily maximum values, with RMSD around 1.5-2 K and larger errors in
     the regions. For daily precipitation analysis, the RMSD over the BARRA-C domains is relatively uniform at around 2.5 mm.
     Higher RMSD of 5 mm is noted over northwestern coastal regions of BARRA-SY domain. Further, Chubb et al. (2016) has
     shown that the AWAP error for wintertime precipitation over the Snowy Mountains (BARRA-SY domain) can be as high as
15   4.5 mm, due to the lack of gauges and steep topography exposed to prevailing winds. At high elevations where frozen
     precipitation is challenging to measure, AWAP analysis has underestimated the total precipitation amount by more than
     10%. Therefore, the comparisons with AWAP for the Southeastern Highlands and the Nullarbor Plain need to be interpreted
     in view of these limitations. King et al. (2012) has also found AWAP tends to report lower extreme rainfall estimates (e.g.,
     climatological 95th percentile rainfall) than those observed at stations, which is characteristic of an interpolated product.
20
     The Rainfields2 grids are created by blending radar fields with the gauge observations using the conditional merging of
     Sinclair and Pegram (2005) (Seed et al., 2007). The resulting products can be erroneous due to reflectivity measurement
     errors (e.g., terrain blocking, clutter) and errors in reflectivity-rain rate relationship, and can be biased due to the tendency
     for the radar to underestimate throughfall rainfall from a distance. Radar measurements captures precipitation at some height
25   over a cubic km in volume, while the model simulates throughfall precipitation at surface. Therefore, we apply percentile-
     based thresholds computed across all the storm events in the FSS assessment to circumvent the issue of intrinsic bias
     between radar-based and modelled precipitation. It is of note that some limitations exist due to spatial variability of the
     biases in the radar product.

30   ERA-Interim and ERA5 are global atmospheric reanalyses produced based on ECMWF Integrated Forecasting System
     (IFS), but at different versions Cy31r2 (Dee et al., 2011) and Cy41r2 (Hersbach et al.,2020), respectively. ERA-Interim is
     used to provide lateral boundary conditions for BARRA-R reanalysis, which in turn drives BARRA-C. ERA5 differs from

                                                                     1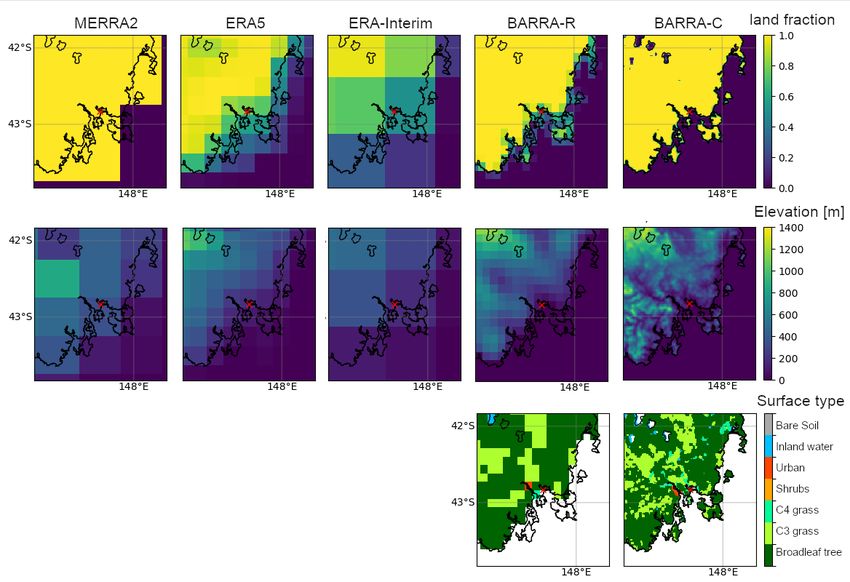
ERA-Interim in many ways, including the use of a higher (horizontal and vertical) resolution model, hybrid 4DVar with
     ensemble of data assimilation to allow flow-dependent model error covariance, and new observations. ERA-Interim suffers
35   from inconsistent SST, such that ERA5 is more appropriate for climate studies, with variational bias correction applied also
     to ozone, aircraft and surface pressure observations.

     MERRA2 (Gelaro et al., 2017) is considered in our assessment as a different global reanalysis to ERA reanalyses. It is
     produced with version 5.12.4 of the Goddard Earth Observing System (GOES) model and analysis scheme. In contrast to
40   BARRA-R and ERA reanalyses that use the 4DVar scheme, 3DVar algorithm is used with the FGAT procedure to compute
     temporally accurate O-B departures.

     Table S1: List of reference data sets used in the assessment of BARRA-C.
     Data sets                             Source                               Spatial     grid   Temporal     Parameters used
                                                                                spacing            intervals
     Australian Water Availability         Bureau       of     Meteorology,     0.05 × 0.05°       Daily        Maximum        and
     Project (AWAP; Jones et al., 2009)    http://www.bom.gov.au/climate                                        minimum screen-
                                                                                                                level temperatures,
                                                                                                                precipitation
     Rainfields2 blended radar, gauge      Bureau of Meteorology                1 × 1 km           30 minutes   Precipitation
     product (Seed et al., 2007)
     Land-based      weather     station   ECMWF archive and The Bureau’s       Point              Sub-daily    Screen-level
     observations                          archive of 10 min observational                                      temperature,
                                           data.                                                                surface pressure,
     ERA-Interim Reanalysis (Dee et        ECMWF                                0.75 × 0.75°       3 hourly     10      m     wind,
     al., 2011)                                                                                                 precipitation
     ERA5 Reanalysis (Hersbach et al.,     Copernicus Climate Data Store        0.25 × 0.25°       Hourly
     2020)
     MERRA2 Reanalysis (Gelaro et          NASA Goddard Earth Sciences          0.5 × 0.625°       Hourly
     al., 2017) - M2T1NXSLV.5.12.4 ,       Data and Information Services
     M2T1NXFLX.5.12.4                      Center
     BARRA-R Reanalysis (Su et al.,        Bureau of Meteorology                0.11 × 0.11°       Hourly
     2019)

         B. BARRA-C setup

45   As supplements to Sec. 2, Figure S1 shows the dominant land cover over the BARRA-C domains. It is of note that the model
     also takes into account subgrid variability of land cover, but not shown here. The hindcast simulation set up of BARRA-C is
     shown in Figure S2, highlighting the data flow between its driving model BARRA-R and BARRA-C.

                                                                      2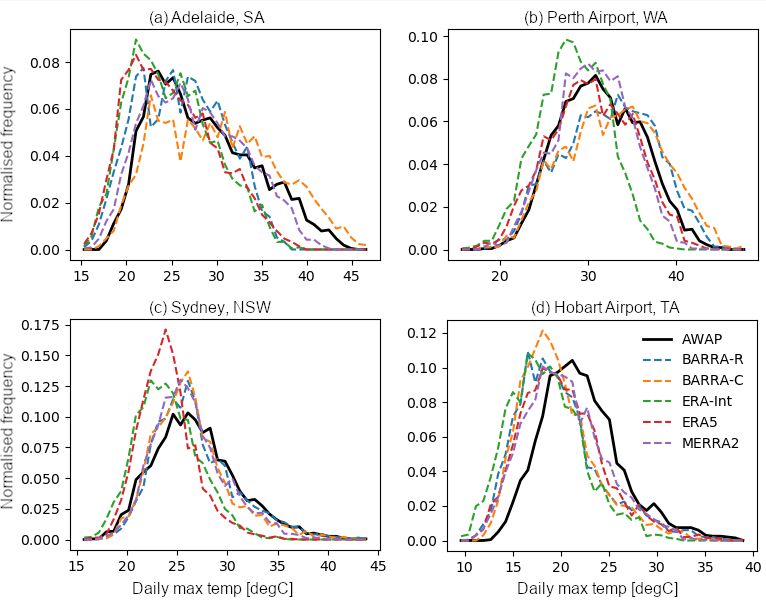
Figure S1: Most dominant surface types at each grid cell mapped on the BARRA-C 1.5 km grid.
50

     Figure S2: Cycling set-up of BARRA-C at base time t0 = 00:00, 06:00, 12:00, and 18:00 UTC. Each UM hindcast is initialized at t 0
     with BARRA-R analysis centred at t0 and subjects to boundary conditions from BARRA-R hindcast from t0, t0+1h, …, t0+9h. The
     purple bars indicate the time steps of the model states that have been archived.

55       C. Point evaluation of screen temperature and 10 m wind speed

     As supplements to Sec. 3.1, Figure S3 plots the difference in RMSD in screen temperature and 10 m wind speed, between
     BARRA-C and BARRA-R at each observing stations.

                                                                    3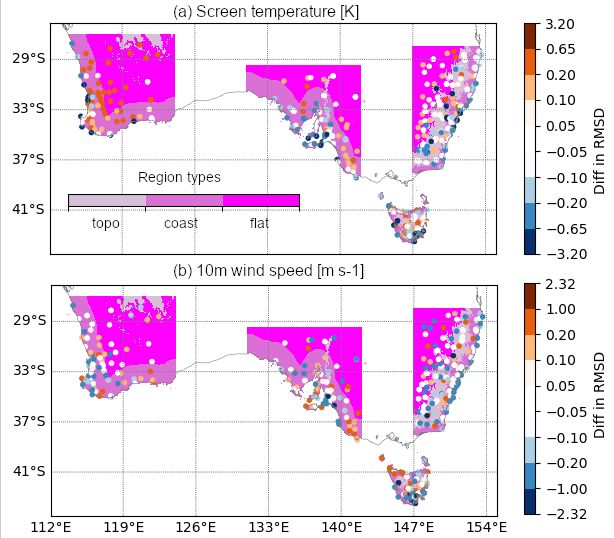
Figure S3: Difference in RMSD at each station between BARRA-C and BARRA-R for (a) screen temperature and (b) 10 m wind
60 speed. The boxplots of the score from different models are plotted in Figure 2. The background shows three regions of analysis:
complex topography (‘topo’), coastal (‘coast’), and flat.
D. Comparison with gridded analysis of daily maximum and minimum screen temperature
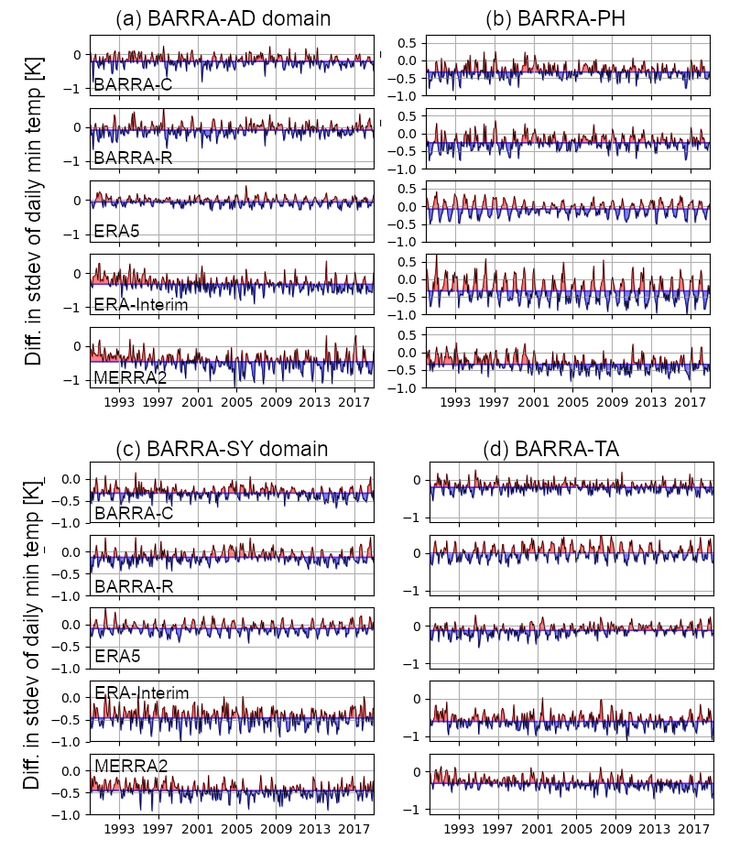
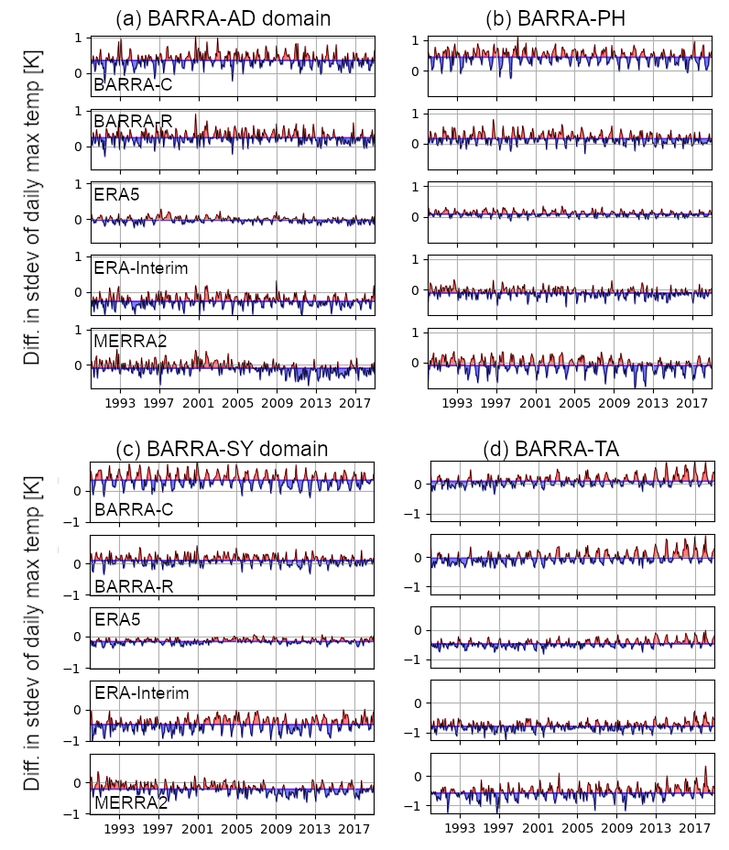
Figure S4 and S5 compare BARRA and other reanalyses in terms of their differences in spread of daily maximum and
minimum (screen) temperature respect to AWAP.
65
4Figure S4: As with Figure 4, but for monthly difference in standard deviation of daily maximum temperature over various
BARRA-C domains, with respect to AWAP. The timeseries are shaded around their individual 1990-2018 means.
570 Figure S5: As with Figure S4, but for daily minimum temperature.
E. Storms over Sydney
The approach of using fractions skill scores (FSS) with radar-retrieved rainfall observations to assess sub-daily BARRA-C is
taken in Sec. 3.5. From the 36 multi-day storm event set, 1323 different 6-hour events are produced using a moving window.
FSS is computed for each 6-hour event for each model and then the scores are aggregated to give an average for all events.
75 Given that inherent bias between the observation and the models exist due to their representativity differences and also to
focus on the spatial accuracy of the models, we use percentile-based thresholds computed across all the storm events. This
ensures that the model and observed rain fields have an identical fraction of rain events for each threshold value. The rain
thresholds of 4,8 and 64 mm correspond to 59.6th, 92.1st and 99.9th percentiles of observed values for all 1323 events. The
percentiles are matched per event and so the actual rain thresholds for model and observations vary in each FSS calculation.
80 The BARRA-R rain thresholds corresponding to these higher percentiles are generally lower due to fewer higher rainfall
values. The BARRA-SY rain thresholds are generally much closer to the observed rain thresholds, especially at the higher
percentiles. In the case where there is not enough model or observed rain to accurately match percentiles, the FSS is not
6calculated. A case in point is the case of 99.9th percentile threshold, BARRA-SY had only 1288 valid events and BARRA-R
had only 1074 valid events, so the number of FSS included in the accumulation is different for each model for this highest
85 percentile. But for both of the 59th and 92nd percentile threshold values, the FSS was calculated for all 1323 events for both
BARRA-R and SY.
Here in Figure S6, we also provide an additional comparison with ERA5 for the same set of storm events.
90
Figure S6: Aggregated FSS across 95 12-hour non-overlapping storm events as a function of neighbourhood distance (window
length size i.e., number of 1.5km grid cells) for 12h rainfall above two percentile thresholds, 48th (blue) and 62nd (orange). Scores
for three models are shown, BARRA-C (solid), BARRA-R (dashed) and ERA5 (dotted).
F. Added value analysis for temperature and rainfall extremes
95 In the added value analysis, the various reanalysis data sets are bilinearly interpolated to the AWAP 0.05 × 0.05° grid whilst
BARRA-C is upscaled via spatially averaging. An alternative way to present the added value analysis in Figure 11 is to
7distinguish three regions of analysis: complex topography (‘topo’), coastal (‘coast’), and flat (see Figure S3). Here we find
that the AV for temperature extremes is more consistently found over the coastal regions.
100
Figure S7: Added value (AV) analysis of the (a) warm extreme of daily maximum temperature, (b) cold extreme of daily minimum
temperature, and (c) wet extreme of daily precipitation, performed for the different regions: complex topography (‘topo’), coastal
(‘coast’), and flat (Figure S3).
At a closer look for daily maximum temperature, the distributions of summer values from the reanalyses can differ
105 significantly locally, and Figure S8 illustrates this for four AWAP grid cells near the four state capital cities. The closest
model grid cells are selected, and due to differences in spatial resolution, not all models treat these cells as land points, and
even as a land point, they are treated with different land fractions. These affects how representative they are simulating
temperature seen at the local scale. Figure S9 illustrates this for Tasmania, where the associated grid cell land fraction varies
between 0.55 (BARRA-C) to 0.8 (ERA5) and the elevation varies between around 2 m (BARRA-C) to about 200 m (ERA
110 reanalyses). Here we find that BARRA-C simulates similar extremes as BARRA-R for Sydney and Hobart. Compared to all
the reanalyses, BARRA-C tends to show a larger variance and overestimates the high temperature extremes in Adelaide and
Perth, agreeing with the results seen in the AV analysis and Figure 3(c).
8Figure S8: Frequency distributions of summer (DJF) daily maximum temperature at four AWAP grid points near the major cities
115 in each BARRA-C domain, namely Adelaide (34.92⁰S, 138.62⁰E), Perth (31.92⁰S, 115.97⁰E), Sydney (33.86⁰S, 151.20⁰E) and
Hobart (42.83⁰S, 147.50⁰E), identified in Figure 1.
9Figure S9: (top) land mask or fraction of the various models centred at the Hobart Airport (red crosses), Tasmania, (middle) their
120 orography, and (bottom) domain surface cover types for BARRAs.
References
Chubb, T., Manton, M., Siems, S., & Peace, A. D.: Evaluation of the AWAP daily precipitation spatial analysis with an
independent gauge network in the Snowy Mountains. Journal of Southern Hemisphere Earth Systems Science, 66(1), 55-67,
doi:10.22499/3.6601.006, 2016.
125 Dee, D. P., Uppala, S. M., Simmons, A. J., Berrisford, P., Poli, P., Kobayashi, S., Andrae, U., Balmaseda, M. A., Balsamo,
G., Bauer, P., Bechtold, P., Beljaars, A. C. M., van de Berg, L., Bidlot, J., Bormann, N., Delsol. C., Dragani, R., Fuentes, M.,
Geer, A. J., Haimberger, L., Healy, S. B., Hersbach, H., Holm, E. V., Isaksen, L., Kallberg, P., Kohler, M., Matricardi, M.,
McNally, A. P., Monge-Sanz, B. M., Morcrette, J. J., Park, B. K., Peubey, C., de Rosnay, P., Tavolato, C., Thepaut, J. N.,
and Vitart, F.: The Era-Interim reanalysis: Configuration and performance of the data assimilation system, Q. J. Roy.
130 Meteorol. Soc., 137, 553–597, doi:10.1002/qj.828, 2011.
Gelaro, R., McCarty, W., Suárez, M. J., Todling, R., Molod, A., Takacs, L., Randles, C. A., Darmenov, A., Bosilovich, M.
G., Reichle, R., Wargan, K., Coy, L., Cullather, R., Draper, C., Akella, S., Buchard, V., Conaty, A., da Silva, A. M., Gu, W.,
Kim, G., Koster, R., Lucchesi, R., Merkova, D., Nielsen, J. E., Partyka, G., Pawson, S., Putman, W., Rienecker, M.,
10Schubert, S. D., Sienkiewicz, M., and Zhao, B.: The Modern-Era Retrospective Analysis for Research and Applications,
135 Version 2 (MERRA-2), J. Climate, 30, 5419–5454, doi:10.1175/JCLI-D-16-0758.1, 2017.
Hersbach, H, Bell, B, Berrisford, P, et al.: The ERA5 global reanalysis. Q. J. R. Meteorol. Soc., 146: 1999– 2049,
doi:10.1002/qj.3803, 2020.
King, A.D., Alexander, L.V. and Donat, M.G.: The efficacy of using gridded data to examine extreme rainfall
characteristics: a case study for Australia. Int. J. Climatol., 33: 2376-2387, doi:10.1002/joc.3588, 2012.
140 Jones, D. A., Wang, W., and Fawcett, R.: High-quality spatial climate data-sets for Australia, Aust. Meteorol. Oceanogr. J.,
58, 233–248, 2009.
Seed, A., Duthie, E., and Chumchean, S.: Rainfields: The Australian Bureau of Meteorology system for quantitative
precipitation estimation. Proceedings of the 33rd AMS Conference on Radar Meteorology, Cairns, Australia, 2007.
Sinclair, S. and Pegram, G.: Combining radar and rain gauge rainfall estimates using conditional merging, Atmos. Sci. Lett.,
145 6, 19–22, doi:10.1002/asl.85, 2005.
11You can also read