Assessing the Application of Vacuum-Based Membrane Dehumidification for Tropical Climates - Transsolar
←
→
Page content transcription
If your browser does not render page correctly, please read the page content below
Transsolar Academy 7 (2020-2021)
 Final Project Report

 Assessing the Application of Vacuum-Based Membrane
 Dehumidification for Tropical Climates.

 Ana Diaz1, Guowei Wu1, Pamela Cabrera2, Viola Zhang2
 1TRANSSOLAR Energietechnik GmbH (Stuttgart, Germany), 2Transsolar Inc. (New York,

 USA)

ABSTRACT: The tropics are often characterized by high temperatures and elevated humidity ratios that contribute to heat
stress. Implementing certain passive design strategies for cooling, such as natural ventilation, can help reduce thermal
discomfort, but during summer conditions relying on passive strategies alone for cooling is not enough and has its
limitations. Incorporating membranes in mechanical systems reduce latent loads for cooling and eliminate the need to
reheat the supply air. As a building element, vacuum-based membranes could be applied as a low-energy cooling strategy to
condition and increase the potential of natural ventilation in hot and humid climates. This study analyses the
implementation of vacuum-based membranes for dehumidification. The purpose of this research is to evaluate the Vacuum-
based membrane dehumidification system against a Dedicated Outside Air System (DOAS) in terms of energy consumption
and performance in improving thermal comfort inside an office space for hot and humid climates.
KEYWORDS: vacuum-based membrane, dehumidification, hot and humid climates, tropics, low energy dehumidification,
absolute humidity.

1. INTRODUCTION
 The tropics are often characterized by year-
round high temperatures (Tmin ≥ +18 ◦C), high
amounts of solar radiation and abundant annual
precipitation, and most importantly, humidity
ratios generally higher than 12 grams of moisture Figure 1 Feed and Permeate States in the membrane
per kilogram of dry air year-round. process. (Woods, 2014)
 The combination of high temperatures and
 separates the “Feed Side” and the “Permeate
elevated humidity ratios contribute to the heat
 Side”. In the case of vacuum-based membrane
stress that characterizes this climate.
 dehumidification, the flux of water vapor occurs
Implementing certain passive design strategies for
 across the membrane from the high concentration
cooling, such as natural ventilation, can help
 state (feed side/outdoor-humid air) to the low
reduce thermal discomfort, but during summer
 concentration state (permeate side). According to
conditions relying on passive strategies alone for
 (Woods, 2014), a higher permeability means less
cooling is not enough and has its limitations.
 membrane area for a given transfer rate, and a
 In response to this, commercial and office
 higher selectivity means a purer product stream,
space buildings in tropical locations rely exclusively
 which can be either the permeate or the retentate.
on mechanical systems for cooling, leading to high
 The membrane module used in this study was
electricity consumption. This mainly to the
 developed by Pamela Cabrera in the National
dehumidification process of cooling down the air
 University of Singapore Lab. The membrane is a
to its dewpoint temperature (to condensate the
 flat sheet membrane that follows the geometric
moisture out of the air) and reheating the air up to
 design of the Miura fold. The Miura fold allows for
the desired supply temperature.
 This study analyses the implementation of
vacuum-based membranes for dehumidification.
The purpose of this research is to evaluate the
Vacuum-based membrane dehumidification
system against a Dedicated Outside Air System
(DOAS) in terms of energy consumption inside an
office space for hot and humid climates.
 2. MEMBRANE MODULE BACKGROUND
 A membrane is a barrier; its essential purpose
is to selectively separate two species. Selectivity
and permeability are important for the
membrane’s performance. Figure 1 shows a
 Figure 2 Membrane Structure and
general membrane process, where the membrane Materials. (Cabrera, 2019)
Transsolar Academy 7 (2020-2021)
Final Project Report
more passages in the membrane, increasing infiltration rates, internal loads were set up.
surface area, as well as inner turbulence improving Initially, hand calculations and a excel sheet were
the module effectiveness. developed out to determine the amounts of g/kg
The top layer is made of a hydrophilic material for the membrane to reduce, membrane area and
that absorbs the water content of the humid air the vacuum pump power required. Finally, the set
(PEG400); the substrate layer is a cellulose acetate of equations and constants were set as inputs in
sheet with a base hydrophobic layer of PTFE the TRNLizard model to generate the results.
(Cabrera, 2019). This layer releases the moisture 3.1 MEMBRANE AND VACUUM POWER
into the permeate side. Higher selectivity requires CALCULATIONS
less pressure gradient to permeate water across The study methodology is developed to answer
the membrane (Cabrera, 2019). the following questions:
The membrane module has an effectivity of 1. How much humidity should we reduce?
0.15g/m2s. For the study, the membrane What is the target?
effectivity remains constant, meaning that it is 2. How much membrane area is required to
assumed that the flow of water vapor in the achieve the goal of humidity reduction?
membrane is uniform during operation. Further 3. How much vacuum pump power is
studies should account for performance losses. needed to reach the desired humidity
Energy-wise, since the membrane selects the reduction?
water molecules by diffusion, the only energy input To answer question#1, we use ASHRAE Standard
in the system is the energy required for the 62-2001 as a guide. The ASHRAE Standard 62-2001
vacuum pump (Cabrera, 2019). The pressure recommends the relative humidity of 30–60% for
difference created by the vacuum pump across the indoor environments. (Yang, Yuan, Gao, & Guo,
membrane and the membrane module is also a 2015). Hence, the maximum supply humidity
relevant element to drive the mass transfer target in the set to 50% relative humidity. This
(humidity flux). When humid air passes above the means the membrane module must reduce the
membrane, the output is drier air, but its outdoor air relative humidity levels to 50% relative
temperature remains constant. Only the water humidity before supplying it to the indoor space.
content in the air decreases, making it an Using TRNLizard, the Deck Template was modified
isothermal process. to create a new Psychrometric Type ("Type33e-3"
Incorporating membranes in mechanical (Type 33)), and to input the equation:
systems reduce latent loads for cooling and
eliminate the need to reheat the supply air. As a ℎ50 = 50 ! ℎ
building element, vacuum-based membranes could
be applied as a low-energy cooling strategy to Where a different psychrometric module will
condition and to increase the potential of natural compute the absolute humidity (kg/kg) for
ventilation in hot and humid climates. constant 50% relative humidity conditions. This
3. METHODOLOGY new unit is used in the User Equations to retrieve
The hot and humid locations selected were La the absolute humidity in gwater/kgdryair with this
Lima, Honduras and Miami, USA. Only summer equation:
conditions were analysed, thus only the month of
June was simulated. A one-zone (shoe box) model 50 ℎ = [34,1] ∗ 1000
was set up to represent an office space for the
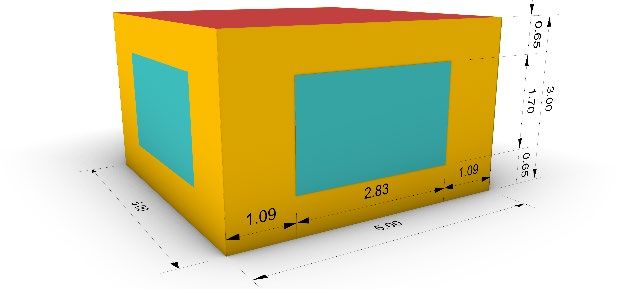
simulation. The zone has an area of 25m2 with a Where [34] is the reference to the new
height of 3 meters, and a window to wall ratio of Psychrometric type and [1] is indicated to retrieve
32% on north and east walls. South and west walls the absolute humidity output. Knowing the
have no windows. absolute humidity value at constant 50% relative
humidity, the following formula subtracts the
outdoor air absolute humidity (gwater/kgdryair) to the
absolute humidity at 50 relative humidity
(gwater/kgdryair), which will equal to the humidity
reduction produced by the membrane module.
= ( ) − ( ℎ50 )
Figure 3 Zone Dimensions
To calculate the membrane area required to achive
The simulations were done using the software the MemRed, the following formula was
TRNLizard; where the model construction types,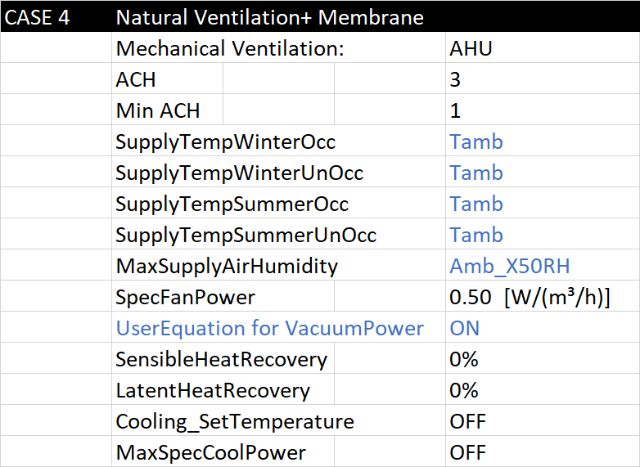
Transsolar Academy 7 (2020-2021)
 Final Project Report

generatedand added as an input in the TRNLizard J/kg K, and Ra is the gas constant of air, Ra= 286.9
User Equations list: J/kg K. In TRNLizard, the moist air density is
 retrieved from the Psychrometric (Type 33) by
 ( ∗ ∗ ) adding the following equation into the User
 =
 Equations list:

 Here VentReq (Ventilation Requirements) is the = [33,4]
total volume flow rate required for the space
(m3/s). This is calculated based on the space Where [33] is the reference to the
population and the liters per second (l/s) required Psychrometric type and [4] is indicated to recall the
for minimum fresh (outdoor) air ventilation rates moist air density output.
for office spaces. Engineering experience and field Finally, for hand calculations, the equation to
studies indicate that an outdoor air supply of about calculate the total membrane area can also be
10 l/s per person is very likely to provide displayed in this way:
acceptable perceived indoor air quality in office
spaces, whereas lower rates may lead to increased 3
 [( ) ∗ ( 3 ) ∗ / )]
sick building syndrome symptoms. (Clark, 2013)
 ( 2 ) =
Therefore, a rate of 10 l/s·person was used. For / ² ·
hand calculations this formula can be used to
calculate the total ventilation requirements: With this equation, we answer question #2 of the
 methodology process.
 ( ∗ ℎ ) As mentioned before, the dehumidification
 = process of the membrane module depends on the
 1000
 different pressure states between the feed and the
 In TRNlizard, we calculate the ventilation permeate side. To create the transmembrane
requirements based on the input of 36m3/h set in pressure gradient, a vacuum pump must be
the Mechanical Ventilation component in the installed at the permeate side, where the pressure
“OrPersonRelatedVolumeFlow” section. The should be always lower than the water vapor
following formula was also added to the User partial pressure of the outdoor air. (Chen, 2019)
equations: The formula to calculate the vacuum power
 derives from the power equation:
 = ( _ 1 ∗ _ ℎ _ _ 1)/3600
 ṁ ∗ ṁ ∗ ∗ ∗ ̇
 = = =
 Here _ 1 is the volume of the space (m3), ∗ ∗
and _ ℎ _ _ 1 is the number of air changes
in the mechanical ventilation unit (1/h). Where vacuum pump power is the product of
 To calculate the density of moist air with hand the pressure difference [Pa] multiply by the
calculations, we first need to know the density of Volumetric flow [m3/s] (inside the membrane) and
dry air density. Dry air density depends on pressure divided by the pump efficiency assumed to have an
and temperature. In this study the following efficiency of 0.80, based on (Chen, 2019) analysis.
formula was utilized: First, we analyzed the configuration shown in
 Figure 4. Here, the water vapor is expelled to the
 = /(( ) ∗ ( ambient, therefore the output pressure is set to
 + 273.15)) 101,325Pa (101,325 N/m²). The desired permeate
 pressure is 2,500Pa (2,500 N/m²).
 Where AP, is the atmospheric pressure
(101,325 Pascals). Rspecific is the specific gas
constant, R = 287 J/kg·K. Tamb is ambient
temperature.
 Knowing the density of dry air, the following
formula applies to calculate the moist air density:

 ( ) ∗ (1 + ) Figure 4 Schematic of 1-Stage Vacuum Based Membrane
 =
 (1 + ∗ / ) Dehumidification Process.

 Where DAdensity (kg/m3), is the density of dry Another configuration, Figure 5, is to pump the
air. X is the humidity ratio of outdoor air (kg/kg). water vapor to a lower output pressure instead of
Rw is the gas constant of water vapor, Rw= 461.5 ambient absolute pressure. In this concept, the
Transsolar Academy 7 (2020-2021)
 Final Project Report

compressor discharges the water vapor into a Watts or a total of 0.20(W/m3/h). With the
second membrane module, which puts the low- m3/h of 144 m3/h (based on 10 liters per
pressure vapor in contact, through a membrane, person and a population of 4 people in the
with ambient air. (Woods, 2014). Then the vacuum study zone.)
pump will only pump (water vapor) to the ambient A second membrane in the system reduces the
vapor pressure. In this case, the output pressure is vacuum power by 98.4% in comparison 1-stage
assumed to be 4,000Pa (4kPa). Permeate pressure membrane system.
is 2,500Pa (2.5KPa).
 Volumetric Feed Permeate
 Efficiency Vaccum Power
 flow Pressure Pressure
 - m³/s N/m² N/m² Nm/s W
 0.800 0.0154 101325 2500 1906.38 1906.4
 0.800 0.0154 4000 2500 28.94 28.9
 Figure 6 1-Stage and 2-Stage Vacuum Power Results

 The equation and the results prove that higher
 pressure differences ( ) in the system yield
 higher vacuum power demand for
 dehumidification. Therefore, the system chosen for
 this study is the 2-Stage Vacuum Based Membrane
Figure 5 Schematic of 2-Stage Vacuum Based Membrane Dehumidification system.
 Dehumidification Process. Additionally, we can include the vacuum
 equations in the User Equation panel to calculate
 Additionally, we calculate the volumetric flow total the vacuum pump power in W/m2 using
using the following formula: TRNLizard:

 ̇ = ̇ = (( − ) ∗ )/
 2 = / _ 1
 = 2 + _ _ _ 1
 Where n is equivalent to 1 mole, R is the molar
gas constant [8.314 m³·PA/K·mol]. T is outdoor air
 Where, the total electricity is the sumation of
temperature in Kelvin, m is the molecular mass of
 the air handling unit fan electricity usage (W/m2)
water [0.018kg/mol]. P is the pressure in the
 and the vacuum power in W/m2.
permeate side [Pa] and ̇ is the mass flow inside
 3.2 CASE 1: DOAS SYSTEM
the membrane module [kg/s]. In hand calculations
 Case 1 was set up to represent and simulate
and the TRNLizard file, the module mass flow was
 the regular operation of a Dedicated Outside Air
calculated using this equation:
 System with additional cooling included to
 condition the space. The DOAS system uses the
 =
 Outside (Humid) Air and handles the sensible and
 ( ∗ )/1000)
 latent loads by circulating the humid air through
 the cooling and reheat coil before supplying it to
 The volumetric flow equation is added to the
 the zone/space. A parallel system, the additional
User Equations list by adding the previously stated
 cooling, handles, in most cases, the sensible loads
constants and the following formula:
 produce indoors (internal loads from people gain,
 equipment, building envelope, solar radiation.)
 = (( ∗ ∗ ( + 273.15))/((
 ∗ ) ∗ ))
 ∗
 Finally, the power calculations for both
systems configurations produce the following
results (Figure 6):
 1) A 1-Stage Vacuum Based Membrane
 Dehumidification system requires 1906.4
 Watts or a total of 13.24(W/m3/h). With
 the m3/h of 144 m3/h (based on 10 liters
 per person and a population of 4 people in
 the study zone.) Figure 7 CASE 1: Dedicated Outside Air Setup and Process
 Representation in Psychrometric Chart.
 2) A 2-Stage Vacuum Based Membrane
 Dehumidification system requires 28.9
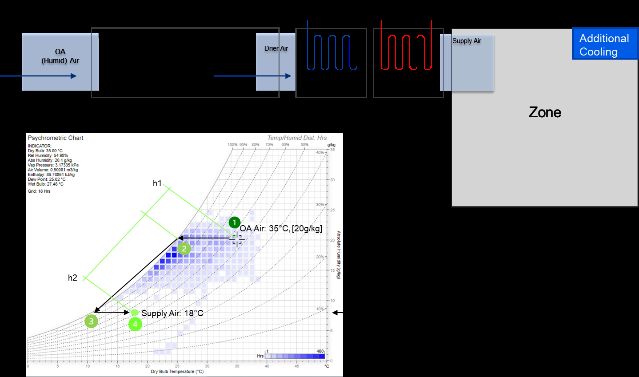
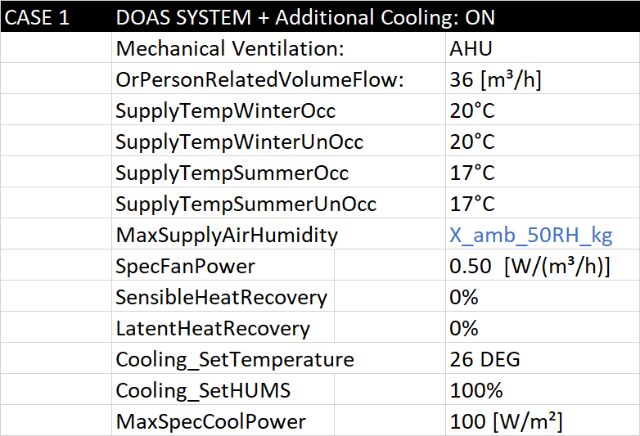
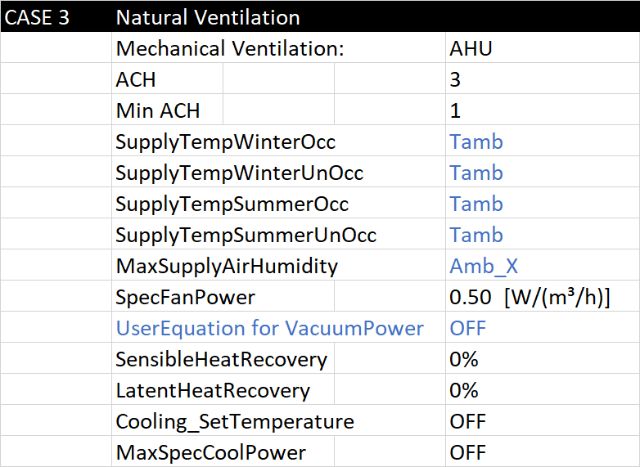
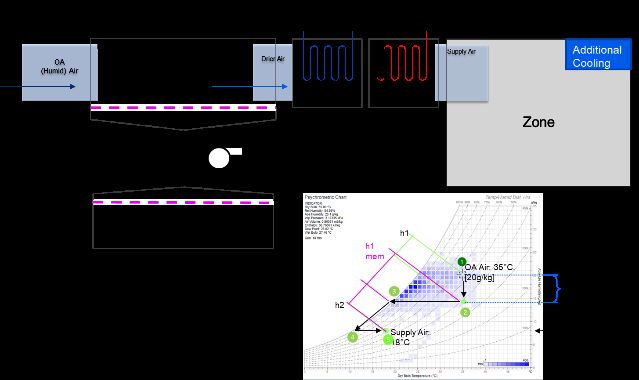
Transsolar Academy 7 (2020-2021)
 Final Project Report

 Case 1 TRNLizard input setups are the The expected results for CASE 2; are: first,
following: higher fan energy demand since the vacuum pump
 is required for the dehumidification process of the
 membrane. Second, the results should indicate a
 reduction in the latent loads of the system,
 meaning since the membrane is already providing
 the dehumidified air to the space most of the
 cooling power should be for the sensible loads.
 Since the supply air in Case 2 is Ambient
 Temperature, the sensible cooling power required
 should be higher for in this case systems.
 3.4 CASE 3: NATURAL VENTILATION
 Case 3 was set up to represent and simulate
 the usage of natural ventilation to condition the
 Figure 8 Case 1-TRNLizard input details.
 space. This case is created to analyse the Predicted
 3.3 CASE 2: DOAS AND MEMBRANE SYSTEM Mean Vote (PMV) in the zone when using natural
 Case 2 is set as an optimization of the Case 1 ventilation.
DOAS System. In this case, the system supplies only Case 3 TRNLizard input setups are the
ambient air temperature dehumidified by the following:
membrane system. The membrane and vacuum
pump equations are included to have the
membrane system dehumidify the air to the
previously stated 50 ℎ conditions (and not the
heating and cooling coils) before supplying it to the
space.
 Also, we considered the 2-Stage Vacuum Based
Membrane Dehumidification system setup. Again,
a parallel cooling system is included to handle the
sensible loads of the zone.

 Figure 11 Case 3-TRNLizard input details.

 3.5 CASE 4: NATURAL VENTILATION AND
 MEMBRANE SYSTEM
 Case 4 was set up to represent and simulate
 the usage of natural ventilation and the membrane
 system to dehumidify the outdoor air. This case is
 created to analyse the Predicted Mean Vote (PMV)
 in the zone against, Case3, using natural ventilation
Figure 9 CASE 2: DOAS System and 2-Stage Vacuum alone.
Based Membrane Dehumidification system setup. Case 4 TRNLizard input set ups are the
 following:
 Case 2 TRNLizard input setups are the
following:
CASE 2 NATVENT+ Membrane + Additional Cooling:ON
 Mechanical Ventilation: AHU
 OrPersonRelatedVolumeFlow: 36 [m³/h]
 SupplyTempWinterOcc Tamb
 SupplyTempWinterUnOcc Tamb
 SupplyTempSummerOcc Tamb
 SupplyTempSummerUnOcc Tamb
 MaxSupplyAirHumidity X_amb_50RH_kg
 SpecFanPower 0.50 [W/(m³/h)]
 UserEquation for Mem+Vacuum ON
 SensibleHeatRecovery 0%
 LatentHeatRecovery 0%
 Cooling_SetTemperature 26 DEG
 MaxSpecCoolPower 100 [W/m²] Figure 12 Case 4-TRNLizard input details.
 Figure 10 Case 2-TRNLizard input details.
Transsolar Academy 7 (2020-2021)
 Final Project Report

4. RESULTS AND CONCLUSIONS The additional cooling power of the zone to
 4.1 ENERGY DEMAND cool from set point temperature to dew point
 In this study, we analysed and compare the temperature (Q_ahu_dh_cl_A1), indicates a 100%
energy demand of Cases 1 and 2. More specifically, decrease in the Case 2 system. Meaning that
by comparing the results of the following additional dehumidification power is not necessary
TRNLizard outputs: in Case 2.
 1. Q_ahu_sen_dh_ht_A1: sensible heating Regarding the fan energy demand, as expected
 power (after dehumidification to achieve the Case 2 system configuration requires higher
 set point temperature). fan energy demand. The results show a 39%
 2. Q_ahu_lat_hu_A1: latent heating power increase in fan electricity usage in the zone.
 for AHU to control humidity of supply air. Fan Energy Demand Comparison_La Lima, HN
 3. Q_tot_ht_A1: Total heating power of air 1.00
 node. 0.90
 0.80
 4. Q_cool_A1: Total sensible cooling power of 0.70

 air node (from ideal cooling component). 0.60

 kWh/m2
 0.50
 5. Q_ahu_sen_cl_A1 sensible cooling power 0.40

 to achieve set point temperature of supply 0.30
 0.20
 air. 0.10

 6. Q_ahu_dh_cl_A1: cooling power to control 0.00
 kWh/m2

 humidity of supply air. CASE 1
 CASE 2
 0.67
 0.93
 7. Q_tot_cl_A1 total cooling power of air
 Figure 14 Fan Energy CASE 1 and CASE 2 Comparison for
 node (sensible-latent cooling ideal cooling,
 La Lima, Honduras.
 sensible-latent cooling of AHU, sensible
 cooling after dehumidification for AHU, Finally, the total sensible cooling power in the
 active layer.) airnode is 8.09% lower in the DOAS_Membrane
 8. Q_ahu_el_A1: electricity usage of fans system.
 AHU. For Miami’s climate, Figure 15, in Case 2, the
 For the Honduran climate, Figure 13, in Case 2 the sensible heating power results indicate a
the supply air is Ambient Temperature, the sensible heating power of 0.00kWh/m2 for the
sensible heating power (Q_ahu_sen_dh_ht_A1) DOAS System. This is a decrease of 100% in
results indicate a sensible heating power of comparison with the 0.11 kWh/m2 required by the
0.00kWh/m2 for the DOAS System. This is a DOAS_Membrane System.
decrease of 100% in comparison with the 0.22
kWh/m2 required by the DOAS_Membrane
System.
 The total sensible cooling power in the air
node/zone (Q_cool_A1) is 32 % higher for Case 2.
Meaning that the ideal cooling component has a
higher sensible load since in Case 2, since the Air
Handling unit is not preconditioning the supply air.

 Figure 15 Energy Demand CASE 1 and CASE 2
 Comparison for Miami.

 The total sensible cooling power in the air
 node/zone (Q_cool_A1) is 38% higher for Case 2.
 The sensible cooling power (Q_ahu_sen_cl_A1)
 is 5.95kWh/m2. The Q_ahu_dh_cl_A1 results,
 indicates a 100% decrease in the Case 2 system.
 Figure 13 Energy Demand CASE 1 and CASE 2 Meaning that additional dehumidification power is
 Comparison for La Lima. not necessary in Case 2.

 The sensible cooling power to achieve the set
point temperature of the supply air
(Q_ahu_sen_cl_A1) in Case 1 is
higher(5.99kWh/m2), since the set point is 17°C.
Transsolar Academy 7 (2020-2021)
 Final Project Report

 Although the membrane-based
 dehumidification mentioned indicated promising
 results in comparison to the regular dedicated
 outside air system, more research work (discharge
 coefficients for the membrane geometry) is
 needed to apply the membrane dehumidification
 system in other ways.
 Ideally, the membrane module should be
 incorporated into the building enveloped, to
 dehumidify the outside air before this enters the
Figure 16 Fan Energy CASE 1 and CASE 2 Comparison for space, further study in the optimization of the shoe
 Miami, USA. box model is recommended to analyse the
 performance of the membrane system along side
 Regarding the fan energy demand, as expected other passive design strategies adequate for hot
the Case 2 system configuration requires higher and humid climates.
fan energy demand. The results show a 35% 5. REFERENCES
increase in fan electricity usage in the zone. Cabrera, P. (2019). The Humid Threshold: Cooling
 Finally, the total sensible cooling power in the hot, humid climates via membrane
airnode is 8.50% lower in the DOAS_Membrane dehumidification. Harvard University Graduate
system (Case 2). School of Design.
 The results for sensible heating and cooling Chen, T. (2019). Next-Generation Dedicated
power demand denote that incorporating the 2- Outdoor Air Cooling Systems for Low-Energy
Stage Vacuum Based Membrane Dehumidification Buildings. Massachusetts Institute of Technology.
system setup alongside the DOAS system is a Clark, D. (2013). Information Paper-20:
promising alternative for low energy Ventilation rates in offices- mechanical and
dehumidification but requires further study to natural. Cundall Johnston & Partners LLP.
increase its efficiency to allow for higher Woods, J. (2014). Membrane processes for
reductions in latent loads. heating, ventilation, and air conditioning.
 4.2 COMFORT Renewable and Sustainable Energy Reviews, 290-
 For both climates, the Predicted Mean Vote 304.
results indicate that the membrane does impact Yang, B., Yuan, W., Gao, F., & Guo, B. (2015). A
the comfort level inside the zone. Its review of membrane-based air dehumidification.
dehumidification effect is more evident in the Indoor and Built Environment, 11-26.
Honduran climate where the PMV results are 1
vote lower, in Case 5.
 Comfort Analysis_ La Lima, Honduras
 CASE 3 CASE 4
 6

 5
 Predicted Mean Vote

 4

 3

 2

 1

 0

 Date

 Figure 17 PMV Results La Lima, HN

 Comfort Analysis_ Miami, USA
 CASE_3 CASE 4
 7

 6

 5
 Predicted Mean Vote

 4

 3

 2

 1

 0

 Date

 Figure 18 PMV results Miami, USA
You can also read