Oracle Banking Liquidity Management - Observability User Guide Part Number F41688-01 - Oracle Help Center
←
→
Page content transcription
If your browser does not render page correctly, please read the page content below
Observability User Guide

Oracle Banking Liquidity Management
Release 14.5.0.0.0

Part Number F41688-01

May 2021
Observability User Guide
Oracle Financial Services Software Limited
Oracle Park
Off Western Express Highway
Gurgaon (East)
Mumbai, Maharashtra 400 063
India
Worldwide Inquiries:
Phone: +91 22 6718 3000
Fax: +91 22 6718 3001
https://www.oracle.com/industries/financial-services/index.html
Copyright © 2018, 2021, Oracle and/or its affiliates. All rights reserved.
Oracle and Java are registered trademarks of Oracle and/or its affiliates. Other names may be trademarks
of their respective owners.
U.S. GOVERNMENT END USERS: Oracle programs, including any operating system, integrated software,
any programs installed on the hardware, and/or documentation, delivered to U.S. Government end users
are “commercial computer software” pursuant to the applicable Federal Acquisition Regulation and agency-
specific supplemental regulations. As such, use, duplication, disclosure, modification, and adaptation of the
programs, including any operating system, integrated software, any programs installed on the hardware,
and/or documentation, shall be subject to license terms and license restrictions applicable to the programs.
No other rights are granted to the U.S. Government.
This software or hardware is developed for general use in a variety of information management applications.
It is not developed or intended for use in any inherently dangerous applications, including applications that
may create a risk of personal injury. If you use this software or hardware in dangerous applications, then
you shall be responsible to take all appropriate failsafe, backup, redundancy, and other measures to ensure
its safe use. Oracle Corporation and its affiliates disclaim any liability for any damages caused by use of
this software or hardware in dangerous applications.
This software and related documentation are provided under a license agreement containing restrictions
on use and disclosure and are protected by intellectual property laws. Except as expressly permitted in
your license agreement or allowed by law, you may not use, copy, reproduce, translate, broadcast, modify,
license, transmit, distribute, exhibit, perform, publish or display any part, in any form, or by any means.
Reverse engineering, disassembly, or decompilation of this software, unless required by law for
interoperability, is prohibited. The information contained herein is subject to change without notice and is
not warranted to be error-free. If you find any errors, please report them to us in writing.
This software or hardware and documentation may provide access to or information on content, products
and services from third parties. Oracle Corporation and its affiliates are not responsible for and expressly
disclaim all warranties of any kind with respect to third-party content, products, and services. Oracle
Corporation and its affiliates will not be responsible for any loss, costs, or damages incurred due to your
access to or use of third-party content, products, or services.
Contents
1     Introduction ............................................................................................................. 1
    1.1     About this Guide ............................................................................................................................ 1
    1.2     Audience ....................................................................................................................................... 1
    1.3     Document Accessibility ................................................................................................................. 1
    1.4     List of Topics ................................................................................................................................. 1
    1.5     Prerequisites ................................................................................................................................. 2
    1.6     General Prevention ....................................................................................................................... 2
    1.7     Best Practices ............................................................................................................................... 2
2     Observability Improvements using Zipkin Traces ............................................... 3
    2.1     Setting Zipkin Server ..................................................................................................................... 3
    2.2     Login to Zipkin ............................................................................................................................... 3
    2.3     Zipkin Issues ................................................................................................................................. 7
      2.3.1        Application Service is not Registered.................................................................................... 7
3     Observability Improvements Logs using ELK Stack ......................................... 10
    3.1     Setting up ELK ............................................................................................................................ 10
      3.1.1        Steps to run ELK ................................................................................................................. 10
      3.1.2        Accessing Kibana ................................................................................................................ 12
      3.1.3        Steps to setup dynamic log levels in OBMA services without restart ................................. 12
      3.1.4        Searching for Logs in Kibana .............................................................................................. 13
      3.1.5        How to Export Logs for Tickets ........................................................................................... 13
4     Troubleshooting Kafka Issues............................................................................. 14
    4.1     Kafka Health ................................................................................................................................ 14
      4.1.1        Verifying Kafka Health ......................................................................................................... 14
      4.1.2        Verify Zookeeper Health ..................................................................................................... 14
    4.2     Prometheus and Grafana ............................................................................................................ 14
      4.2.1        Prometheus Setup............................................................................................................... 14
      4.2.2        JMX-Exporter Setup ............................................................................................................ 14
      4.2.3        Grafana Setup ..................................................................................................................... 15
      4.2.4        Prometheus Metrics ............................................................................................................ 15
5     Troubleshooting Flyway issues .......................................................................... 16
    5.1     Failed Migrations ......................................................................................................................... 16
      5.1.1        Success Column Verification .............................................................................................. 16
      5.1.2        Migration Checksum Mismatch for a Version ..................................................................... 16
      5.1.3        Placeholder errors ............................................................................................................... 16
6     Appendix A: Acronyms, Abbreviations, and Definitions .................................. 17
7     Appendix B: Related Documentation.................................................................. 18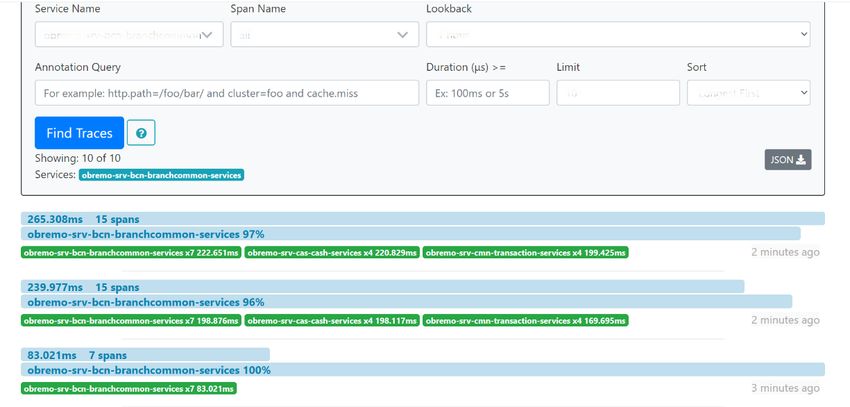
Observability User Guide

1 Introduction
 1.1 About this Guide
      This guide helps to use the tools that enable users to observe the Oracle Banking Microservices
      architecture (OBMA) suite of products better. The sections provide tools that can enable a user to:

      1. Observe the spans associated with various API calls and the response of each API.

      2. Troubleshoot Kafka better.

      3. Aggregate logs and interpret out of log searches.

      The guide also describes recommended tools to enhance monitoring and observability aspects of the
      OBMA products.

 1.2 Audience
      This guide is intended for the implementation teams.

 1.3 Document Accessibility
      For information about Oracle's commitment to accessibility, visit the Oracle Accessibility Program
      website at http://www.oracle.com/pls/topic/lookup?ctx=acc&id=docacc.

 1.4 List of Topics
      This manual is organized into the following topics:

      Table 1: List of Topics

                 Chapter                                             Description

        Observability Improvements     This topic explains the possible ways and benefits of using tools like
        using Zipkin Traces            Zipkin to enhance troubleshooting possibilities.

        Observability Improvements     This topic explains the possible log aggregation and search features that
        Logs using ELK Stack           can be availed using ELK stack.

        Troubleshooting Kafka          This topic explains the steps to troubleshoot basic issues in Kafka.
        Issues

Copyright @ 2018, 2021                                      1
All Rights Reserved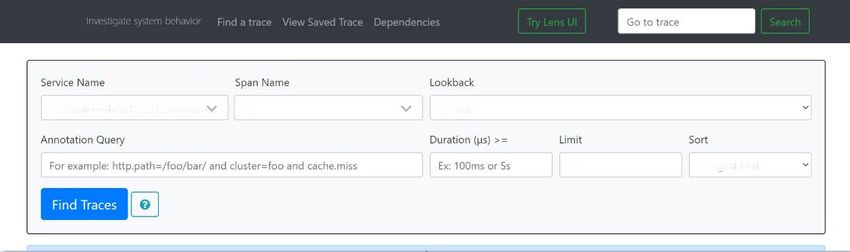
Observability User Guide

                 Chapter                                                Description

        Troubleshooting Flyway            This topic explains the steps to troubleshoot Flyway issues during
        Issues                            deployment.

        Acronyms, Abbreviations,          This topic provides Acronyms, abbreviations, and their definitions.
        and Definitions

        Related Documentation             This topic provides the related documentation.

 1.5 Prerequisites
      The prerequisites are as follows:

        •   Basic understanding of Eventing platform.

        •   Basic understanding application log analysis using tools.

        •   Basic understanding DB changes.

 1.6 General Prevention
      Do not make any changes to Flyway scripts manually.

 1.7 Best Practices
      The best practices are as follows:

        •   It is ideal to have ELK stack installed on a separate VM outside the product VMs to ensure flow of
            logs in case of app crash.

        •   Log levels can be adjusted to INFO and above to enable relevant logs to flow in.

        •   Verify all Kafka settings as per User Troubleshooting Guide before the health check.

Copyright @ 2018, 2021                                     2
All Rights Reserved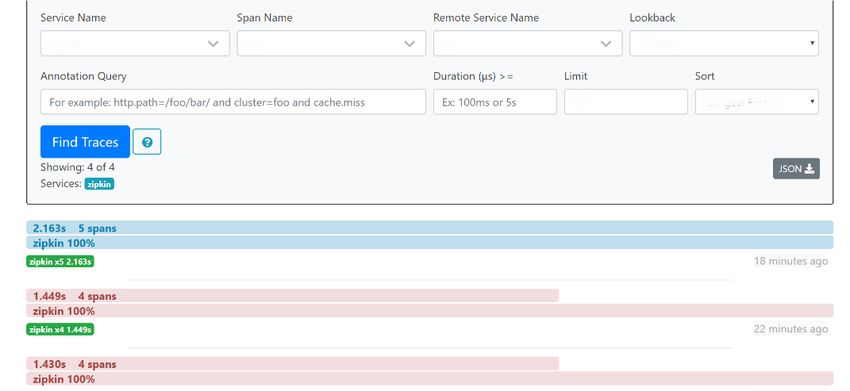
Observability User Guide

2 Observability Improvements using Zipkin Traces
    This section describes the troubleshooting procedures using the Zipkin Traces.

 2.1 Setting Zipkin Server
       Refer to below link for the document describes the installation of Zipkin:

       https://docs.oracle.com/cd/F37097_01/PDF/Installation_Guide/ANNEXURE-2.pdf

 2.2 Login to Zipkin
       Perform the following steps for the troubleshooting using Zipkin Traces:

       1. Launch the Zipkin URL.

           NOTE: The basic layout of Zipkin is shown in Figure 1.

           Figure 1: Layout of Zipkin

Copyright @ 2018, 2021                                     3
All Rights Reserved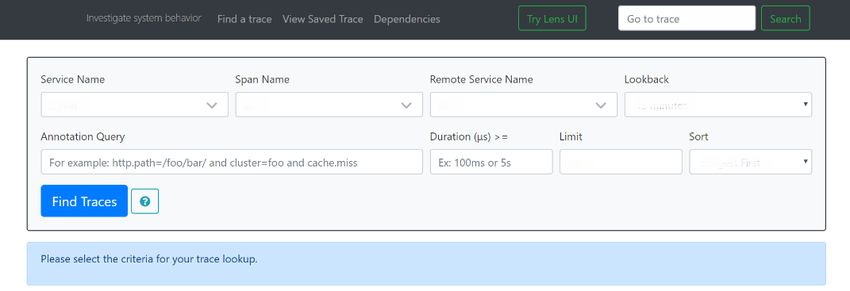
Observability User Guide

      2. Use the search option to find the traces of required API calls and services.

          NOTE: The search options given in the user interface are self-explanatory, and there is another UI
                   option (Try Lens UI). It is given a different user interface with the same functionality. The list
                   of the traces can be seen as shown in Figure 2. Error API calls are made to showcase how
                   to track errors. The blue listings show the successful API hits, and the red listings indicate
                   errors. Each block indicates a single trace in the listings.
          Figure 2: List of Traces

      3. Open the individual trace to the details of the trace.

          NOTE: Figure 3 shows an individual trace when it is opened. It also describes the time taken for
                   each block. As the two custom spans are created inside two service calls, you can find a
                   total of four blocks. The time taken for an individual block can be seen in Figure 3.

          Figure 3: Individual Trace

Copyright @ 2018, 2021                                     4
All Rights Reserved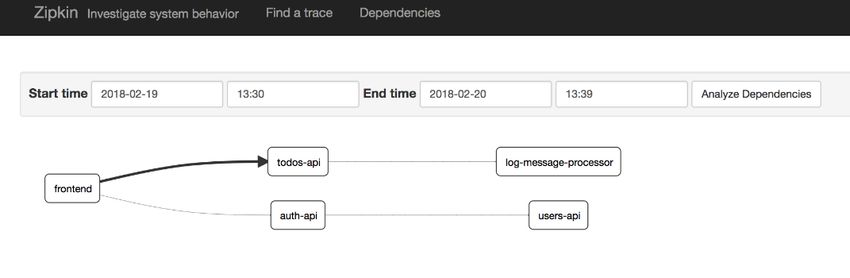
Observability User Guide
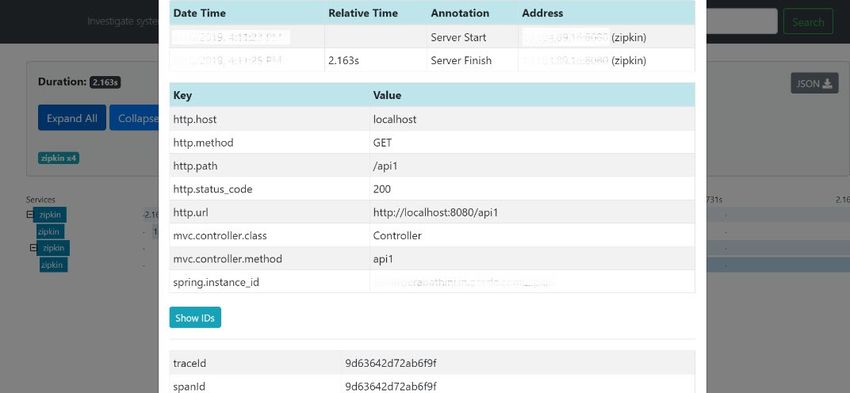
4. Click an individual block to display the details.
Figure 4: Details of Individual Block
NOTE: The details of the specific span block are shown in Figure 4 and the logging events can
also be seen in the Zipkin UI as small circular blocks. An example of an error log is shown
in Figure 5.
Figure 5: Sample Error Log
Copyright @ 2018, 2021 5
All Rights Reserved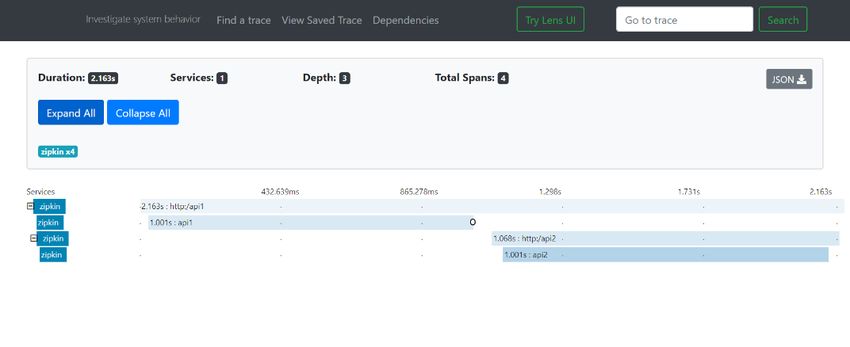
Observability User Guide
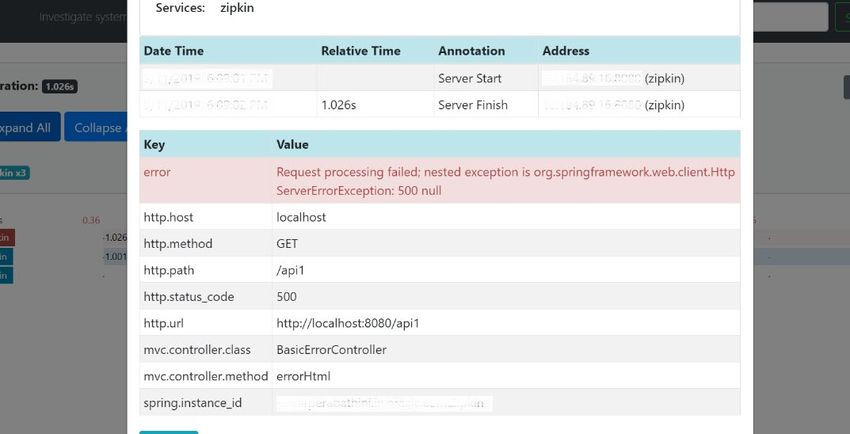
5. Click on the error portion to get a clear detail about the error, and where the error has arisen. An
example is shown in Figure 6.
Figure 6: Details of Error
NOTE: If the Lens UI is used in Zipkin, the above Figures are not applicable but are relatable to the
Lens UI as well. Traces of the application can be found using TraceId. The TraceId can be
found in the debug logs of the deployment when spring-cloud-sleuth is included in the
dependencies (included in spring-cloud-starter-zipkin dependency).
6. Click Dependencies tab to get the dependency graph info between micro-services. An example
dependency graph is shown in Figure 7.
Figure 7: Sample Dependency Graph
Copyright @ 2018, 2021 6
All Rights Reserved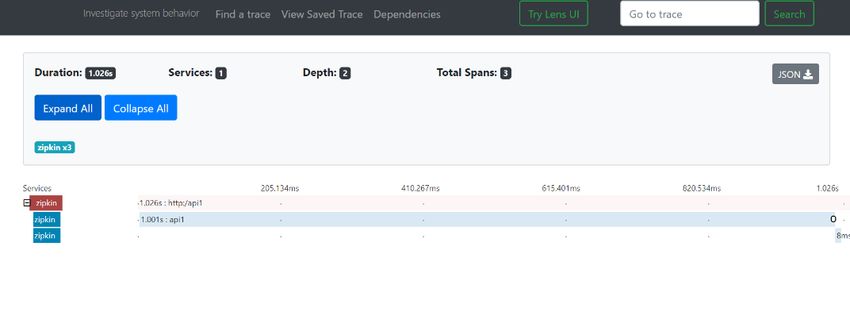
Observability User Guide
2.3 Zipkin Issues
2.3.1 Application Service is not Registered
Perform the following steps to find the cause of this error:
1. Check the applications, which are sending the trace report to Zipkin server from Service Name
drop-down list.
Figure 8: Find Traces
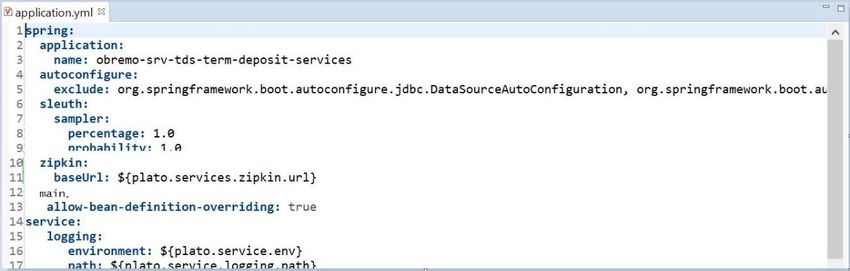
2. If the required application is not listed in Zipkins, check the application.yml file for Zipkin base
URL configuration.
Figure 9: Application.yml File
NOTE: The shipped application.yml should have the Zipkin entry. Every service should have
spring-cloud-sleuth-zipkin dependency added in build gradle file for the service to
generate and send trace Id and span Id.
3. The necessary values are as follows:
Compile group: 'org.springframework.cloud'
name: 'spring-cloud-sleuth-zipkin'
version: '2.1.2.RELEASE'
Copyright @ 2018, 2021 7
All Rights ReservedObservability User Guide
Figure 10: Branch Common Services
Figure 11: Branch Common Services Trace
2.3.1.1 404 Error
If there is 404 error, check if the zipkin-server.jar is running in the system where the
application is deployed. To check this, execute the following command:
netstat -ltnup | grep ':9411'
Output should be like:
tcp6 0 0 :::9411 :::* LISTEN 10892/java
Here 10892 is the PID.
Copyright @ 2018, 2021 8
All Rights ReservedObservability User Guide
2.3.1.2 Unable to Change Zipkin Default Port Number
Zipkin default port number is not editable. Hence, make sure that the port 9411 is available to
start Zipkin-server.jar file.
Copyright @ 2018, 2021 9
All Rights ReservedObservability User Guide
3 Observability Improvements Logs using ELK Stack
This section describes the troubleshooting procedures using the ELK Stack.
3.1 Setting up ELK
Perform the following steps:
1. Download the Elastic search from https://www.elastic.co/downloads/elasticsearch.
2. Download the Kibana from https://www.elastic.co/downloads/kibana.
3. Download the Logstash from https://www.elastic.co/downloads/logstash.
Figure 12: ELK Setup
NOTE: Default port for Elastic search is 9200, and the default port for Kibana: 5601.
3.1.1 Steps to run ELK
Perform the following steps:
1. Run the elasticsearch.sh file present in the folder path /scratch/software/ELK/elasticsearch-
6.5.1/bin.
2. Configure Kibana to point the running instance of elastic search in kibana.yml file.
Copyright @ 2018, 2021 10
All Rights ReservedObservability User Guide
3. Configuration of Logstash consists of the following steps:
a) Input- This configuration is required to provide the log file location for the Logstash to read
from.
b) Filter- Filters in Logstash is basically used to control or format the read operation (Line by
line or Bulk read)
c) Output- In this section, provide the running elastic search instance to send the data for
persisting.
Figure 13: Logstash Configuration
Copyright @ 2018, 2021 11
All Rights ReservedObservability User Guide
3.1.2 Accessing Kibana
The Kibana can be accessed as shown below:
Figure 14: Accessing Kibana
3.1.3 Steps to setup dynamic log levels in OBMA services without restart
The plato-logging-service is dependent on two tables, which needs to be present in the PLATO
schema (JNDI name: jdbc/PLATO). The two tables are as follows:
• PLATO_DEBUG_USERS: This table contains the information about whether the dynamic
logging will be enabled to a user for a service. The table will have records, where
DEBUG_ENABLED values for a user and a service have values Y or N, and depending on
that plato-logger will enable dynamic logging.
Figure 15: PLATO_DEBUG_USERS
Copyright @ 2018, 2021 12
All Rights ReservedObservability User Guide
• PLATO_LOGGER_PARAM_CONFIG: This table contains the key-value entries of different
parameters that can be changed at runtime for the dynamic logging.
Figure 16: PLATO_LOGGER_PARAM_CONFIG
The values that can be passed are as follows:
• LOG_PATH: This will specify a dynamic logging path for the logging files to be stored.
Changing this in runtime will change the location of the log files at runtime. If this value is not
passed then by default, the LOG_PATH value will be taken from the -D parameter of
plato.service.logging.path.
• LOG_LEVEL: The level of the logging can be specified on runtime as INFO or ERROR etc.
The default value of this can be set in the logback.xml.
• LOG_MSG_WITH_TIME: Making this Y will append the current date into the log file name.
Setting the value of this as N will not append the current date into the filename.
3.1.4 Searching for Logs in Kibana
The URL for searching logs in Kibana is https://www.elastic.co/guide/en/kibana/current/search.html.
3.1.5 How to Export Logs for Tickets
Perform the following steps to export logs:
1. Click Share from the top menu bar.
2. Select the CSV Reports option.
3. Click Generate CSV button.
Copyright @ 2018, 2021 13
All Rights ReservedObservability User Guide
4 Troubleshooting Kafka Issues
This section describes the troubleshooting procedures for the Kafka issues.
4.1 Kafka Health
4.1.1 Verifying Kafka Health
Run the below command and verify:
$ netstat -tlnp | grep :9092 (9092 is default port of kafka)
4.1.2 Verify Zookeeper Health
Kafka instance will not start if Zookeeper is not yet started. Run the below command and verify:
$ netstat -tlnp | grep :2181 (2181 is default port of zookeeper)
tcp6 0 0 :::2181 :::* LISTEN 19936/java
To debug, check if the permissions of Kafka log folder are correct. The log folder path can be found
by looking at the value of the property “log.dirs” in the server.properties file of Kafka installation.
4.2 Prometheus and Grafana
4.2.1 Prometheus Setup
Prometheus is an open-source project, which helps monitoring of the applications metrics. It is widely
used for the monitoring of Kafka and its metrics. The installer for Prometheus can be downloaded
Prometheus from https://prometheus.io/download/.
4.2.2 JMX-Exporter Setup
A JMX-Exporter application is used to integrate with the Kafka broker as a Java agent to expose the
values of JMX MBeans as an API. The JMX-Exporter is used by the Prometheus to fetch the values
of the JMX metrics. Perform the following steps:
1. Download the latest jmx_prometheus_javaagent jar file from the maven repository in the Kafka
directory along with the bin, config directories.
NOTE: This can be used to monitor consumer_lag.
https://repo1.maven.org/maven2/io/prometheus/jmx/jmx_prometheus_javaagent/0.15.0/j
mx_prometheus_javaagent-0.15.0.jar
Copyright @ 2018, 2021 14
All Rights ReservedObservability User Guide
2. Set the KAFKA_OPTS variable to the desired value to execute the jar as a java agent.
export KAFKA_OPTS="$KAFKA_OPTS -javaagent:$PWD/jmx_prometheus_javaagent-
0.15.0.jar=7071:$PWD/kafka-0-8-2.yml"
NOTE: You can choose the port according to our preference.
3. Restart Kafka Broker.
4.2.3 Grafana Setup
Perform the following steps:
1. Download Grafana from https://grafana.com/grafana/download in the stand-alone application
mode, and extract its contents.
2. Go to the bin folder in the extracted contents, and start the Grafana server.
NOTE: Grafana should start on the default port 3000 (HOST: 3000). The default user and
password for Grafana are admin/admin.
Perform the following steps to integrate Grafana with the Prometheus instance installed:
1. Click on the Grafana logo to open the sidebar.
2. Click Data Sources in the sidebar.
3. Choose Add New.
4. Select Prometheus as the data source.
5. Click Add to test the connection and to save the new data source.
4.2.4 Prometheus Metrics
The Prometheus Metrics are as follows:
• process_cpu_seconds_total
• http_request_duration_seconds
• node_memory_usage_bytes
• http_requests_total
• process_cpu_seconds_total
Copyright @ 2018, 2021 15
All Rights ReservedObservability User Guide
5 Troubleshooting Flyway issues
This section describes the troubleshooting procedures for the flyway issues.
5.1 Failed Migrations
5.1.1 Success Column Verification
Perform the following steps for the success column verification:
1. Check the flyway_schema_history table to identify the migration record with success column as
‘0’.
2. Delete the record with status as ‘0’.
3. Restart deployment.
5.1.2 Migration Checksum Mismatch for a Version
Perform the following steps:
1. Make sure that the flyway script is not manually updated before deployment.
2. If yes, then replace with original and restart deployment.
5.1.3 Placeholder errors
Pass the placeholder values using setUserOverrides.sh in Weblogic. Alternatively, these issues can
be debugged from Weblogic console during deployment. In addition, the application specific logs can
be verified for further inputs.
Copyright @ 2018, 2021 16
All Rights ReservedObservability User Guide
6 Appendix A: Acronyms, Abbreviations, and Definitions
The following acronyms/abbreviations are used in this guide:
Table 2: Acronyms and Abbreviations
Acronyms Definition
API Application Programming Interface
ELK Elasticsearch Logstash Kibana
OBMA Oracle Banking Micro Service Architecture
UI User Interface
URL Uniform Resource Locator
Copyright @ 2018, 2021 17
All Rights ReservedObservability User Guide
7 Appendix B: Related Documentation
The related documentation are as follows:
• Getting Started User Guide
• Troubleshooting Guide
Copyright @ 2018, 2021 18
All Rights ReservedYou can also read