Next generation AO system of Subaru Telescope
←
→
Page content transcription
If your browser does not render page correctly, please read the page content below
Next generation AO system of Subaru Telescope

Yutaka Hayano1a , Masayuki Akiyama2 , Takashi Hattori1 , Ikuru Iwata1 , Tadayuki Kodama1 , Yosuke
Minowa1 , Kentaro Motohara3 , Tetsuo Nishimura1 , Nagayoshi Ohashi1 , Yoshito Ohno2 , Shin Oya1 ,
Mai Shirahata1 , Hideki Takami1 , Naruhisa Takato1 , Naoyuki Tamura4 , Ichi Tanaka1 , Hiroshi Terada1 ,
Daigo Tomono1 , and Tomonori Usuda1
1
    Subaru Telescope, National Astronomical Observatory of Japan, 650 North A’ohoku Place, Hilo HI
    96720 USA
2
    Astronomical Institute, Tohoku University, 6-3 Aramaki Aoba-ku Sendai 980-8578 Japan
3
    Institute of Astronomy, The University of Tokyo, 2-21-1 Osawa, Mitaka, Tokyo 181-0015 Japan
4
    Institute for the Physics and Mathematics of the Universe, Kashiwa, Chiba Japan

Abstract. Conceptual and feasibility studies of wide field AO systems for Subaru Telescope has been started as
a next generation AO system. Since optical wide field imager, named Hyper Supreme Camera, and multi object
fiber-fed spectrograph, named Prime Focus Spectrograph, are currently under developing for a primary focus of
Subaru Telescope, a wide field imager and spectrograph at near infrared wavelength range with adaptive optics
at Cassegrain or Nasmyth foci must be a complemental instrument in the next future. In this paper, preliminary
performance simulation studies of GLAO and MOAO and science case study in imaging and spectrograph are
introduced. A GLAO simulation tells us that stellar image size is almost uniform up to 20 arcmin FOV. We
found that a number of tip-tilt guide star and its constellation is closely related to the performance of MOAO.
Imaging sensitivity gain is expected about 0.5 magnitude for the point source and 0.3 to 0.4 magnitude for compact
galaxies, whose effective radius is smaller than 3 kpcs at the redshift around 2. On the other hand, the analysis of
a spectroscopy observation to investigate kinematics of high redshift galaxies seems to be not easy using GLAO.

1 Introduction

We have been developed two AO system for Subaru Telescope. The first generation AO was curvature
based AO system with 36 elements at Cassegrain focus (AO36). This system has been commissioned
in 2001 and decommissioned in 2008. The second generation AO is also curvature based system with
188 elements at Nasmyth focus. This system has single laser guide star capability. The engineering
first light was successfully done in 2006 and start science operation with natural guide star in 2008,
with laser guide star in 2011.
     Subaru Advisory Committee has defined four candidates of future instruments for Subaru Tele-
scope in 2009. These are; (1) wide-field multi-object spectrograph, (2) wide-field near infrared camera,
(3) multi-object and integral field spectrograph assisted by AO, (4) new mid infrared instrument. The
first candidate of future instrument is currently formed a project of multi object fiber-fed spectrograph
at prime focus, named Prime Focus Spectrograph, formerly knows as WFMOS concept. The second
and third candidates of future instrument has been started to discussed among a researcher group at
Subaru Telescope, National Astronomical Observatory of Japan, and astronomy community in Japan
since 2009. The working group for a next generation AO at Subaru Telescope has formed at the be-
ginning of the year of 2011. The major keyword for a next generation AO is set as wide field AO.
The working group organized a workshop of next generation AO in September, 2011. The expected
performance of GLAO and MOAO and benefits of GLAO in extragalactic science around the redshift
of 1 to 3 are introduced. Further, contributed talks on science cases are presented. In this paper, the
results of performance simulation of GLAO and MOAO, the performance gain of GLAO in imaging
and spectrograph, and the case studies of GLAO for high-z galaxies are introduced.

    a
        hayano@naoj.org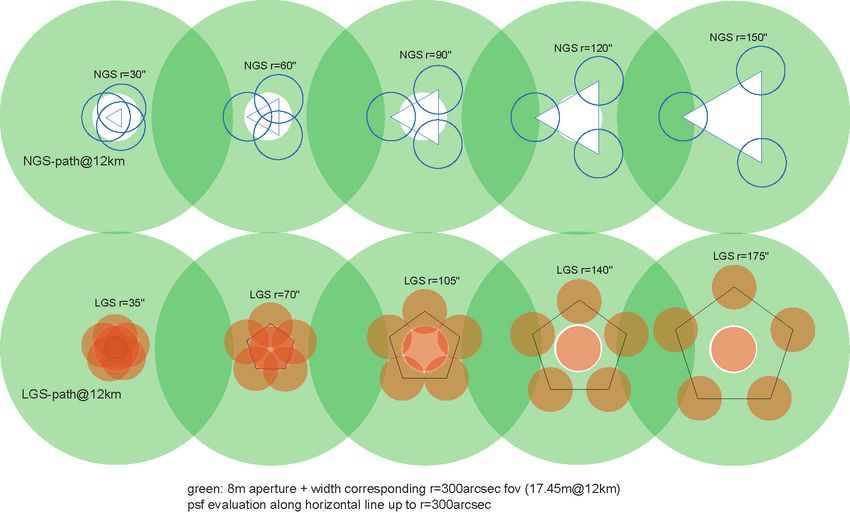
AO for ELT II

2 AO simulation study

2.1 Atmosphere model

We use an atmospheric turbulence model at the site of Subaru Telescope developed by RAVEN
project[1][2]. Multi-layer profile is referred to the data of MASS/DIMM measurement of TMT site
at Mauna Kea (MK13N) [3]. On the over hand, the image quality at Subaru has been measured since
2000. Table. 1 shows the quartiles in image quality and the Fried’s parameter, r0 , which assumed an
finite outer scale. The values, r0 , at Subaru Telescope are smaller than the TMT site testing. The differ-
ences can be interpreted due to a local ground layer, wind shake, and dome seeing. Finally, multi-layer
profile at Subaru Telescope are modeled by combining the data from seeing statistics at Subaru and
TMT site testing shown in Table. 2 We refer a probability of having a image quality at 25% as a good
seeing, at 50% as a moderate seeing, and at 75% as a bad seeing hereafter.

                           Table 1. Image quality statistics at Subaru Telescope.
                                   Quartile     Seeing (arcsec)   r0 (cm)
                                   ?25%         0.52              19.4
                                   50%          0.65              15.6
                                   75%          0.84              12.1

                                     Table 2. Model profile at Subaru.
                            Layer height (km)                Fraction
                            Quartile              25%        50%         75%
                            r0                    19.4 cm    15.6 cm     12.1 cm
                            0                     0.6823     0.5960      0.4971
                            0.5                   0.0611     0.0963      0.1382
                            1                     0.0212     0.0325      0.0577
                            2                     0.0172     0.0372      0.0642
                            4                     0.0757     0.0869      0.0833
                            8                     0.0486     0.0684      0.0895
                            16                    0.0939     0.0826      0.0700

2.2 GLAO simulation

The strength of Subaru Telescope is its wide field instrument lineup. Therefore, GLAO would be the
best AO system for future, in term of synergy of wide field imaging and spectrograph at the primary
focus. In this section, we introduce the preliminary result of GLAO simulation. Simplified simulation
of GLAO is firstly conducted to obtain a rough knowledge of characteristics of GLAO performance.
Figure. 1 shows a guide star location and field position where the PSF of the star evaluated. To make
the simulation simple, four natural guide stars are located 90 degrees apart on a circle (Yellow stars
in Figure. 1). Three radiuses are chosen as 5 arcmin, 7.5 arcmin, and 10 arcmin. We assume that the
deformable mirror has 32 actuators across one side of the line, namely it has about 1000 actuators in
total. The deformable mirror is conjugated at the ground, not at the secondary mirror position. Red
squares and triangles in Figure. 1 shows the locations of evaluating the point spread function of the
images.
    Figure. 2 shows a wavefront error at the PSF evaluation points. Horizontal axes are normalized by
the radius of guide star position. Plots shows a different seeing conditions, good, moderate, and bad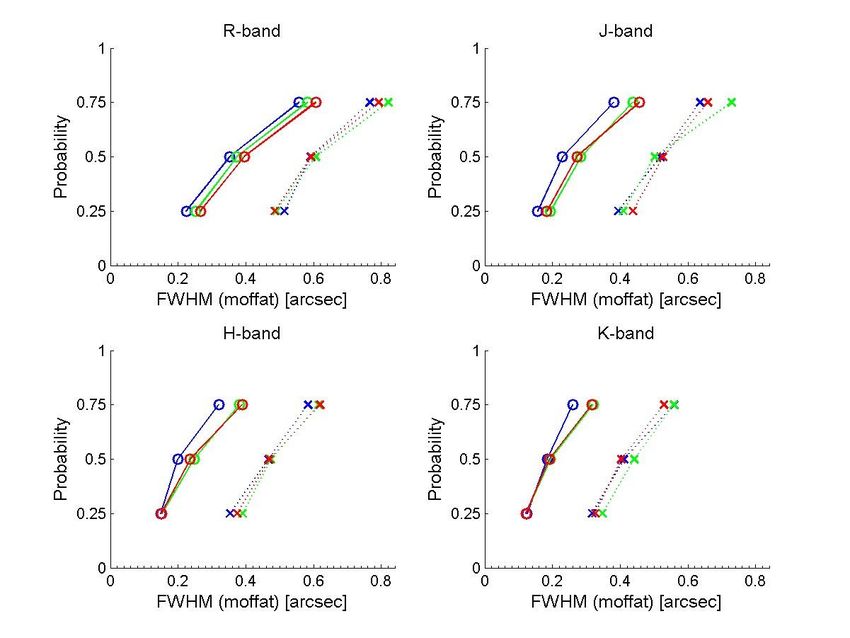
Yutaka Hayano et al.: Next generation AO system of Subaru Telescope
!"#$%&'(%#)*+,#-./012%('31./#
1";"95" 67!"JK"*=.,"*=1/BB"
EFGH#"B((95:!"
I !""#$%&'()*%+"
I ,"#-./0-$%&'1(*%"
I 2/#$%&'34*"
@"1(=/5B.1C=.9/5"+*D(1"-A>3"
!!"#$%"
"!"&%'"()*+,-./0*12"$%3#!"-4(.0((5"$%3"
$!"67"89..95:"
Fig. 1. Guide star configuration of GLAO.
from the left to right. Square and triangle symbols are correspond to the that of in the Figure. 1. Dotted
lines express a wavefront error at the seeing condition. The guide stars location in radiuses, 5 arcmin,
7.5 arcmin, and 10 arcmin, are distinguished by the color as blue, green, and red, respectively.
The wavefront error from the field center towards to the guide star location does not increased for
all seeing condition as well as all radiuses, where guide stars are located. This results encourage us
that we can extend the field of view of GLAO system up to 20 arcmin for Subaru Telescope, however,
we have to interpret carefully this preliminary result and we need more detail analysis with much more
realistic GLAO simulation, which takes into account the other error sources.
Next we evaluate the FWHM size of the PSF as a function of seeing condition and wavelength
band of R, J, H, and K. The horizontal axes of Figure. 3 express FWHM size of the PSF, fitted by
moffat function in arcse. Vertical axes are the probability of seeing, which corresponds to the good,
moderate, and bad condition. Both on and off of GLAO correction are express by the symbol of crosses
and open circles respectively. Same as Figure. 2, color indicate the guide stars location in radiuses, 5
arcmin, 7.5 arcmin, and 10 arcmin.
One can find that FWHM at 0.2 arcsec are obtained in 50 % probability in H-band and K-band,
and image size around 0.3 arcsec is also achievable in R-band. The image size under the condition of
bad seeing using GLAO is comparable to the image size under the good seeing without using GLAO.
In other words, GLAO always realizes a good natural seeing condition.
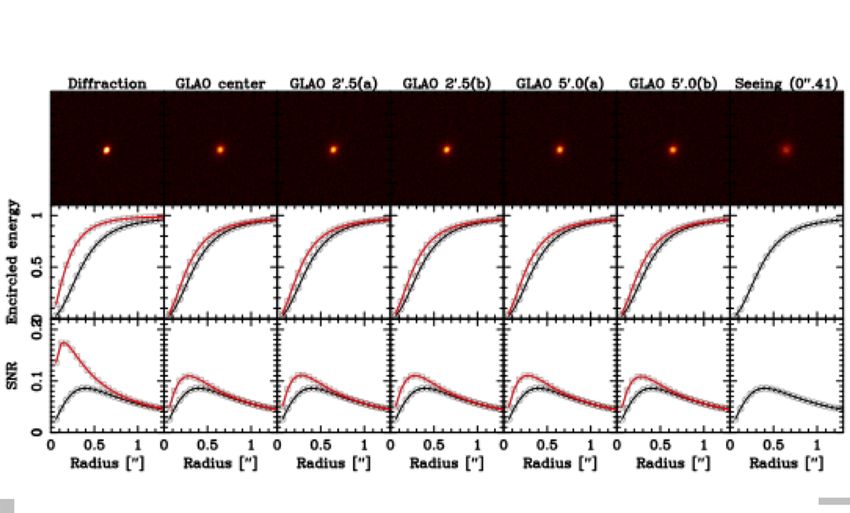
To evaluate the efficiency of spectroscopy, the encircled or ensquared energy of the flux is a good
measure. Figure. 4 plots a ratio of ensquared energy of GLAO to that of seeing condition at each
spectral band. The guide star located at the radius of 7.5 arcmin. The sizes of the square are 0.24
arcmin, 0.36 arcsec, and 0.48 arcsec, respectively, colored by blue, green and red. Horizontal axes
shows a seeing size, thus, three conditions, good, moderate, and bad, are plotted.
The square size of 0.24 arcsec has a larger gain in ensquared energy. The gains do not vary at
K-band, even though it is under bad seeing condition, however, the gain in ensquared energy becomes
high under the good seeing condition in the shorter wavelength.
2.3 MOAO simulation
RAVEN, the MOAO demonstrator at Subaru Telescope, is one of the path to the next future AO system.
Presumably RAVEN is a path finder to the MOAO system toward the extreme large telescope. In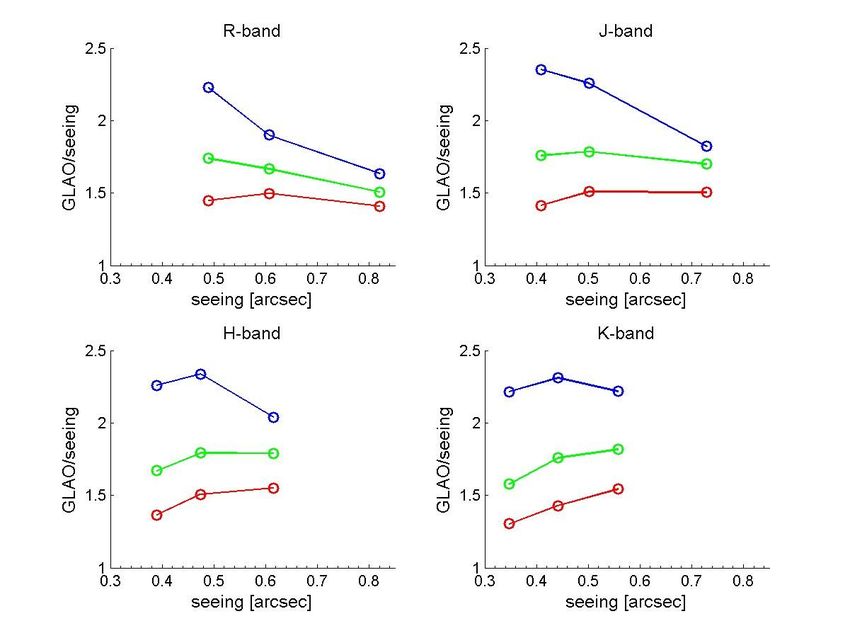
AO for ELT II

                                  Fig. 2. Wavefront error across the FOV.

                     !"#$%&'()$! *+,-./012!3.))2$! *+4-./012!.)5$! *6,-./012%
                     789"$%"!%:))123$#%
                                  Fig. 3. FWHM improvement of GLAO.

this section, baseline study for a performance of MOAO system at Subaru Telescope is introduced.
Figure. 5 shows 5 different sets of MOAO guide star constellations from left to right. It shows cross
section views of field of regards in green (both top and bottom), natural guide stars beam in blue circle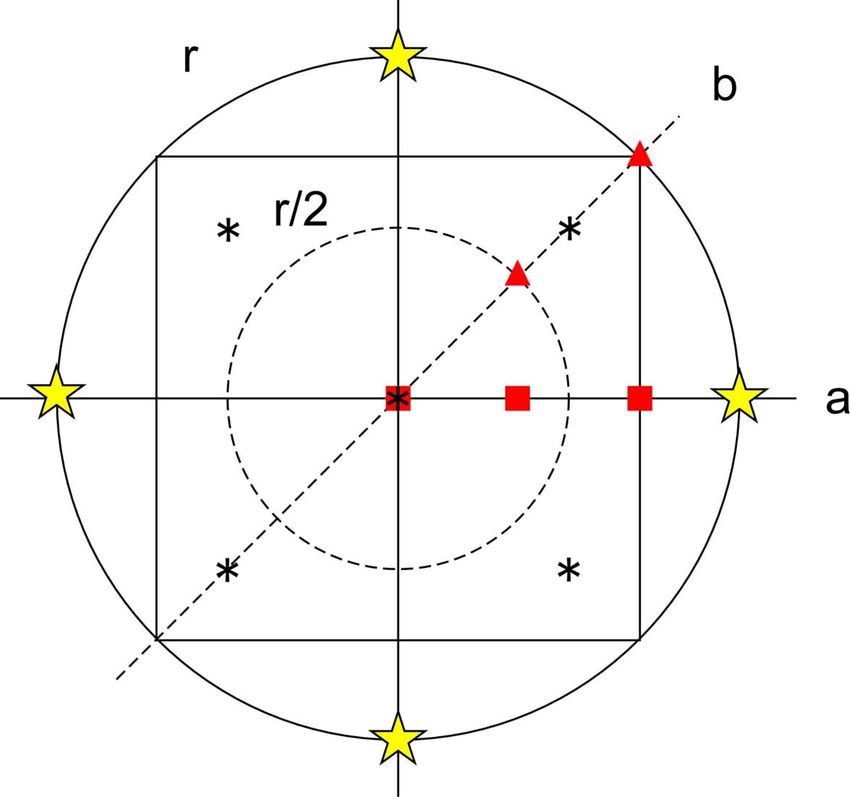
Yutaka Hayano et al.: Next generation AO system of Subaru Telescope

                       !"#$%&'()*+&',-./0!12++3&',-450!2+#&',-/60'
                                                                           &'?@A'!'
                       789:&'"!;++"31&'
                       Fig. 4. Ratio of ensquared energy of GLAO to seeing condition.

(top), and laser guide stars beam in orange filled circle (bottom) at the altitude of 12 km. Three natural
guide star and six laser guide stars are considered in this simulation. The location radius of natural
guide stars varies from constellation set 1 to 5 as 30, 60, 90, 120, and 150 arcsec, respectively. One
laser guide star is located at the center of the field of regards and the rest of five laser guide stars are
located at the radius of 35, 70, 105, 140, and 175 arcsec.
    The wavefront error across the line of field of regards from right to left in the Figure. 5 are plotted
in Figure. 6. Filled square shows a total wavefront error, and open square shows a tip-tilt removed
wavefront error. The tip-tilt error is expressed by the cross symbol. The wavefront error at 240nm rms
corresponds to Strehl ratio at 0.2 at J-band, and 350nm rms corresponds to Strehl ratio at 0.4 at K-
band. Those are shown in horizontal solid lines in the plots. The vertical dashed lines are the location
of natural guide stars at triangle, and the vertical dotted lines are the location of laser guide stars in
pentagonal points and at the center.
    Tip-tilt removed wavefront error is small for a conpact constellation of laser guide star and grad-
ually saturated for a expanded constellation. The tip-tilt removed wavefront error, where laser guide
stars are located, is always constant. Tip-tilt wavefront error is increased when the separation of tip-tilt
natural guide star becomes larger. Tip-tilt wavefront error seems not to be negligible when the sep-
aration of natural guide star is larger than 60 arcsec. This suggests that if we can set more natural
guide stars, among whose separation is less than 60 arcsec within the field of regards, the performance
degradation due to the tip-tilt wavefront error can be kept low.
    The ensquared energy across the line of field of regards from right to left in the Figure. 5 are plotted
in Figure. ??. Symbols and lines are identical to the Figure. 6.
    If we need Strehl ratio around 0.5 at K-band, the separation of the tip-tilt natural guide star has to
be smaller than 60 arcsec. This is consistent from the analysis of wavefront error above.
   Baseline MOAO simulation suggest us that the number of tip-tilt natural guide star and its field
density is the most critical criteria to the performance of MOAO.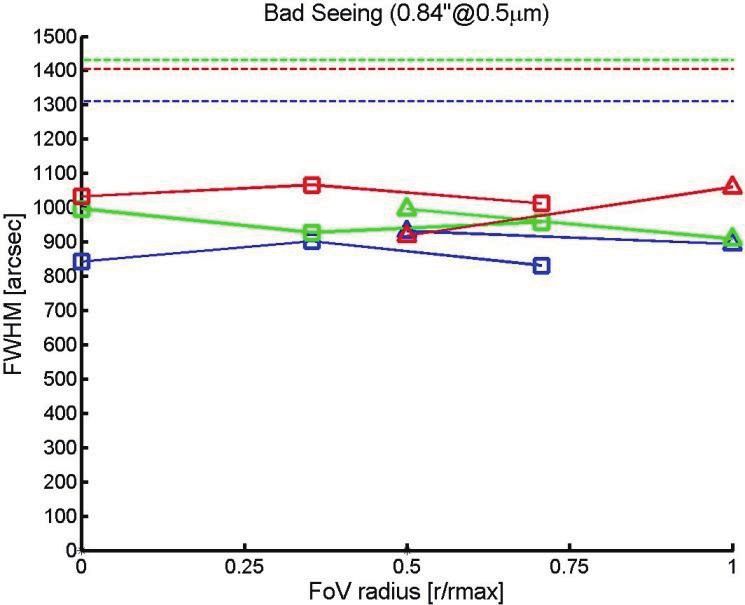
AO for ELT II

                                Fig. 5. Guide star geometry of MOAO simulation.

Fig. 6. Wavefront error for baseline MOAO simulation. Constellation set 1 (top-left), set 2 (top-center), set 3 (top
right), set 4 (bottom left) and set 5 (bottom center).

3 Expected Performance and Simulations of Distant Galaxy Observations
In this section, we concentrate a possible extragalactic science cases with next generation AO of Sub-
aru Telescope. One of the fundamental questions for extragalactic science is the formation and evo-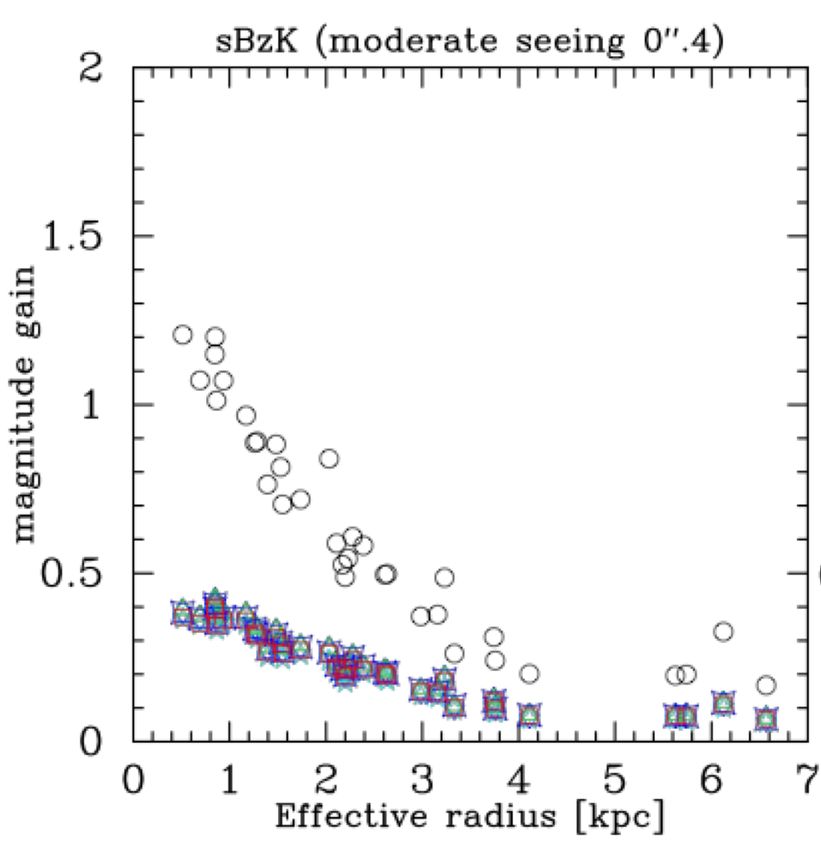
Yutaka Hayano et al.: Next generation AO system of Subaru Telescope

Fig. 7. Ensquared energy across the field of regards. Constellation set 1 (top-left), set 2 (top-center), set 3 (top
right), set 4 (bottom left) and set 5 (bottom center).

lution of galaxies. The next generation AO has a potential to answer these questions, such as (1)
why there are various kind of galaxies at present? (ellipticals, spirals, giant and dwarf galaxies etc.),
(2) what determined the fate of galaxies?, (3) did the bulge (stellar components) and central blackhole
make co-evolution? Also next generation AO could push the frontier of the most distant galaxy further.
    For example, the pioneer research on resolving galaxies in the epoch of violent galaxy formation
around the redshift from 1.5 to 3 (z=1.5 - 3) has been started by using SINFONI at VLT[4]. To expand
from small set of galaxy sample to the statistical investigation of violently evolving galaxies, we need
wide field imaging and multi object spectroscopy.

3.1 imaging of galaxies

Numerical simulation of imaging observation of galaxies at the redshift around 2 is introduced here.
Data is used from CANDLES[5] at GOODS south area taken by HST/WFC3, whose survey area is
about 120 arcmin2 . This is comparable to the field of view of GLAO and its near infrared instru-
ment. Criteria of selecting star forming BzK galaxies is done by a K-band magnitude (KAB < 23.9)
and spectroscopically defined redshift from 2.1 to 2.6 by MUSYC[6]. Finally we extract 40 galaxies.
Then based on the CANDLES data, we derived an effective radius, Sersic index, axis ratio, and posi-
tion angle from a Sersic profile flitting for each selected galaxy. We construct numerically the model
galaxy image from the morphological parameters. Then we convolve the model galaxy image with the
simulated PSF of GLAO, and add noise corresponds to 5 hours integration.
    Diffraction image and simulated GLAO image of galaxy model are shown in Figure. 8. Encircled
energy has a 50 % gain at the radius of 0.2 arcsec and this is not changed across the total field of view
of GLAO up to 10 arcmin. We estimated that the sensitivity gain is 0.55 magnitude for point source and
0.3-0.4 magnitude for compact (Re < 3kpc) galaxies at K-band under moderate seeing condition. (See
Figure. 9) However, there is small gain for extended galaxies (Re > 3kpc). Measurement of galaxy
size is feasible with GLAO at all seeing condition, but morphological classification by Sersic index is
difficult with GLAO. (See Figure. 10)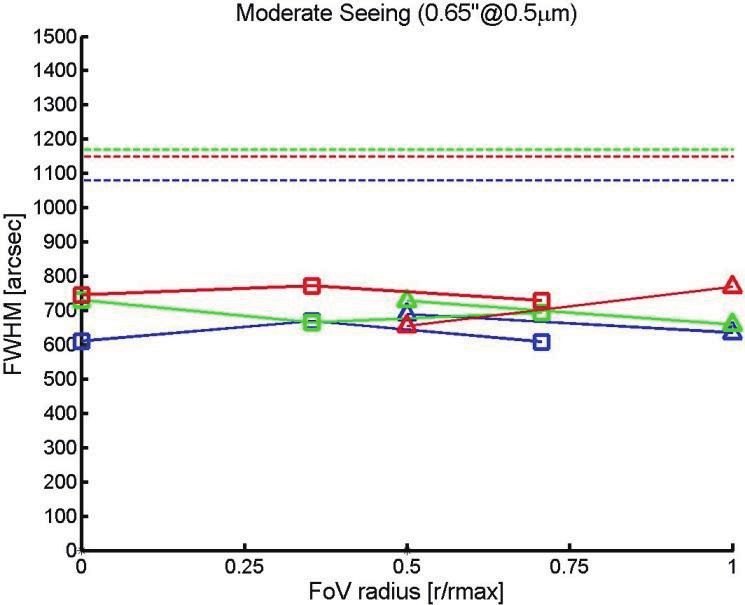
AO for ELT II

    ! Assuming 5 hours integration in K-'()*+,)*-.+/0*-.(1-+2--3)4+50)*3130)+!"#$%&
                                                         GLAO                                             Seeing
                                                                                                          !"#$%&

           2.56.7"#$8      1.56.7"#$8       1.56.7"#$8     1.56.7"#$8      1.56.7"#$8     1.56.7"#$8

                2.02            1.28            1.29            1.29           1.29           1.27

          MUSYC 34852: zspec=2.32, H=22.5, K=21.9, log (M*/Msun)=11.1, Re=1.4[kpc], N=1.7

                                         Fig. 8. Simulated image of galaxy.

                                           K-band imaging

                                                  Diffraction limit
                                                  (AO188)

                                                                               PSF

                                           GLAO

Fig. 9. Sensitivity gain. Dashed red line indicates a sensitivity gain for point source. Open circle shows a sensitivity
gain of AO188, which provides high Strehl ratio around 0.7 at K-band.

3.2 spectroscopy study of galaxies

We simulate to derive a rotation curve and velocity dispersion of galaxy at the redshift around 2.
The specification of integral field spectrograph are as follows. Spatial sampling at the focal plane is
0.12 arcsec. Spectral resolution is 2500 at K-band. Detector array has identical quantum efficience
as Hawaii 2 RG delivered from Teledyne. Dark count is 0.1 electron/s and readout noise is 10 elec-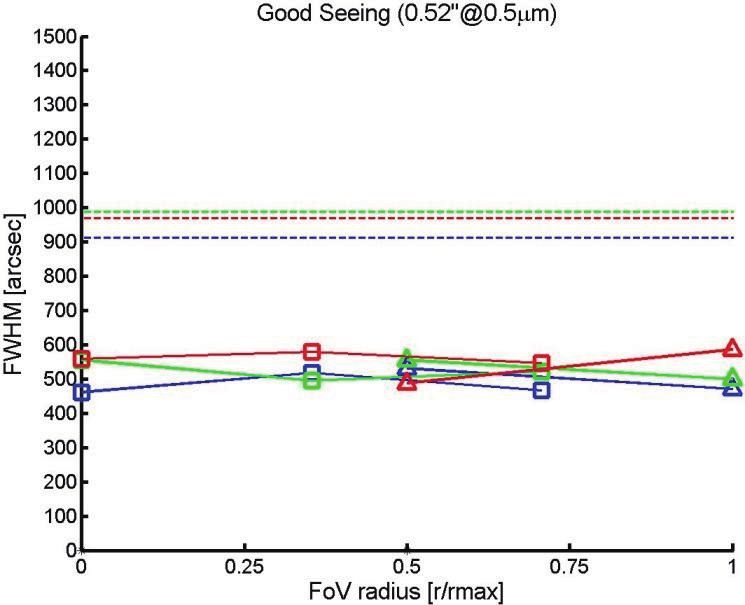
Yutaka Hayano et al.: Next generation AO system of Subaru Telescope

                                                                  !"#$%&'(,
                                                                  !"#$%&'(*+
                                                                  !"#$%&'(-
                                                                   !"#$%&'(&)

                                            !" GLAO, #: natural seeing

                                Fig. 10. Morphological parameter fitting accuracy.

tron/pix. The left images in Figure. 11 show a model of rotation map and velocity dispersion of galaxy.

                                                   Diffraction
                                Model                                GLAO             Seeing
                                                    Limited

                 Rotation

              Vel. Dispersion

    Fig. 11. Observation simulation on estimating rotation profile and velocity dispersion of galaxy model.

The rest of three sets of images shows a numerical simulation results of integral field spectroscopy
for three imaging qualities, diffraction limited images (left), GLAO image quality around 0.2 arcsec
FWHM (center), and the moderate seeing condition (right). The velocity dispersion is quite difficult
to get a good quality of data even under the diffraction limited images. Rotation velocity is slightly
under estimated using GLAO (See Figure. 12). We can say from our basic observation simulation of
spectroscopy above that the investigation of kinematics of faint galaxies using GLAO is not so easy.

4 Conclusion and future

We conducted preliminary performance simulation studies of GLAO and MOAO and science case
study in imaging and spectrograph. We need more detain analysis and simulation study for GLAO and
MOAO. Additionally, the specification of near infrared imaging or spectrograph has to be considered
in parallel.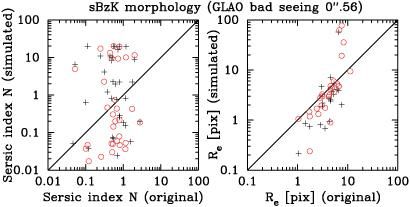
AO for ELT II

                           Fig. 12. Fit of rotation velocity of the galaxy model.

References
1.   Conan et al., Proceedings of the SPIE, Volume 7736, pp. 77360T-77360T-14 (2010).
2.   Andersen, Modeling Notes of RAVEN Project.
3.   Els et al., PASP 121, (2009), 527.
4.   Foerster-Schreiber et al., ApJ 706, (2009), 1364-1428.
5.   Koekemoer et al., ApJS 197, (2011).
6.   Cardamone et al., ApJS 189, (2010), 270-285.
You can also read


