Astrophysics of Galaxies 2019-2020 - Lecture VII: Insights into galaxy evolution from stellar population and gas scaling relations
←
→
Page content transcription
If your browser does not render page correctly, please read the page content below
Lecture VII: Insights into galaxy evolution from
 stellar population and gas scaling relations

Astrophysics of Galaxies
2019-2020
Stefano Zibetti - INAF Osservatorio Astrofisico di Arcetri

Lecture VII
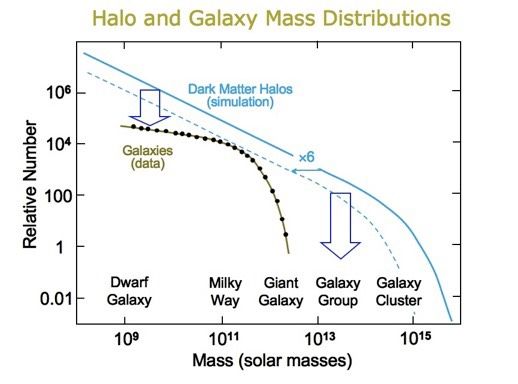
Stefano Zibetti - INAF OAArcetri - Astrophysics of Galaxies - Course 2019/2020 - Lecture VII

 Dark

The *Problem* Matter
 Haloes
 Stars in
 Galaxies

✤ The galaxy formation paradigm
 asserts that galaxies form inside
 dark matter halos

✤ Yet the mass functions of DM and
 Moster et al. (2010)
 stars do not match!

✤ Efficiency of galaxy formation is
 suppressed at low and high masses M*/MDM
 —> feedback???

 MDM
Stefano Zibetti - INAF OAArcetri - Astrophysics of Galaxies - Course 2019/2020 - Lecture VII

 Dark

The *Problem* Matter
 Howe, Green (from the web)
 Haloes
 Stars in
 Galaxies

✤ The galaxy formation paradigm
 asserts that galaxies form inside
 dark matter halos

✤ Yet the mass functions of DM and
 Moster et al. (2010)
 stars do not match!

✤ Efficiency of galaxy formation is
 suppressed at low and high masses M*/MDM
 —> feedback???

 MDM
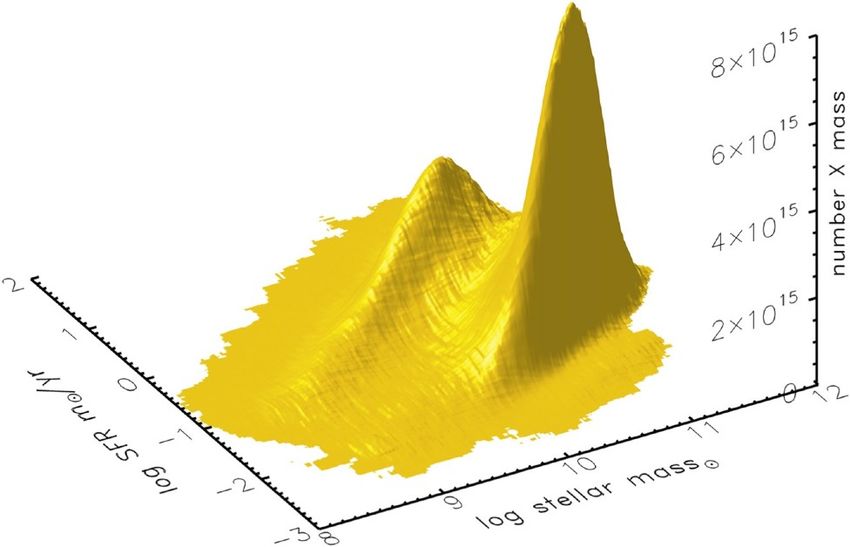
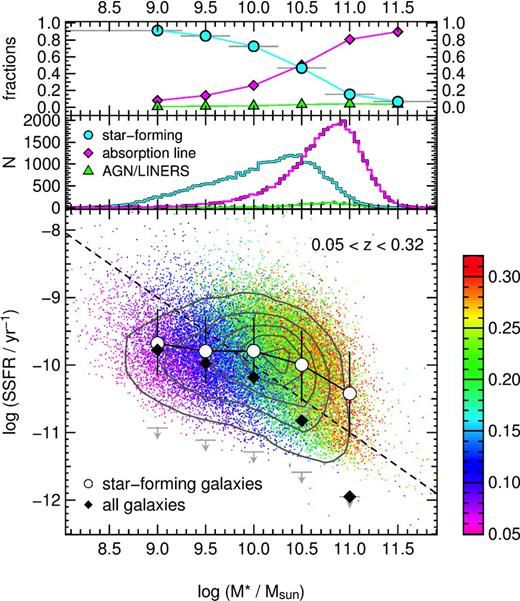
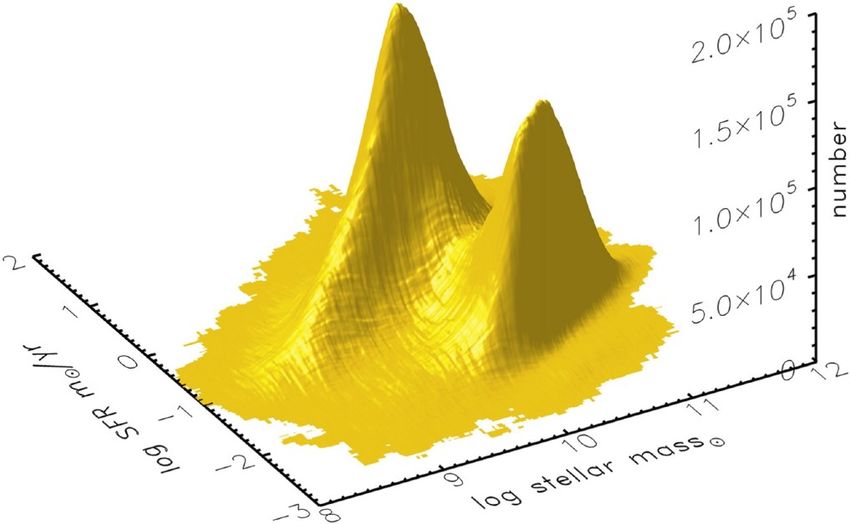
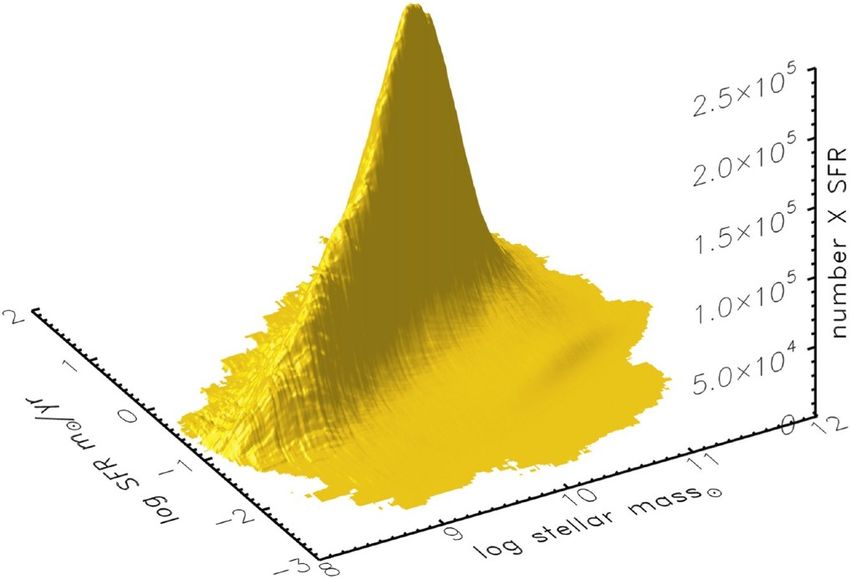
Stefano Zibetti - INAF OAArcetri - Astrophysics of Galaxies - Course 2019/2020 - Lecture VII

The SFR-Mass relation and the
SF Main Sequence

 ~240,000 SDSS galaxies:
 0.02 < z < 0.085

 Renzini & Peng (2015)

Stefano Zibetti - INAF OAArcetri - Astrophysics of Galaxies - Course 2019/2020 - Lecture VII

sSFR vs Stellar Mass

✤ Star-forming galaxies have
 roughly constant sSFR, with a
 hint for down-bending at the
 highest masses

✤ If ALL galaxies are
 considered, a strong trend
 emerges
 Bauer et al. (2013 - GAMA)
Stefano Zibetti - INAF OAArcetri - Structure and Physical Properties
 3.2. StarofFormation
 Galaxies as
 - May 6, 2015of- Lecture
 a Function Mass andIIISize

 Kauffmann et al. (2003, 2006) and Franx et al. (2008) showed
 that the broad range in galaxy effective radii, at a given mass,

Stellar mass (surface density) vs sSFR
 is tightly correlated with sSFR out to z = 2.5. These authors
 concluded that sSFR is a tight function of√stellar mass surface
 density (M⋆ /R 2 ) or velocity dispersion ( M⋆ /re ; Franx et al.
 2008). Put differently, these results imply that the size–mass
 relation is different for galaxies with different sSFRs.
 Our sample is ideally suited to study this aspect at higher
 redshifts, as it covers an area ∼18 times larger than that used by
 Franx et al. (2008). We show in Figure 3 how the sSFR depends
 on mass and size. It is clear that the dependence is very strong:
✤ Stellar mass (causally?) determines sSFR at all z up to 2 at a given mass, galaxies with low sSFRs (binned and plotted
 as red/yellow squares in this figure) have small sizes, while
 those with large sizes have high sSFRs (green/blue squares).
 Surface mass density appears even better correlated
 Figure 2. Size–mass relation for galaxies at z ∼ 0.06 (SDSS; upper left) and
✤ three redshift ranges in the UKIDSS UDS. The grayscale denotes the number The effect is not only strong at very low redshift, but extends to
 of points within each bin; dashed lines indicate the angular radii (θ ∼ 0.′′ 2) the highest-redshift bins. At the same time, the sizes of galaxies
 below which individual size measurements have larger uncertainties. Massive,
✤ What causes what?
 compact galaxies (i.e., those in the lower right-hand portion of each panel)
 are almost nonexistent at z = 0 but become progressively more common at
 higher redshifts. The radii of galaxies with M > 1010.8 M⊙ evolve roughly as
 with low sSFRs (red in the figure) are very small at high redshift,
 consistent with results obtained by others on smaller samples
 (Toft et al. 2007, 2009; van Dokkum et al. 2008; Franx et al.
 ✤ dynamically hot systems have troubles forming stars?
 re ∼ (1 + z)−0.89 (also see Table 2). 2008).
 Table 1 lists the best-fit slopes and normalizations of the
 quiescent galaxy size–mass relations seen in Figure 3. For this
 ✤ or massive systems are so because they have been very
 out to z = 1.5 have on average larger sizes than less massive we defined “quiescent” as galaxies exhibiting sSFR < 0.3/tH ,
 galaxies; this effect is weaker or nonexistent at z = 1.5–2. where tH is the age of the universe at each galaxy’s redshift,
 A second and related point is that there are effectively no effectively picking out the red and yellow points in Figure 3 (see
 efficient in using up their gas in the past?
 massive, compact galaxies (M > 1011 M⊙ , re ! 2 kpc; in
 the lower right-hand region of the size–mass plot) at z = 0,
 also Section 4 and the Appendix). In each redshift interval, the
 median log effective radius was calculated in mass bins of width

 Williams et al. (2010)
 Figure 3. Top: size–mass relation in SDSS (left panel) and in three UDS redshift bins: z = 0.5–1, z = 1–1.5, and z = 1.5–2 in the second, third, and fourth panels,
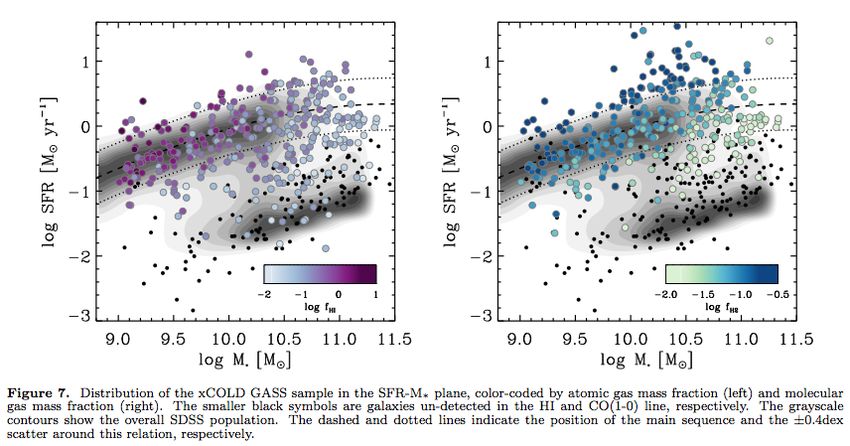
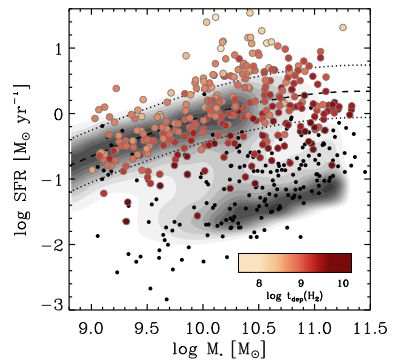
Stefano Zibetti - INAF OAArcetri - Astrophysics of Galaxies - Course 2019/2020 - Lecture VII

Saintonge et al. (2017)
Gallazzi et al. (2005)

Age-M* relation

✤ Massive galaxies all have SFH
 peaked in the past ~10 Gyr

✤ Smaller masses, smaller ages,
 but much more scatter

✤ Transition at between 1010 and
 1010.5 M⦿
Gallazzi et al. (2005)

Stellar Z-M*
relation

✤ Massive galaxies all have high Z

✤ Transition at between 1010 and
 1010.5 M⦿

✤ Smaller masses, very large
 scatter, preferred low Z: evidence
 for winds? or for delayed
 chemical evolution?

✤ ~mirror Zgas relation
M91 ....................... 45.5323 $12.2469 1.32882 $0.0471074 0.11
 D02........................ $8.71120 Stefano
 4.15003 Zibetti -
 $0.322156 INAF OAArcetri - Astrophysics
 0.00818179 of Galaxies - Course 2019/2020 - Lecture VII
 0.08
 PP04 O3N2 ........... 32.1488 $8.51258 0.976384 $0.0359763 0.10
 PP04 N2................ 23.9049 $5.62784 0.645142 $0.0235065 0.09
 P01 ........................ 91.6457 $25.9355 2.67172 $0.0909689 0.12
 P05 ........................ 41.9463 $10.3253 1.04371 $0.0347747 0.13

 Stellar Mass-Metallicity (gas)
 Note.—Robust fits are of the form y ¼ a þ bx þ bx 2 þ bx 3 , where y ¼ log (O/ H ) þ 12 and x ¼ log M , where M is the
 stellar mass in solar units.

 different H ii region abundance sets that were used y-intercept of these Te-based M-Z relations; the P05 method gives
 original P01 method and the updated version in metallicities that are #0.4 dex below the PP04 methods at the
 highest masses, despite the fact that both methods are predom-
 No. 2, 2004 ORIGIN OF MASS-METALLICITY RELATION
 e method is available for only 546/27,730 (2%) of inantly based on H ii regions with Te metallicities. At the lowest
 our SDSS sample. The [O iii] k4363 line is weak stellar masses, this difference disappears. The difference between
 only observed in metal-poor galaxies. The SDSS the empirical methods may be attributed to the different H ii re- Tremonti et al. (2004)
 ns very few metal-poor galaxies because they are gion samples used to derive the calibrations. At the highest met-
 re, compact, and faint (e.g., Terlevich et al. 1991; allicities, the PP04 methods utilize four H ii regions with detailed
 l. 1994; Degree of chemodynamical evolution is related to stellar mass
 ✤ van Zee 2000). Panel (10) of Figure 1
 tal of 477 Te metallicities is insufficient to obtain a
 ✤ More massive galaxies are more mature?
 ion. Because we are unable to fit an M-Z relation
 icities, we do not consider the Te method further in
 ✤ Evidence for metal-loaded outflows?
 n the M-Z relation is large for all metallicity cal-
ms residual about the line of best fit is 0.08–0.13.
 he scatter in the M-Z relation is unknown. Our
 tween the different metallicity calibrations shows
he ionization parameter among galaxies does not
 ibute to the scatter. The ionization parameter is
ulated and taken into account in some metallicity
 D02; KK04; M91), but we do not see a reduction
hese methods. A full investigation into the scatter
 ion will be presented in S. L. Ellison et al. (2008, in

 compare the best-fit M-Z curves for the nine
 brations in Figure 2, including both P01 and P05.
 hows the rms scatter in metallicity about the mean
 width !log (M /M ! ) ¼ 0:2. The major difference
M-Z curves is their position along the y-axis. The
 Fig. 6.—Relation between stellar mass, in units of solar masses, and gas-phase oxygen abundance for ' 53,400 star-forming galaxies in the SDSS
 e largest y-intercept are all photoionization model black filled diamonds represent the median in bins of 0.1 dex in mass that include at least 100 data points. The solid lines are the contours that enclose 68
 of the data. The red line shows a polynomial fit to the data. The inset plot shows the residuals of the fit. Data for the contours are given in Table 3.
 Z94; KD02; T04; M91). Among these photo-
del metallicities, the agreement is #0.2 dex. This mass, we invoke another well-known empirical correlation, (Note that the numerical coefficient has been adjust
within the margin of error typically cited for these the Schmidt star formation law (Schmidt 1959; Kennicutt
 1998), which relates the star formation surface density to the
 clude helium in !gas.) Combining our spectroscopi
 rived M/L ratio with a measurement of the z-band
 0.1–0.15 dex for each calibration). Some calibra- gas surface density. brightness in the fiber aperture, we compute !star , th
 For each of our galaxies we calculate the star formation rate surface mass density. The gas mass fraction is the
 tly agree to within 0.1 dex (e.g., KK04 and Z94; (SFR) in the fiber aperture from the attenuation-corrected H! !gas =(!gas þ !star ).
 1). Comparisons between metallicities calculated luminosity following Brinchmann et al. (2004). In Figure 8 we plot the effective yield of our SD
 We multiply our SFRs by a factor of 1.5 to convert from a forming galaxies as a function of total baryonic (ste
 sistent methods, such as KD02 and M91, are likely
 o within 0.1 dex. However, comparisons between Kewley & Ellison (2008) Kroupa (2001) IMF to the Salpeter IMF used by Kennicutt
 (1998). Our SDSS galaxies have star formation surface den-
 sities that are within a factor of 10 of !SFR ¼ 0:3 M" yr#1
 mass. Baryonic mass is believed to correlate with dark
 evidenced by the existence of a baryonic ‘‘Tully-Fish
 tion (McGaugh et al. 2000; Bell & de Jong 2001). We
 how large disagreement (such as KK04 and P05) kpc#2, exactly the range found by Kennicutt (1998) for the ested in the dark mass because departures from the
 central regions of normal disk galaxies. We convert star for- box’’ model might be expected to correlate with the
 nated by the large systematic discrepancy between mation surface density to surface gas mass density, !gas, by the galaxy potential well. Data on the distribution o
 s. inverting the composite Schmidt law of Kennicutt (1998), fective yield at fixed baryonic mass are provided in
 Because very few of our SDSS galaxies have mass
Mannucci et al. (2010)

The FMR

 The fundamental metallicity relation 2

✤ A manifold in the SFR-Mass-Metallicity space

✤ Combines mass-Z relation with Mass-(s)SFR

✤ Connection via metal “dilution” and Schmidt-Kennicutt
 law?

✤ Evidence for feedback?

✤ Still some debate…
 (e.g. Barrera-Ballesteros et al. 2017, also Sánchez et al. 2017)
Stefano Zibetti - INAF OAArcetri - Astrophysics of Galaxies - Course 2019/2020 - Lecture VII

 Chemical evolution:
 some basic theoretical notions
 ✤ Definitions:

Vincenzo et al. (2015)

 Z(Sun)=0.02
Stefano Zibetti - INAF OAArcetri - Astrophysics of Galaxies - Course 2019/2020 - Lecture VII

Chemical evolution:
some basic theoretical notions

✤ Just math:
Stefano Zibetti - INAF OAArcetri - Astrophysics of Galaxies - Course 2019/2020 - Lecture VII

Chemical evolution:
some basic theoretical notions
✤ Instantaneous recycling
 approximation (IRA): metals are
 produced by stellar evolution
 and incorporated in the ISM
 instantaneously
Stefano Zibetti - INAF OAArcetri - Astrophysics of Galaxies - Course 2019/2020 - Lecture VII

Chemical evolution:
some basic theoretical notions
✤ The closed-box hypothesis:
 no gas is allowed to enter or
 escape the system

✤ From mass conservation:

✤

 IRA

 closed box
Stefano Zibetti - INAF OAArcetri - Astrophysics of Galaxies - Course 2019/2020 - Lecture VII

Chemical evolution:
evolution of Zgas in the closed-box

✤ integrating the last equation

 we obtain:

✤ As time goes by and gas is consumed, Zgas diverges logarithmically

✤ As Mg,0 is the total (baryonic) mass of this idealised galaxy, the
 equation predicts a dependence of Zgas on the gas fraction
Stefano Zibetti - INAF OAArcetri - Astrophysics of Galaxies - Course 2019/2020 - Lecture VII

 No. 2, 2004 ORIGIN OF MASS-METALLICITY RELATION 907

Saintonge et al. (2017) Tremonti et al. (2004)
 Fig. 6.—Relation between stellar mass, in units of solar masses, and gas-phase oxygen abundance for ' 53,400 star-forming galaxies in the SDSS. The large
 black filled diamonds represent the median in bins of 0.1 dex in mass that include at least 100 data points. The solid lines are the contours that enclose 68% and 95%
 of the data. The red line shows a polynomial fit to the data. The inset plot shows the residuals of the fit. Data for the contours are given in Table 3.

 mass, we invoke another well-known empirical correlation, (Note that the numerical coefficient has been adjusted to in-
 the Schmidt star formation law (Schmidt 1959; Kennicutt clude helium in !gas.) Combining our spectroscopically de-
✤ Incomplete chemical evolution: higher gas fraction implies 1998), which relates the star formation surface density to the
 gas surface density.
 For each of our galaxies we calculate the star formation rate
 (SFR) in the fiber aperture from the attenuation-corrected H!
 rived M/L ratio with a measurement of the z-band surface
 brightness in the fiber aperture, we compute !star , the stellar
 surface mass density. The gas mass fraction is then "gas ¼
 !gas =(!gas þ !star ).

 lower metallicity
 luminosity following Brinchmann et al. (2004). In Figure 8 we plot the effective yield of our SDSS star-
 We multiply our SFRs by a factor of 1.5 to convert from a forming galaxies as a function of total baryonic (stellar+gas)
 Kroupa (2001) IMF to the Salpeter IMF used by Kennicutt mass. Baryonic mass is believed to correlate with dark mass, as
 (1998). Our SDSS galaxies have star formation surface den- evidenced by the existence of a baryonic ‘‘Tully-Fisher’’ rela-
 sities that are within a factor of 10 of !SFR ¼ 0:3 M" yr#1 tion (McGaugh et al. 2000; Bell & de Jong 2001). We are inter-
✤ Qualitative explanation — quantitatively??? kpc#2, exactly the range found by Kennicutt (1998) for the
 central regions of normal disk galaxies. We convert star for-
 mation surface density to surface gas mass density, !gas, by
 ested in the dark mass because departures from the ‘‘closed
 box’’ model might be expected to correlate with the depth of
 the galaxy potential well. Data on the distribution of the ef-
 inverting the composite Schmidt law of Kennicutt (1998), fective yield at fixed baryonic mass are provided in Table 4.
✤ Are metal-loaded outflows needed?? !SFR ¼ 1:6 ; 10#4
 !
 !gas
 1 M" pc#2
 "1:4
 M" yr#1 kpc#2 : ð5Þ
 Because very few of our SDSS galaxies have masses below
 108.5 M", we augment our data set with measurements from
 Lee et al. (2003), Garnett (2002), and Pilyugin & Ferrini
 (2000), all of which use direct gas mass measurements. We
Stefano Zibetti - INAF OAArcetri - Astrophysics of Galaxies - Course 2019/2020 - Lecture VII

Stellar metallicities in the closed-
box model
✤ Cumulative metallicity distribution of stellar mass:

✤ By differentiating wrt to Z one obtains the differential distribution:

✤ This can be used to derive the mass-weighted stellar metallicity:
Stefano Zibetti - INAF OAArcetri - Astrophysics of Galaxies - Course 2019/2020 - Lecture VII

Stellar metallicities in the closed-
box model
✤ With the change of variable x=Z/y:

✤ In the limit of Z(t0)
Stefano Zibetti - INAF OAArcetri - Astrophysics of Galaxies - Course 2019/2020 - Lecture VII
 The Ages and Metal

How to interpret the Z*-M*
relation?
✤ Galaxies less massive than
 1010.5 are definitely below the
 yield:
 Gallazzi et al. (2005)
 ✤ far from gas consumption?
 Certainly not all of them

 ✤ Metals lost due to
 outflows? Figure 8. Panels a and b: conditional distribution of stellar metallicity an
 with median S/N per pixel greater than 20. Each distribution was obta ETGs
 ✤ Metallicity diluted by (gas poor!)
 the desired parameter (stellar metallicity or age) and stellar mass for all
 stellar mass (of width 0.2 dex). The solid line indicates the median of t
 and 84th percentiles. Panels c and d: comparison of the scatter in the me
 inflows? metallicity and age estimates as a function of stellar mass. The diamon
 16th and 84th percentiles of the conditional distributions
 Gallazzi etof
 al.panels
 (2006), a an
 range in log(Z/Z⊙ ) or log(tr /yr) for the galaxies
 see in each
 also stellar
 Trager et al.mass
 (2000)bi
Stefano Zibetti - INAF OAArcetri - Astrophysics of Galaxies - Course 2019/2020 - Lecture VII

Departures from closed-box:
what do we learn from them?

✤ Delayed chemical enrichment

✤ Inflows: galaxies do not originate from a monolithic collapse

✤ Outflows (—> feedback): (metal enriched) gas is expelled from
 galaxies due to

 ✤ winds powered by Supernovae and in general by the radiation of
 the most luminous stars

 ✤ Active Galactic Nuclei
Stefano Zibetti - INAF OAArcetri - Astrophysics of Galaxies - Course 2019/2020 - Lecture VII

A simple picture

 ✤ Explains/recovers

 ✤ relations between halo mass and
 stellar mass

 ✤ mass-SFR-Z relations

 ✤ redshift evolution of these relations

 ✤ Ingredients

 ✤ efficiency of conversion of gas in the
 reservoir into stars lambda
Lilly et al. (2013) ✤ mass loading factor: fraction of gas
 reservoir ejected in/outside the halo
Stefano Zibetti - INAF OAArcetri - Astrophysics of Galaxies - Course 2019/2020 - Lecture VII

Spatially resolved relations:
are global relations set by the local
physics (alone)?
Stefano Zibetti - INAF OAArcetri - Astrophysics of Galaxies - Course 2019/2020 - Lecture VII

M*-SFR
 Integrated Spatially resolved

 Slope Slope

 Cano-Díaz et al. (2016)
Stefano Zibetti - INAF OAArcetri - Astrophysics of Galaxies - Course 2019/2020 - Lecture VII

M*-SFR
 Integrated Spatially resolved

 Slope Slope

 ?

 M*
 ψ ∝ μSFR R ∝ μSFR ∝ Σγ−1
 2
 *
 M* ∝ M*
 β(γ−1)+1
 Σ*
 β(γ − 1) + 1 ∼ 0.5(0.7 − 1) + 1 = 0.85
 Cano-Díaz et al. (2016)
Stefano Zibetti - INAF OAArcetri - Astrophysics of Galaxies - Course 2019/2020 - Lecture VII

 M*-age
Metallicities of Galaxies in the Local Universe 13

 Integrated Spatially resolved

Metallicities of Galaxies in the Local Universe 13

 Gallazzi et al. (2005)
licity and age as a function of stellar mass for 44,254 SDSS-DR2 galaxies
as obtained by coadding the normalized 2-D likelihood distributions of
s for all the galaxies and then re-normalizing along the y-axis in bins of
ian of the final conditional distribution, and the dashed lines the 16th
 the metallicity and age distributions with the mean uncertainty of the
 diamonds show the difference in log(Z/Z⊙ ) or log(tr /yr) between the Zibetti et al. (2017)
 els a and b, while the stars represent the mean 68 percent confidence
mass bin.
Stefano Zibetti - INAF OAArcetri - Astrophysics of Galaxies - Course 2019/2020 - Lecture VII

 M*-Z*
 The Ages and Metallicities of Galaxies in the Local Universe 13

 Integrated Spatially resolved

 Gallazzi et al. (2005)
 Gonzalez Delgado et al. (2014)
8. Panels a and b: conditional distribution of stellar metallicity and age as a function of stellar mass for 44,254 SDSS-DR2 galaxies
Stefano Zibetti - INAF OAArcetri - Astrophysics of Galaxies - Course 2019/2020 - Lecture VII

Stellar populations in ETGs
 ~1 kpc spatially resolved regions
 from CALIFA

 Zibetti et al. (2019)
Stefano Zibetti - INAF OAArcetri - Astrophysics of Galaxies - Course 2019/2020 - Lecture VII

Stellar populations in ETGs
 ~1 kpc spatially resolved regions
 from CALIFA

 Zibetti et al. (2019)
Stefano Zibetti - INAF OAArcetri - Astrophysics of Galaxies - Course 2019/2020 - Lecture VII

Spatially resolved relations:
are global relations set by the local physics (alone)?

✤ No simple answer: local and global cannot be disentangled

✤ Also, galaxies are not static nor stationary systems: what does a
 current local property tell us about the past and the evolutionary
 history?

✤ So, what and how do we learn them?

 ✤ play with models, introduce physical prescriptions which depend
 on local and global properties to different degrees

 ✤ challenge models with more and more detailed observations
You can also read