Very wet in Northland, dry for many remaining areas - NIWA
←
→
Page content transcription
If your browser does not render page correctly, please read the page content below
New Zealand Climate Summary: July 2020                                            Issued: 4 August 2020

Very wet in Northland, dry for many remaining areas
 Rainfall            Rainfall was well above normal (>149% of normal) or above normal (120-149% of
                     normal) for Northland, western Otago and inland parts of Southland. Rainfall was
                     below normal (50-79% of normal) or well below normal (149% of normal) for
Northland, western Otago and inland parts of Southland. Most of Northland’s rainfall occurred during
the middle of the month, when a low-pressure system delivered very moist subtropical air to the
region. The relatively high rainfall totals observed in western Otago and inland parts of Southland may
be partly attributed to more frequent southwesterly winds observed there during the month. In
contrast, rainfall was below normal (50-79% of normal) or well below normal (
normal in Marlborough, eastern and inland parts of Canterbury, and North Otago. It was especially dry
in Timaru where just 5 mm of rain (10% of the July average) was recorded. Tasman, Nelson, and
eastern parts of Central Otago observed below normal rainfall for the month. By the end of July, soils
were drier than normal in eastern parts of Otago and southern Canterbury, especially about Timaru.
Soil moisture levels were typically near normal for remaining parts of the country.

It was a relatively mild July for most of the country. Temperatures were above average (0.51-1.20°C
above average) in central and northwestern parts of the South Island, and southern, western and
northern parts of the North Island. Temperatures were typically near average (±0.50°C of average) for
Hawke’s Bay, Wairarapa, Kapiti Coast, as well as western and coastal parts of Otago and Southland.
Overall, the nationwide average temperature in July 2020 was 8.6°C. This was 0.8°C above the 1981-
2010 July average, making it New Zealand’s eleventh-warmest July since NIWA’s seven station
temperature series began in 1909. It has now been 42 consecutive months since New Zealand’s
nationwide average temperature was below average.

Further Highlights:

   •   The highest temperature was 20.0°C, observed at Whangarei on 16 July and Kaitaia on 18 July.
   •   The lowest temperature was -8.9°C, observed at Tara Hills (Omarama) on 16 July and
       Middlemarch on 18 July.
   •   The highest 1-day rainfall was 262 mm, recorded at Kaikohe on 17 July.
   •   The highest wind gust was 191 km/h, observed at Cape Turnagain on 23 July.
   •   Of the six main centres in July 2020, Auckland was the warmest, Wellington was driest and
       sunniest, Hamilton was the wettest, Christchurch was the coldest, and Dunedin was the least
       sunny.
   •   Of the available, regularly reporting sunshine observation sites, the sunniest four areas in 2020
       so far are Bay of Plenty (1583 hours), Greater Nelson (1529), Taranaki (1520 hours) and
       Marlborough (1456 hours).

For further information, please contact:
Gregor Macara
Climate Scientist
Tel. 04 386 0509

Rainfall: A wet month for Northland but dry for many other areas

It was a wet July throughout Northland, with near-record high rainfall totals observed in Kaikohe,
Kerikeri and Whangarei. It marks the third consecutive month of high rainfall for these parts, after a
prolonged period of dry conditions. In the six months from November 2019 to April 2020, Whangarei
recorded 233 mm of rainfall. In the subsequent three months, the city has recorded 843 mm of rain.
July was also wet in Wanaka and Queenstown, where total rainfall was 213% and 198% of normal,
respectively. Much of this precipitation fell at marginal temperatures for the Southern Lakes ski areas;
higher elevations received ample snowfall, but lower elevations occasionally suffered rainfall.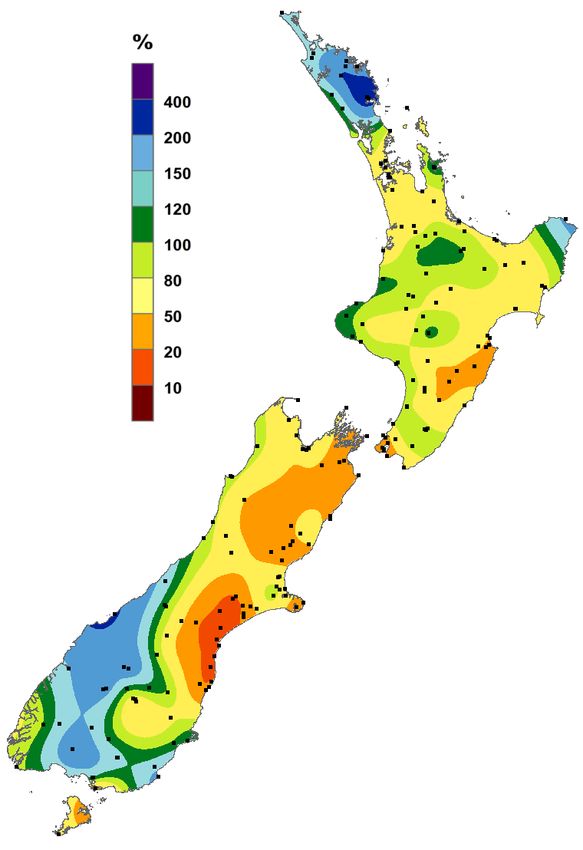
In contrast, it was a dry month for many remaining parts of the country. It was especially dry in parts of
north Otago, eastern Canterbury (Winchmore and Akaroa) and Marlborough where rainfall was about
10-25% of normal for the time of year.

Record1 or near-record July rainfall totals were recorded at:

    Location                     Rainfall         Percentage      Year records Comments
                               total (mm)          of normal         began
    High records or near-records
    Kerikeri                      459                 224             1935         2nd-highest
    Kaikohe                       489                 259             1956         2nd-highest
    Whangarei                     452                 267             1937         3rd-highest
    Low records or near-records
    Akaroa                         32                  24             1977         2nd-lowest
    Winchmore                      10                  15             1909         3rd-lowest
    Wellington (Airport)           34                  30             1958         4th-lowest

Temperature: A mild month throughout the country

July 2020 temperatures were mild for most of New Zealand, with relatively few record mean, mean
maximum and mean minimum temperatures observed. New Zealand’s warmest location compared to
normal was Lake Tekapo. The mean temperature there was 3.1°C, which is 1.5°C warmer than
average. The nationwide average temperature in July 2020 was 8.6°C. This was 0.8°C above the 1981-
2010 July average, making it New Zealand’s eleventh-warmest July since NIWA’s seven station
temperature series began in 1909.

Inland parts of the South Island observed a tranquil spell of weather in mid-July allowing an inversion
to form. An inversion is when the air temperature near the ground warms with increasing elevation,
instead of cooling with increasing elevation (as is typically the case). This acts like a ‘lid’ in the
atmosphere, trapping moisture and pollutants. Residents of inland Otago and Canterbury will be
familiar with inversions in winter – these events are characterised by persistent cold temperatures and
are often accompanied by a thick layer of low cloud, with consecutive days without sunshine.
Although inversions can bring dour weather to low elevation areas, conditions can be conducive to the
formation of hoar frost, and those lucky enough to be skiing enjoy bright sunshine on the mountains
high about the valley cloud.

From 14-19 July, Cromwell experienced six consecutive days under an inversion. The daily mean
temperature during this time was -0.6°C, with extreme minimum and maximum temperatures ranging
from -6.4°C to 2.4°C, respectively. The town received a meagre total of 1.2 hours of sunshine over the
six-day period; this was observed between 3-5 p.m. on 17 July. This cold and cloudy spell in Cromwell

1
  The rankings (1st, 2nd, 3rd.etc) in all Tables in this summary are relative to climate data from a group of nearby
stations, some of which may no longer be operating. The current climate value is compared against all values
from any member of the group, without any regard for homogeneity between one station’s record, and another.
This approach is used due to the practical limitations of performing homogeneity checks in real-time.
was offset by conditions experienced there over the remainder of the month. Both July mean
temperature (3.0°C, 0.2°C below the July average) and total sunshine (100 hours, 102% of normal July
sunshine) were close to usual for Cromwell overall.
Record or near-record mean air temperatures for July were recorded at:
Location Mean Departure from Year Comments
air temp. (oC) normal (oC) records
began
High records or near-records
Medbury 6.6 1.7 1927 3rd-highest
Low records or near-records
None observed
Record or near-record mean maximum air temperatures for July were recorded at:
Location Mean Departure from Year records Comments
maximum normal (oC) began
air temp. (oC)
High records or near-records
Te Kuiti 14.9 1.4 1959 3rd-highest
Porirua 13.5 1.1 1968 3rd-highest
Takaka 14.4 1.1 1978 3rd-highest
Appleby 14.1 1.3 1932 3rd-highest
Arapito 14.1 1.0 1978 4th-highest
Greymouth 13.2 1.1 1947 4th-highest
Low records or near-records
None observed
Record or near-record mean minimum air temperatures for July were recorded at:
Location Mean Departure from Year records Comments
minimum normal (oC) began
air temp. (oC)
High records or near-records
Kerikeri 8.5 1.4 1945 4th-highest
Medbury 1.1 2.0 1927 4th-highest
Low records or near-records
None observedJuly climate in the six main centres
When comparing July mean temperature to normal, our six main centres were remarkably similar.
Specifically, mean temperatures were 0.6-0.7°C higher than normal for all main centres. Also,
unusually similar were sunshine totals, which ranged from 114-119 hours at five of the main centres.
The exception was Wellington, where the July sunshine total of 148 hours was at least 29 hours higher
than the remaining main centres. Wellington’s total rainfall of 59 mm was just 43% of normal for the
time of year. For 2020 so far, Auckland has received just 60% of its usual January-July rainfall. Of the
six main centres in July 2020, Auckland was the warmest, Wellington was driest and sunniest, Hamilton
was the wettest, Christchurch was the coldest, and Dunedin was the least sunny.
July 2020 main centre climate statistics:
Temperature
Location Mean temp. Departure Comments
(oC) from normal
(oC)
Aucklanda 11.6 +0.7 Above average
Taurangab 10.9 +0.6 Above average
Hamiltonc 9.3 +0.6 Above average
Wellingtond 9.6 +0.7 Above average
Christchurche 6.4 +0.6 Above average
Dunedinf 7.2 +0.7 Above average
Rainfall
Location Rainfall (mm) % of normal Comments
Aucklanda 94 69 Below normal
Taurangab 85 66 Below normal
Hamiltonc 106 82 Near normal
Wellingtond 59 43 Well below normal
Christchurche 67 103 Near normal
Dunedinf 70 123 Above normal
Sunshine
Location Sunshine
(hours)
Aucklanda 116
Taurangab 118
Hamiltong 116
Wellingtond 148
Christchurche 1192
Dunedinf 114
a b c d e f g
Mangere Tauranga Airport Hamilton Airport Kelburn Christchurch Airport Musselburgh Ruakura
2
Missing one day of data.Highlights and extreme events
Temperatures
During the middle stages of the month, an inversion developed over many areas of the South Island,
bringing persistent cold temperatures which were notably cool during daylight hours. The maximum
temperature at Tiwai Point (near Invercargill) on 17 July was just 2.3°C, making it the coldest July day
there since records began in 1972. The temperature stayed below freezing throughout 17 July in
Lauder, reaching a maximum of just -2.8°C.
From 18-20 July, a warm northerly airflow covered many parts of the North Island, with several
locations observing record or near-record high daily maximum temperatures. The warmth was notably
widespread in Taranaki: on 20 July New Plymouth, Stratford and Hawera observed their highest or
equal second-highest July temperature on record, respectively.
The highest temperature was 20.0°C, observed at Whangarei on 16 July and Kaitaia on 18 July. The
lowest temperature was -8.9°C, observed at Tara Hills (Omarama) on 16 July and Middlemarch on 18
July.
Record or near-record daily maximum air temperatures for July were recorded at:
Location Extreme Date of Year Comments
maximum (°C) extreme records
temperature began
High records or near-records
Te Kuiti 19.3 19th 1959 Highest
New Plymouth 18.2 20th 1944 Highest
Porirua 17.6 20th 1968 Highest
Stratford 18.3 19th 1960 Highest
Arapito 19.0 18th 1978 Equal highest
South West Cape 16.0 29th 1991 Equal highest
Hamilton (Ruakura) 19.6 18th 1906 2nd-highest
Hawera 17.8 20th 1977 Equal 2nd-highest
Wellington (Airport) 17.3 20th 1962 3rd-highest
Greymouth 17.8 16th 1947 3rd-highest
Matamata 19.0 18th 1999 4th-highest
Levin 18.6 20th 1895 4th-highest
Port Taharoa 18.2 19th 1973 Equal 4th-highest
Low records or near-records
Tiwai Point 2.3 17th 1972 Lowest
Lumsden -0.3 16th 1982 3rd-lowest
Record or near-record daily minimum air temperatures for July were recorded at:
Location Extreme Date of Year Comments
minimum (°C) extreme records
temperature began
High records or near-records
Roxburgh 9.9 31st 1950 Equal highestSouth West Cape 11.1 31st 1991 2nd-highest Kaitaia 15.2 19th 1948 Equal 2nd-highest Secretary Island 11.8 30th 1988 3rd-highest Gore 8.7 30th 1907 Equal 4th-highest Balclutha 7.6 7th 1972 Equal 4th-highest Low records or near-records Matamata -4.7 3rd 1999 Equal 2nd-lowest Rain and slips On 2 July, heavy rain caused surface flooding in parts of Masterton, with slips reported on rural roads near Castlepoint. On 6 July, a boil water notice was issued for Coromandel Town. The local water treatment plant was unable to operate effectively due to heavy rain resulting in very dirty incoming water. In mid-July, rain was recorded on at least seven consecutive days in many parts of Hawke’s Bay, with heavy falls and high rainfall totals reported about the inland ranges of the region. The rainfall was welcomed by many farmers, contributing to grass growth that was reportedly better than usual for the time of year. On 16 July, a driver was rescued from the roof of their Ute after becoming trapped in floodwaters at Falls Road, Warkworth. On 17 July, very heavy rain and thunderstorms hammered much of Northland. Civil Defence welfare centres were activated as people were forced to leave their homes due to flooding. Approximately 65 homes were evacuated, and four of these homes were left uninhabitable due to damage sustained by floodwaters. Police advised against non-essential travel throughout Northland due to widespread and considerable flooding, particularly about Whangarei. Many businesses in Whangarei’s CDB were flooded causing considerable clean-up costs. Whangarei (Airport) observed 50.8 mm of rain in the hour between 9-10 p.m., which was the city’s second-highest hourly rainfall total for all months on record (records began 1978). Several road closures resulted from the heavy rain and floods, including SH1 between Ohaeawai and Kawakawa. A large slip on SH1 through the Mangamuku Gorge resulted in the closure of that section of road for several days. Heavy rain also fell over the Coromandel Peninsula causing widespread flooding and road closures. Two people were rescued after driving into floodwaters on Hikuia Settlement Road (near Pauanui). On 18 July, heavy rain caused flash flooding and slips in the Gisborne region. Three families were evacuated from Mangatokerau (north of Gisborne), and SH35 was closed from Tolaga Bay to Makarika Road (just south of Ruatoria). The beach at Tolaga Bay was blanketed in forestry slash which had been washed down from inland areas by rivers. On 21 July, heavy rain caused surface flooding on some Queenstown roads, with rockfalls reported on the Queenstown-Glenorchy road, the Crown Range road and SH6 between Frankton and Kingston. The highest 1-day rainfall was 262 mm, recorded at Kaikohe on 17 July.
Record or near-record July extreme 1-day rainfall totals were recorded at:
Location Extreme 1-day Date of extreme Year records Comments
rainfall (mm) rainfall began
Kerikeri 175 17th 1945 Highest
Kaikohe 262 17th 1956 Highest
Whangarei 251 17th 1943 Highest
Hicks Bay 101 16th 1916 Highest
Kaitaia 91 17th 1948 2nd-highest
Nugget Point 33 6th 1930 3rd-highest
Wind
On 2 July, strong southerly winds brought down several trees in the Wellington suburbs of Khandallah,
Karori and Vogeltown. Wellington’s East by West ferry services were cancelled due to large swells
driven by the strong winds, and Cook Straight ferry crossings were also cancelled. The strong winds
blew down power lines in Wainuiomata, while a tree was brought down onto power lines in Naenae.
Farther north, 90 customers near Martinborough were without power due to downed power lines.
On 15 July, strong winds toppled trees in parts of Northland, with firefighters called out 16 times for
downed trees between 6:30-8:40 p.m. A car hit a fallen tree on Mangakahia Road in Kaikohe.
On 16 July, trees were felled by strong winds on the Hauraki Plains, with arching power lines reported
in Onewhero. Approximately 150 homes were without power, including 86 homes in Te Aroha.
On 22 July, strong winds brought down trees and damaged power lines in southern and western parts
of Auckland.
The highest wind gust was 191 km/h, observed at Cape Turnagain on 23 July.
Record or near-record July extreme wind gusts were recorded at:
Location Extreme Date of Year records Comments
wind gust extreme began
(km/h) gust
Hanmer Forest 106 9th 1995 2nd-highest
Te Puke 70 8th 1987 Equal 2nd-highest
Pukekohe 76 22nd 1986 Equal 3rd-highest
Dannevirke 93 23rd 1961 Equal 3rd-highest
Paeroa 100 16th 1991 4th-highest
Port Taharoa 111 22nd 1978 4th-highest
Secretary Island 124 23rd 1994 4th-highest
Snow and ice
On 2 July, snow fell to low elevations in the central North Island. Several roads were closed due to
snow, including the Desert Road (SH1), SH46 from Rangipo to the SH47 junction, and SH47 from
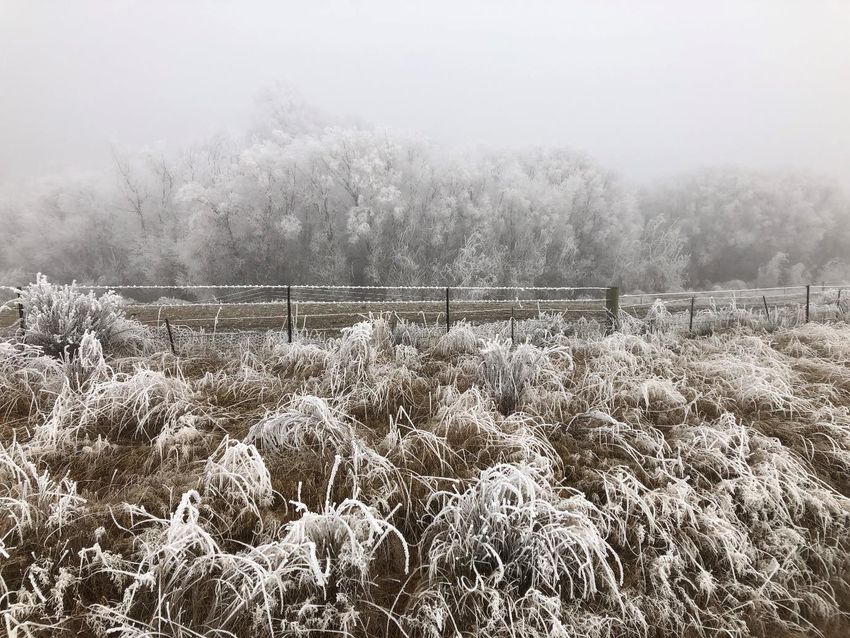
National Park to the SH41 junction near Turangi.On 21 July, black ice was reported on SH85 from Kyeburn to Palmerston, and SH87 from Outram to Kyeburn. On 23 July, snow settled down to around 200 metres above sea level in southeastern parts of the South Island, especially near Balclutha. Snow was also reported in the hill suburbs of Dunedin. The Southland District Council urged extreme caution on roads in the southeast of the province, especially around Edendale, Wyndham, Glenham and the Catlins due to slushy road conditions. A bus rolled onto its side near Glenham (south-east of Gore), with the driver taken to hospital. Snow fell to around 400 metres above sea level near Queenstown. Chains were required on vehicles travelling over the Crown Range Road. The Milford Road (SH94) was closed due to heavy snow. Lightning and hail On 17 July, approximately 500 lightning strikes were recorded near Northland. They were associated with thunderstorms that delivered heavy downpours of rain to the region. Cloud and fog Low cloud persisted in many inland basins of the South Island during the second week of the school holidays (13-19 July). The cloud was trapped under an inversion, resulting in consecutive days without sunshine in areas including Wanaka, Cromwell, Alexandra and the Mackenzie Basin. Cold air was trapped near the valley floors by the inversion, and combined with the humid air to create hoar frost (see example picture below). In many parts, daytime temperatures barely rose above freezing (0°C). On 16 July, three flights were unable to land at Invercargill Airport due to fog. Hoar frost in the Mackenzie Basin. Picture taken alongside Lake Ohau Rd (south of Twizel and west of SH8), on 19 July 2020 at 11 a.m. Credit: Thom Ibbotson
For further information, please contact:

Gregor Macara
Climate Scientist, NIWA Wellington
Tel. 04 386 0509

                                                               July 2020 rainfall expressed as a
                                                               percentage of normal (1981-2010
                                                               July normal).

                                                               It was a wet month in Northland, as
                                                               well as southern and western parts
                                                               of the South Island, as indicated by
                                                               the blue colours. Much of
                                                               Northland’s rainfall fell during a
                                                               short period in the middle of the
                                                               month, resulting in considerable
                                                               flooding there.

                                                               In contrast, it was a dry month for
                                                               many areas, as indicated by yellow
                                                               and orange colours.

                                                               Note: black dots indicate stations with data
                                                               available for the generation of this map. As
                                                               a result, the map accuracy may be
                                                               constrained by the both the number and
                                                               location of contributing stations. We are
                                                               aware of considerable rainfalls that occurred
                                                               in the ranges of Hawke’s Bay during July
                                                               2020 – this isn’t apparent in the month’s
                                                               rainfall anomaly map presented here.

                             https://www.niwa.co.nz/our-science/climate

                                       © Copyright NIWA 2020.

                     All rights reserved. Information presented in this summary is
                     based on data available at the time of publication, which is
                     subject to ongoing quality assurance procedures.
You can also read