2021 ECONOMIC FORECAST - Alan Nevin - Xpera Group, a Vertex Company 10911 Technology Place San Diego, CA 92127
←
→
Page content transcription
If your browser does not render page correctly, please read the page content below
2021 ECONOMIC FORECAST

                                                    Alan Nevin

Xpera Group, a Vertex Company               858.436.7770 | xperagroup.com
10911 Technology Place
San Diego, CA 92127
2021 ECONOMIC FORECAST
A FRESH START
To say that 2020 was a difficult year would be an understatement. From an economic
standpoint, it was on par with the 2008 financial crisis.
However, there are a couple of major differences.
In 2008, nobody died as a result of the recession. The economic collapse affected all
industries. Real estate was hit particularly hard since subprime defaults and bank failures
cut off the financial oxygen for the industry.
In 2020, the economic impact was uneven, with some industries (such as leisure and
hospitality) devastated while others managed to remain prosperous. For the most part,
real estate has avoided market collapse this time around. Any long-term effects are still
emerging.
In an effort to better understand the economic strengths and weaknesses of the nation
at a given time, I typically follow more than a dozen economic indexes. There are four
indices that inevitably have the greatest impact:
(1) Employment
(2) Interest rates
(3) Vehicle sales
(4) Real estate (construction and sales)
Let’s take a closer look at each of these indicators, both nationally and the San Diego
local economy.
Xpera Group, a Vertex Company 858.436.7770 | xperagroup.com
10911 Technology Place
San Diego, CA 92127 22021 ECONOMIC FORECAST
UNITED STATES OUTLOOK
NATIONAL EMPLOYMENT
During the last recession (which started in 2008), the unemployment rate reached 10%. It did not
return to its pre-recession level of 5.0% until 2016 – eight years later.
Unemployment Rate - United States - 2008-2020
The COVID-19 employment situation is much different. On a
U.S Unemployment Rate
national level, the unemployment rate skyrocketed to nearly
15% in April, before plummeting to 6.7% in November.
March - November 2020
Month Unmployment Rate
In a single month last year, we lost 22 million jobs. Nine months
March 4.4%
later, we only need 2.5 million more jobs to return to the ±4.0%
April 14.7%
percent level we saw pre-COVID-19.
---
September 7.9%
October 6.9%
November 6.7%
Source: U.S. Bureau of Labor Statistics
Not seasonally adjusted
Xpera Group, a Vertex Company 858.436.7770 | xperagroup.com
10911 Technology Place
San Diego, CA 92127 32021 ECONOMIC FORECAST
Total Employment
United States
U.S. Unemployment Rate Comparison
March - November 2020
By Years of Educational Attainment
April - November 2020
Month Total Jobs Change
(in thousands)
Month April November
March 155,772 n/a
April 133,403 (22,369) Bachelor's Degree or Higher 8.4% 4.2%
September 147,563 14,160 Some College or A.A. degree 15.0% 6.3%
October 149,806 2,243 High School (no college) 17.3% 7.7%
November 153,246 3,440 Less than a HS Degree 21.2% 9.0%
Source: BLS.gov
Need to Recover 2,526
Source: Bureau of Labor Statistics
At the time of writing, COVID vaccines are starting to get widely distributed (a monumental effort). If
the vaccine reaches most of the population by late summer, it is likely that the unemployment rate
could reach the “magic” 5.0% level by third quarter 2021.
In many respects, this is a recession for those without four-year college credentials. The
unemployment rate is twice as high for workers who only completed high school as it is for those with
bachelor’s or higher degrees.
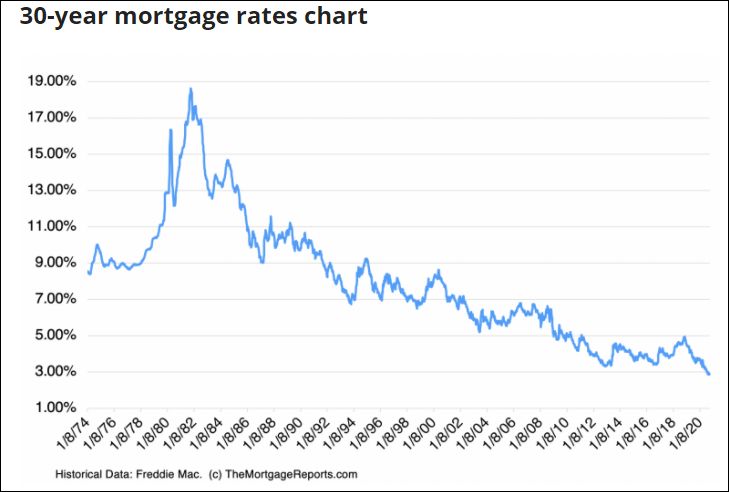
INTEREST RATES
30-Year Mortgage Rates
Mortgage and business borrowing rates are at a 50-
year low right now and I see no reason why they
should rise in 2021. The supply of funds is due to a
combination of factors:
• People are saving more today (believe it or not)
• Foreign funds are finding their way to the U.S.
• The Federal Reserve is determined to get the
economy moving again
Needless to say, these low interest rates bode well for
real estate construction and acquisition.
Xpera Group, a Vertex Company 858.436.7770 | xperagroup.com
10911 Technology Place
San Diego, CA 92127 42021 ECONOMIC FORECAST
VEHICLE SALES
New Car Sales by Month
I track vehicle sales because they are a good indicator of United States
how people feel about the economy. 2019 - 2020
Prior to COVID-19, 17 million new vehicles (cars and light Month 2019 2020
trucks) were sold in each of the previous five years. Used car
sales rose to 40 million in 2019. January 1,172,653 1,157,415
February 1,257,589 1,434,716
In 2020, new vehicle sales will fall to 14 million (once final March 1,552,126 912,800
numbers are released). In 2021, I predict we will see a April 1,355,548 563,122
bounce back to 16-17 million vehicles. May 1,606,260 1,181,756
June 1,462,664 1,214,706
One of the reasons for this projection is that the average U.S. July 1,417,418 1,336,267
vehicle is now 12 years old, up from nine years a decade August 1,628,577 1,298,489
ago. With interest rates at a new low, buying a vehicle is September 1,282,712 1,370,243
almost an American imperative. October 1,384,010 1,187,800
Jan-Oct 14,119,557 11,657,314
November 1,446,173 1,235,042
I should point out that most of the decline in sales was in
December (1) 1,459,164 1,200,000
lower-priced vehicles. When you look at higher-end car
brands (such as Mercedes-Benz), sales for the first three Total 17,024,894 14,092,356
quarters of 2020 returned to normal after a dip in March and
April. Source: NADA (1) Dec. 2020 estimated
Used car sales have grown every year since 2015 and they Mercedes Benz Sales by Month
remain in high demand. Despite COVID-19, 41 million used United States
vehicles were sold in 2020. Unfortunately, dealers cannot 2019 - 2020
obtain a sufficient number of vehicles to satisfy buyer
demand. Ordinarily, used car dealers have a two-month Month 2019 2020
inventory on their lots. Now, they are down to just a one-
month supply, thanks to a decline in trade-ins. January 23,721 23,721
February 24,389 31,650
March 30,557 19,170
April 25,631 12,112
May 25,631 27,901
June 29,201 29,492
July 27,490 29,675
August 30,144 26,377
September 32,002 28,576
Source: Mercedes-Benz
Xpera Group, a Vertex Company 858.436.7770 | xperagroup.com
10911 Technology Place
San Diego, CA 92127 52021 ECONOMIC FORECAST
REAL ESTATE
When evaluating the U.S. real estate market, I look at three factors: (1) new residential and
commercial construction, (2) sales of existing homes, and (3) construction valuation.
RESIDENTIAL AND COMMERCIAL CONSTRUCTION
Nationally, the number of residential units permitted U.S. Residential Building Permits
has been going up since 2015 and has continued 2015 - 2020
on an upward path throughout this year.
Single Multi-
In 2020, the U.S. will produce 1.4 million new housing Year Total
Family Family
units.
2015 1,182,600 696,000 486,600
2016 1,206,600 750,800 455,800
2017 1,282,000 820,000 462,000
2018 1,328,800 855,300 473,500
2019 1,386,000 862,100 523,900
2020 (P) 1,400,000 950,000 450,000
Census.gov
SALES OF EXISTING HOMES
Home Resales In most years, sales of 5 to 6 million existing homes are
United States considered very good. But in 2020, U.S. sales will pass the 7
2015 - 2020 million mark. This spike in purchases has resulted in a rapid
reduction in the supply of existing homes for sale. At the end
Months of 2020, the supply declined to just 2.5 months. In most of the
Year Total country, a five- to six-month supply is normal.
Supply
2015 5,250,000 5.9
2016 5,450,000 5.4
2017 5,510,000 3.9
2018 5,340,000 4.0
2019 5,340,000 3.9
2020 (P) 7,200,000 2.5
Soujrce: NAR
Xpera Group, a Vertex Company 858.436.7770 | xperagroup.com
10911 Technology Place
San Diego, CA 92127 62021 ECONOMIC FORECAST
Census.gov tracks the dollars expended in the public sector as well as residential and commercial
construction in the private sector. Since 2015, all three categories have been increasing, with
residential housing leading the way.
U.S. Value of Construction (Millions)
Private & Public Sector
2015 - 2020 (P)
Private Sector
Year Residential Coml Public Sector Total
2015 $ 438,695 $ 701,467 $ 293,768 $ 1,433,930
2016 $ 485,965 $ 737,706 $ 296,539 $ 1,520,210
2017 $ 545,753 $ 734,088 $ 296,539 $ 1,576,380
2018 $ 563,877 $ 769,306 $ 310,167 $ 1,643,350
2019 $ 550,942 $ 814,195 $ 334,433 $ 1,699,570
2020 (P) $ 593,954 $ 805,562 $ 339,736 $ 1,739,252
Change
2015 - 2020 $ 155,259 $ 104,095 $ 45,968 $ 305,322
% Change 35.4% 14.8% 15.6% 21.3%
Source: Census.gov
Xpera Group, a Vertex Company 858.436.7770 | xperagroup.com
10911 Technology Place
San Diego, CA 92127 72021 ECONOMIC FORECAST
THE SAN DIEGO ECONOMY
San Diego County is still growing, but not quite as fast as in years past. We still have 18,000 more births
than deaths each year, but our in-migration from south of the border has slowed and we are losing
residents to Texas, Arizona and Nevada.
San Diego County Population Components of Change
2015 - 2020 San Diego County
2018 - 2019
Year Population Change
Population Change 13,004
2015 3,274,586 25,893
Births 39,748
2016 3,295,583 20,997
Deaths 21,995
2017 3,318,132 22,549
Natural Increase 17,753
2018 3,344,438 26,306
2019 3,357,442 13,004 ⇩
(1) Population Change - Natural Increase =
2020 3,370,418 12,976 Net Migration (1) (4,749)
Net Immigration 15,982
Source: CA DOF
Net Domestic Migration (2) (20,731)
(2) Net Migration minus Net Immigration
Source: CA DOF
The forced change to remote work in 2020 made it easier for people to move. Although I cannot
document it yet, it appears that much of our in-migration is composed of college-educated (and
eventually more affluent people), often from the Bay Area. Those who are leaving are typically less
affluent and looking for less expensive places to live.
Xpera Group, a Vertex Company 858.436.7770 | xperagroup.com
10911 Technology Place
San Diego, CA 92127 82021 ECONOMIC FORECAST
EMPLOYMENT
Since the COVID-19 stay-home order in spring, we appear to be making headway on employment.
From a peak of 15.0% in April, we have gradually edged downward to less than half that.
San Diego Employment San Diego Unemployment Rate
February - November 2020
Total Unemployment
Month
Employment Rate
February 1,544,265 3.2%
April 1,317,500 15.0%
November 1,426,300 6.6%
U.S. Bureau of Labor Statistics
Job losses have been highly selective, focusing to a major degree on the leisure and hospitality
industries (including restaurants). Virtually half of the jobs lost since March have been in that category.
Most other industries have had gains or only minor losses, as noted in this exhibit:
Job Losses/Gains by Category
San Diego County
March - November 2020
Change
March March -
Category November
(COVID start) Nov
Total 1,494,000 1,426,000 (68,000)
Leisure and Hospitality 192,900 157,300 (35,600)
Professional & Business Services 259,500 268,300 8,800
Construction 80,200 86,000 5,800
Trade, Transportation & Utilities 218,800 217,900 (900)
Manufacturing 117,100 109,900 (7,200)
Education & Health Services 219,600 209,200 (10,400)
Government 252,900 236,500 (16,400)
Source: U.S. Bureau of Labor Statistics
Xpera Group, a Vertex Company 858.436.7770 | xperagroup.com
10911 Technology Place
San Diego, CA 92127 92021 ECONOMIC FORECAST
It will take several months for our leisure and hospitality industries to recover, especially the convention
business that keeps downtown hotels and restaurants in business. We also need to work diligently to
resuscitate our cruise ship business. We were on track for 300,000 passengers in 2020 when the ships
sprung a leak due to COVID-19. Time will tell how long would-be travelers remember the Diamond
Princess outbreak.
RESIDENTIAL CONSTRUCTION
Despite the pandemic, our residential construction industry has been very busy and will match the
2019 output in 2020. I look forward to a repeat of these years in 2021.
Residential Building Permits
San Diego County
2019 - 2020
No. of Units
Year Total Single Family Multi-Family (1)
2019 8,082 3,023 5,059
2020 8,400 2,700 5,700
(1) Includes condominiums/townhomes and rental apartments
Source: U.S. Census
RESALE MARKET
The resale home market seems to attract more press
Closed Sales
than the new home market. The San Diego Association
of Realtors (SDAR) is having a field day and the market SDAR
would be even more vibrant if there was an inventory of 2019 and 2020
ready-to-sell owners. Year Detached Attached Total
2019 31,918 15,345 47,263
2020 28,996 14,550 43,546
Source:SDAR
Xpera Group, a Vertex Company 858.436.7770 | xperagroup.com
10911 Technology Place
San Diego, CA 92127 102021 ECONOMIC FORECAST
Every month I track three key indicators for home sales: (1) Percentage of original list price received,
(2) days on the market before sale, and (3) monthly supply of inventory. In October 2020, more than
25% of the homes sold had offers over the listing price. That sounds like 2008 – almost.
Existing Homes Sales Key Indicators Median Home Prices - Closed Sales
San Diego County December 2019 and 2020
Year End 2020 Year Detached Attached
Category Detached Attached
2019 $ 655,000 $ 435,000
% of Original List Price Received 100.3% 99.4% 2020 $ 755,000 $ 496,500
Days on Market Until Sale 19 21
Months Supply of Inventory 0.9 1.1 Change 2019-2020 $ 100,000 $ 61,500
% Change 15.3% 14.1%
Source: SDAR
Source: SDAR
With the tightness in the market, prices have increased dramatically in 2020, with single-family homes
up 15.3% and attached homes up 14.1%.
For 2021, I see a continuation of the heady appetites for sale housing, both new and existing, detached
and attached. I really hope that prices do not accelerate at this year’s pace, because that is
unsustainable and harmful to the overall economy.
COMMERCIAL REAL ESTATE
Last year was a roller coaster for most of the commercial property industry, but with a few shining spots,
including industrial and life science. It looks like 2021 will be a robust year for those two categories
again. I anxiously await the grand opening of Amazon’s 3.2-million-square-foot facility in Otay Mesa
and its half-million-square-foot “last mile” delivery project in Poway.
The apartment business remains stable with most A and B properties still collecting 90%+ of their rents. I
fail to see any indicators of rent increases in 2021. In the long run, this is still great.
Office and retail are the biggest question-mark markets in 2021. I believe that most office workers will
still want to work in an office environment and will soon tire of working at home. It may be that to
maintain social distancing permanently, firms will need more square footage per employee rather than
less.
Xpera Group, a Vertex Company 858.436.7770 | xperagroup.com
10911 Technology Place
San Diego, CA 92127 112021 ECONOMIC FORECAST
In terms of retail, most businesses will survive, although the regional centers will struggle for some time.
As far as hotels, the new ones will gradually shine again, although it may take a few months to get
back in shape. The old ones can be sold for use as homeless residences.
Economic Forecast
Commercial Real Estate
San Diego County
2021
Rating (0-10 Scale - with 10 being strongest)
Revenue Ease of New
Category Occupancy Increases Financing Construction
Apartments - Existing 8 5 8 8
Office 7 5 5 3
Retail 8 5 5 3
Industrial 9 8 8 7
Life Science 9 8 8 9
Hotels 7 5 5 3
Xpera Group, a Vertex Company 858.436.7770 | xperagroup.com
10911 Technology Place
San Diego, CA 92127 122021 ECONOMIC FORECAST
OPTIMISM ON THE HORIZON
With a new President and new vaccines, the Nation should move forward once
again.
Assuming that most folks will take the double shot (or the single shots pending
approval) in the next few months, the U.S. employment should return to where we
were last March by the end of 2021.
Overall, San Diego County remains blessed. Of course, there is always the weather,
but more importantly, we have a highly educated and work-oriented labor force that
will allow the economy to grow and prosper. They will continue to buy homes in
communities that our developers struggle to get approved.
I’m not sure I know what normalcy is anymore, but I am pretty sure that some version
of it will be ours again in the second half of 2021. Then, we can move on to bigger
and better things.
Xpera Group, a Vertex Company 858.436.7770 | xperagroup.com
10911 Technology Place
San Diego, CA 92127 13You can also read