Q1 FY2019 Supplemental Information February 7, 2019 - AWS
←
→
Page content transcription
If your browser does not render page correctly, please read the page content below

—
   Q1 FY2019
Supplemental Information
    February 7, 2019

       Tyson Foods, Inc.
Today’s
Speakers

           Noel White        Stewart Glendinning
           President & CEO   EVP & CFO
Certain information in this report constitutes forward-looking statements. Such forward-looking statements include, but are
                  not limited to, current views and estimates of our outlook for fiscal 2019, other future economic circumstances, industry
                  conditions in domestic and international markets, our performance and financial results (e.g., debt levels, return on
                  invested capital, value-added product growth, capital expenditures, tax rates, access to foreign markets and dividend
                  policy). These forward-looking statements are subject to a number of factors and uncertainties that could cause our actual
                  results and experiences to differ materially from anticipated results and expectations expressed in such forward-looking
                  statements. We wish to caution readers not to place undue reliance on any forward-looking statements, which speak only
                  as of the date made. We undertake no obligation to update any forward-looking statements, whether as a result of new
                  information, future events or otherwise. Among the factors that may cause actual results and experiences to differ from
                  anticipated results and expectations expressed in such forward-looking statements are the following: (i) fluctuations in the
                  cost and availability of inputs and raw materials, such as live cattle, live swine, feed grains (including corn and soybean
                  meal) and energy; (ii) market conditions for processed products, including competition from other global and domestic
                  food processors, supply and pricing of competing products and alternative proteins and demand for alternative proteins;
                  (iii) outbreak of a livestock disease (such as avian influenza (AI) or bovine spongiform encephalopathy (BSE)), which could
                  have an adverse effect on livestock we own, the availability of livestock we purchase, consumer perception of certain
                  protein products or our ability to access certain domestic and foreign markets; (iv) the integration of acquisitions; (v) the
                  effectiveness of our financial fitness program; (vi) the implementation of an enterprise resource planning system; (vii)
Forward-Looking   access to foreign markets together with foreign economic conditions, including currency fluctuations, import/export
                  restrictions and foreign politics; (viii) changes in availability and relative costs of labor and contract growers and our ability
                  to maintain good relationships with employees, labor unions, contract growers and independent producers providing us

Statements        livestock; (ix) issues related to food safety, including costs resulting from product recalls, regulatory compliance and any
                  related claims or litigation; (x) changes in consumer preference and diets and our ability to identify and react to consumer
                  trends; (xi) effectiveness of advertising and marketing programs; (xii) our ability to leverage brand value propositions;
                  (xiii) risks associated with leverage, including cost increases due to rising interest rates or changes in debt ratings or
                  outlook; (xiv) impairment in the carrying value of our goodwill or indefinite life intangible assets; (xv) compliance with and
                  changes to regulations and laws (both domestic and foreign), including changes in accounting standards, tax laws,
                  environmental laws, agricultural laws and occupational, health and safety laws; (xvi) adverse results from litigation; (xvii)
                  cyber incidents, security breaches or other disruptions of our information technology systems; (xviii) our ability to make
                  effective acquisitions or joint ventures and successfully integrate newly acquired businesses into existing operations; (xix)
                  risks associated with our commodity purchasing activities; (xx) the effect of, or changes in, general economic conditions;
                  (xxi) significant marketing plan changes by large customers or loss of one or more large customers; (xxii) impacts on our
                  operations caused by factors and forces beyond our control, such as natural disasters, fire, bioterrorism, pandemics or
                  extreme weather; (xxiii) failure to maximize or assert our intellectual property rights; (xxiv) our participation in a
                  multiemployer pension plan; (xxv) the Tyson Limited Partnership’s ability to exercise significant control over the Company;
                  (xxvi) effects related to changes in tax rates, valuation of deferred tax assets and liabilities, or tax laws and their
                  interpretation; (xxvii) volatility in capital markets or interest rates; (xxviii) risks associated with our failure to integrate
                  Keystone Foods’ operations or to realize the targeted cost savings, revenues and other benefits of the acquisition; and
                  (xxix) those factors listed under Item 1A. “Risk Factors” included in our Annual Report filed on Form 10-K for the period
                  ended September 29, 2018.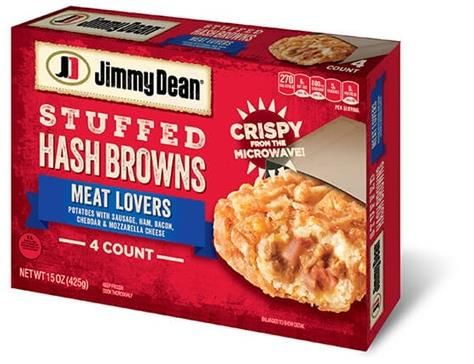
Q1’19 Highlights                                                                                                          ($ in millions, except per share data)

                                                                                                                          Sales                                       $10,193
• Adjusted EPS of $1.58
                                        1
                                                                                                                          Adjusted Operating Income1                     $841
                                                                                                                          Adjusted Operating Margin1                    8.3%
• Adjusted operating income of $841M
                                                                                 1
                                                                                                                          Adjusted EPS1                                 $1.58

• Adjusted operating margin of 8.3%
                                                                                 1

                                                                                                                           Adjusted Operating Income & Margin1
• Record Prepared Foods adjusted operating                                                                                                          ($ in millions)

  margin of 12.5%
        1
                                                                                                                                                            Dollars   ROS
                                                                                                                          Beef                               $305     7.8%
• Closed the Keystone Foods acquisition                                                                                   Pork                                 95     8.1%
                                                                                                                          Chicken                             173     5.6%
• Reaffirming Adjusted EPS guidance for
                                                                             1
                                                                                                                          Prepared Foods                      268     12.5%
  FY2019 of $5.75-$6.10                                                                                                   Other                                ---     n/a
                                                                                                                          Total                              $841     8.3%
1 Represents a non-GAAP financial measure. Adjusted EPS, adjusted operating income and adjusted operating margin
 are explained and reconciled to comparable GAAP measures in the Appendix.

4                                                                                                     Tyson Foods, Inc.                                                      February 7, 2019
Most Admired in Food Production
                                         1. Innovation
                                         2. People Management
                                         3. Use of Corporate Assets
                                         4. Social Responsibility
                                         5. Quality of Management
                                         6. Financial Soundness
                                         7. Long-term Investment
                                         8. Quality of Products & Services
                                         9. Global Competitiveness

5                    Tyson Foods, Inc.                                 February 7, 2019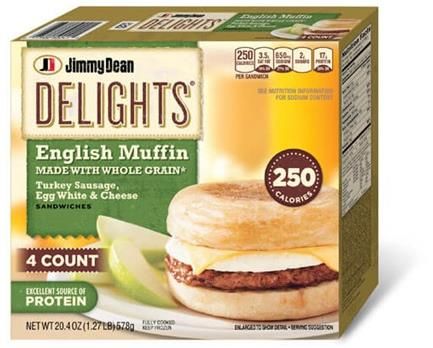
Our Strategy
                 —
  Sustainably feed the world with
the fastest growing protein brands.

            How We Will Achieve Our Strategy

    Grow                    Deliver                  Sustain
    our businesses       ongoing financial fitness    our company and
through differentiated     through continuous        our world for future
     capabilities.            improvement.               generations.
Prepared Foods Segment Results

           Q1’19 Adjusted                                                                                           Q1’19
      Operating Income & Margin1                                                                                                       2
                                                                                                                    Sales volume ↑0.4% (ex-divestitures)
                                                                                                                                        2
                                   ($ in millions)
                                                                                                                    Average price ↑1.5% (ex-divestitures)
              Dollars                                            ROS
                                                                                                                    FY19 Outlook
                                                                                                                                             1
                                                                                                                    Adjusted Operating Margin
               $268                                         12.5%
                                                                                                                    11-12%

1Represents  a non-GAAP financial measure. Adjusted operating income and adjusted operating margin are explained and reconciled to
comparable GAAP measures in the Appendix. A further explanation of providing non-GAAP guidance is included in the appendix.
2Excludes divestitures. Total Prepared Foods sales volume was down 12.9% and average price was up 6.7% including divestitures.

7                                                                                                      Tyson Foods, Inc.                                    February 7, 2019
Prepared Foods Growth

                                           1                               1

                                                                                                                  1           1

1Representsa non-GAAP financial measure. Adjusted Sales and adjusted operating income are explained and reconciled to
comparable GAAP measures in the Appendix. A further explanation of providing non-GAAP guidance is included in the appendix.

8                                                                                                      Tyson Foods, Inc.          February 7, 2019
Jimmy Dean®
Frozen Protein Breakfast

                                                                                          Sales Volume Up 7%

                                                                                          Sales Dollars Up 7.9%

   Source: Nielsen Total US + AOC, 52 weeks ending January 19, 2019

   9                                                                  Tyson Foods, Inc.                     February 7, 2019
Beef Segment Results
Q1’19 Adjusted Q1’19
Operating Income & Margin1 Sales volume ↓0.9%
($ in millions) Average price ↑1.9%
Dollars ROS
FY19 Outlook
1
Adjusted Operating Margin
$305 7.8%
near 7%
1Representsa non-GAAP financial measure. Adjusted operating income and adjusted operating margin are explained and reconciled to
comparable GAAP measures in the Appendix. A further explanation of providing non-GAAP guidance is included in the appendix.
10 Tyson Foods, Inc. February 7, 2019US Annual Beef Exports
Million Pounds, Carcass Weight
3,500 40%
Exports
Exports % of Production
3,000 35%
30%
2,500
25%
2,000
20%
1,500
15%
1,000
10%
500 5%
- 0%
2004 2005 2006 2007 2008 2009 2010 2011 2012 2013 2014 2015 2016 2017 2018
Source: Robert A. Brown, Inc., USDA-ERS 2018 is preliminary
11 Tyson Foods, Inc. February 7, 2019Pork Segment Results
Q1’19 Adjusted Q1’19
Operating Income & Margin1 Sales volume ↓3.6%
($ in millions) Average price ↓4.6%
Dollars ROS
FY19 Outlook
1
Adjusted Operating Margin
$95 8.1%
around 6%
1Representsa non-GAAP financial measure. Adjusted operating income and adjusted operating margin are explained and reconciled to
comparable GAAP measures in the Appendix. A further explanation of providing non-GAAP guidance is included in the appendix.
12 Tyson Foods, Inc. February 7, 2019US Annual Pork Exports
Million Pounds, Carcass Weight
7,000 50%
Exports
Exports % of Production 45%
6,000
40%
5,000 35%
30%
4,000
25%
3,000
20%
2,000 15%
10%
1,000
5%
- 0%
2004 2005 2006 2007 2008 2009 2010 2011 2012 2013 2014 2015 2016 2017 2018
Source: Robert A. Brown, Inc., USDA-ERS 2018 is preliminary
13 Tyson Foods, Inc. February 7, 2019Chicken Segment Results
Q1’19 Adjusted Q1’19
Operating Income & Margin1 Sales volume ↑17.0%
($ in millions) Average price ↓13.1%
Dollars ROS
FY19 Outlook
1
Adjusted Operating Margin
$173 5.6%
exceed 6%
1Representsa non-GAAP financial measure. Adjusted operating income and adjusted operating margin are explained and reconciled to
comparable GAAP measures in the Appendix. A further explanation of providing non-GAAP guidance is included in the appendix.
14 Tyson Foods, Inc. February 7, 2019Our Strategy
—
Sustainably feed the world with
the fastest growing protein brands.
How We Will Achieve Our Strategy
Grow Deliver Sustain
our businesses ongoing financial fitness our company and
through differentiated through continuous our world for future
capabilities. improvement. generations.Q1’19 Highlights ($ in millions, except per share data)
Sales $10,193
• Adjusted EPS of $1.58
1
Adjusted Operating Income1 $841
Adjusted Operating Margin1 8.3%
• Adjusted operating income of $841M
1
Adjusted EPS1 $1.58
• Adjusted operating margin of 8.3%
1
Adjusted Operating Income & Margin1
• Record Prepared Foods adjusted operating ($ in millions)
margin of 12.5%
1
Dollars ROS
Beef $305 7.8%
• Closed the Keystone Foods acquisition Pork 95 8.1%
Chicken 173 5.6%
• Reaffirming Adjusted EPS guidance for
1
Prepared Foods 268 12.5%
FY2019 of $5.75-$6.10 Other --- n/a
Total $841 8.3%
1 Represents a non-GAAP financial measure. Adjusted EPS, adjusted operating income and adjusted operating margin
are explained and reconciled to comparable GAAP measures in the Appendix.
16 Tyson Foods, Inc. February 7, 2019FY19 Outlook
SALES CAP EX ADJUSTED EPS1
~$43B ~$1.5B $5.75-6.10
ADJUSTED OPERATING MARGIN1
PREPARED FOODS BEEF PORK CHICKEN
11-12% near 7% around 6% exceed 6%
1 ProjectedAdjusted EPS as of 2/7/19. Represents a non-GAAP financial measure. Adjusted EPS and adjusted operating margin
are explained and reconciled to comparable GAAP measures in the Appendix.
17 Tyson Foods, Inc. February 7, 2019Our Strategy
—
Sustainably feed the world with
the fastest growing protein brands.
How We Will Achieve Our Strategy
Grow Deliver Sustain
our businesses ongoing financial fitness our company and
through differentiated through continuous our world for future
capabilities. improvement. generations.Appendix Tyson Foods, Inc.
Volume Performance Core 9 and Total Tyson
 Volume Sales % Change Among Top 10 Branded Food Companies >$5B

1.7%
                   1.5%

                                          1.0%

                                                                0.4%
                                                                                0.1%

                                       TOTAL                 CORE 9             TOTAL
                                                                                        -0.2%
                                        F&B                                                           -0.3%
                                                                                                              -0.5%
                                                                                                                      -0.8%
                                                                                                                              -1.1%   -1.1%        -1.1%

  Source: Nielsen Total U.S. x AOC Volume EQ Sales 52 weeks ending 12/29/2018
  Product = Total F&P, Alcohol + Pet Food

   20                                                                                    Tyson Foods, Inc.                             February 7, 2019
Foodservice Broadline Volume Performance
Volume % Change vs. Prior Year (52 weeks ending November 2018)
3.1%
2.4%
1.3%
Total Broadline Focus 6 Categories Tyson Focus 6
Source: NPD SupplyTrack®, Month Ending November 2018. Excludes Large Chain and Operator Label
Focus Six= Chicken Value Added, Breakfast Sausage, Dinner Sausage, Peperoni Pizza Topping, Bacon, Philly Steak
DL= Distributor Label, ML= Manufacturer Label (Branded)
21 Tyson Foods, Inc. February 7, 2019EPS Reconciliations
In millions, except per share data
First Quarter
(Unaudited)
Pretax Impact EPS Impact
2019 2018 2019 2018
Reported net income per share attributable to Tyson $ 1.50 $ 4.40
Add: Restructuring and related charges 8 19 0.02 0.04
Add: Impairment net of a realized gain associated with the divestitures of
non-protein businesses (a) - 4 - 0.05
Add: Keystone purchase accounting and acquisition related costs (b) 26 - 0.06 -
Less: Tax benefit from remeasurement of net deferred tax liabilities at
lower enacted tax rates - - - (2.68)
Adjusted net income per share attributable to Tyson $ 1.58 $ 1.81
(a) EPS impact for the first quarter of fiscal 2018 included a $26 million impairment related to the expected sale of a non-protein business net of a $22 million
realized pretax gain associated with the sale of a non-protein business, which combined on an after-tax basis resulted in a $0.05 impact to EPS.
(b) Keystone purchase accounting and acquisition related costs for the first quarter of 2019 included an $11 million purchase accounting adjustment for the fair
value step-up of inventory and $15 million of acquisition related costs.
Adjusted net income per share attributable to Tyson (Adjusted EPS) is presented as a supplementary measure of our financial performance that is not required by,
or presented in accordance with, GAAP. We use Adjusted EPS as an internal performance measurement and as one criterion for evaluating our performance
relative to that of our peers. We believe Adjusted EPS is meaningful to our investors to enhance their understanding of our financial performance and is frequently
used by securities analysts, investors and other interested parties to compare our performance with the performance of other companies that report Adjusted EPS.
Further, we believe that Adjusted EPS is a useful measure because it improves comparability of results of operations from period to period. Adjusted EPS should
not be considered a substitute for net income per share attributable to Tyson or any other measure of financial performance reported in accordance with GAAP.
Investors should rely primarily on our GAAP results and use non-GAAP financial measures only supplementally in making investment decisions. Our calculation of
Adjusted EPS may not be comparable to similarly titled measures reported by other companies.
22 Tyson Foods, Inc. February 7, 2019Segment Operating Income & Operating Margin Reconciliations
In millions, except
per share data
(Unaudited)
Adjusted Segment Operating Income (Loss)
(for the first quarter ended December 29, 2018)
Prepared Intersegment
Beef Pork Chicken Foods Other Sales Total
Sales $ 3,926 $ 1,179 $ 3,115 $ 2,149 $ 143 $ (319) $ 10,193
Reported operating income (loss) $ 305 $ 95 $ 160 $ 265 $ (18) $ - $ 807
Add: Restructuring and related charges - - 5 3 - - 8
Add: Keystone purchase accounting and acquisition
related costs - - 8 - 18 - 26
Adjusted operating income (loss) $ 305 $ 95 $ 173 $ 268 $ - $ - $ 841
Reported operating margin % 7.8% 8.1% 5.1% 12.3% n/a n/a 7.9%
Adjusted operating margin % 7.8% 8.1% 5.6% 12.5% n/a n/a 8.3%
Adjusted operating income and adjusted operating margin are presented as supplementary measures in the evaluation of our business that are not required by, or presented in accordance
with, GAAP. We use adjusted operating income and adjusted operating margin as internal performance measurements and as two criteria for evaluating our performance relative to that of
our peers. We believe adjusted operating income and adjusted operating margin are meaningful to our investors to enhance their understanding of our financial performance and are
frequently used by securities analysts, investors and other interested parties to compare our performance with the performance of other companies that report adjusted operating income
and adjusted operating margin. Further, we believe that adjusted operating income and adjusted operating margin are useful measures because they improve comparability of results of
operations from period to period. Adjusted operating income and adjusted operating margin should not be considered as substitutes for operating income, operating margin or any other
measure of operating performance reported in accordance with GAAP. Investors should rely primarily on our GAAP results and use non-GAAP financial measures only supplementally in
making investment decisions. Our calculation of adjusted operating income and adjusted operating margin may not be comparable to similarly titled measures reported by other companies.
23 Tyson Foods, Inc. February 7, 2019Historical Prepared Foods Sales, Operating Income (Loss) &
Operating Margin Reconciliations P repared Foods Adjusted Sales and Operating Income (Loss)
In millions, except Fiscal Year
per share data 2018 2017 2016 2015 2014
(Unaudited)
Reported Sales $ 8,668 $ 7,853 $ 7,346 $ 7,822 $ 3,927
Less: Estimated impact of additional week (a) - - - (143) -
Less: Hillshire Brands post-closing sales - - - - (325)
Adjusted Sales $ 8,668 $ 7,853 $ 7,346 $ 7,679 $ 3,602
Reported operating income (loss) (b) $ 849 $ 453 $ 723 $ 584 $ (61)
Add: One-time cash bonus to frontline employees 19 - - - -
Add: Restructuring and related charges 24 82 - - -
Add: Impairments net of realized gains associated with the
divestitures of non-protein businesses (c) 68 45 - - -
Add: AdvancePierre purchase accounting and acquisition related
costs (d) - 34 - - -
Add: San Diego operation impairment - 52 - - -
Add: Hillshire merger and integration costs - - - 10 -
Add: Network optimization impairment charges - - - 59 -
Less: Insurance proceeds (net of costs) related to a legacy Hillshire
Brands plant fire - - - (8) -
Less: Estimated impact of an additional week (a) - - - (13) -
Add: Hillshire Brands acquisition, integration and costs associated
with our Prepared Foods improvement plan - - - - 73
Add: Hillshire Brands post-closing results, purchase price
accounting and cost related to a legacy Hillshire Brands plant fire - - - - 40
Adjusted operating income (loss) (b) $ 960 $ 666 $ 723 $ 632 $ 52
Reported operating margin % 9.8% 5.8% 9.8% 7.5% -1.6%
Adjusted operating margin % 11.1% 8.5% 9.8% 8.2% 1.4%
(a) The estimated impact of the additional week in the 12 months of fiscal 2015 was calculated by dividing unadjusted sales and adjusted operating income for the fourth quarter of fiscal 2015 by 14 weeks.
(b) In the first quarter of fiscal 2019, we adopted a new defined benefit and other postretirement accounting standard that required retrospective adjustment of prior periods. Accordingly, Prepared Foods operating income and adjusted operating income
was reduced by $19 million, $9 million, $11 million, $4 million and $1 million in 2018, 2017, 2016, 2015 and 2014, respectively.
(c) Operating income impact for fiscal 2018 included $101 million of impairments related to the expected sale of a non-protein business net of $33 million realized pretax gains associated with the sale of non-protein businesses. Operating income impact
for fiscal 2017 included a $45 million impairment related to the expected sale of a non-protein business.
(d) AdvancePierre purchase accounting and acquisition related costs impacting operating income for the twelve months ended September 30, 2017, included a $30 million purchase accounting adjustment for the fair value step-up of inventory and $4
million of acquisition related costs.
Adjusted sales and adjusted operating income are presented as supplementary measures of our operating performance that are not required by, or presented in accordance with, GAAP. We use adjusted sales and adjusted operating income as internal performance
measurement and as criterion for evaluating our performance relative to that of our peers. We believe adjusted sales and adjusted operating income are meaningful to our investors to enhance their understanding of our operating performance and are frequently
used by securities analysts, investors and other interested parties to compare our performance with the performance of other companies that report adjusted sales and adjusted operating income. Further, we believe that adjusted sales and adjusted operating
income are useful measures because it improves comparability of results of operations from period to period. Adjusted sales and adjusted operating income should not be considered as a substitute for sales and operating income or any other measure of operating
performance reported in accordance with GAAP. Investors should rely primarily on our GAAP results and use non-GAAP financial measures only supplementally in making investment decisions. Our calculations of adjusted sales and adjusted operating income may not
be comparable to similarly titled measures reported by other companies.
24 Tyson Foods, Inc. February 7, 2019You can also read