Engine Performance and Exhaust Emissions from a Diesel Engine Using Soy Bean Oil Biodiesel
←
→
Page content transcription
If your browser does not render page correctly, please read the page content below
An ASABE Meeting Presentation

                                                                            Paper Number: 084942

              Engine Performance and Exhaust Emissions from a
                 Diesel Engine Using Soy Bean Oil Biodiesel

Bjorn S. Santos
          Biological and Agricultural Engineering Department, Texas A&M University,
          College Station, Texas

Sergio C. Capareda, Ph. D.
          Biological and Agricultural Engineering Department, Texas A&M University,
          College Station, Texas

                                          Written for presentation at the
                                    2008 ASABE Annual International Meeting
                                              Sponsored by ASABE
                                        Rhode Island Convention Center
                                           Providence, Rhode Island
                                              June 29 – July 2, 2008

Abstract. The objectives of this study are to evaluate the performance and relate exhaust emissions
of biodiesel fuels derived from soybean oil and Standard no. 2 ultra low-sulfur diesel fuel, in a 3-
cylinder YANMAR diesel engine. Engine power tests were conducted in accordance with SAE
Standard Engine Power Test Code for diesel engines (SAE J1349 Revised MAR2008). Test fuels
included Standard no. 2 diesel and four biofuels comprising 5%, 20%, 50% and 100% soybean oil
biodiesel. Nitrogen oxides (NOx), carbon monoxide (CO), and sulfur dioxide (SO2) emissions were
measured for all the test fuels using an Enerac™ model 3000E emissions analyzer. Based on the
results of the experiments performed, the peak power produced using different blends of Soy bean
oil biodiesel has no significant difference compared to that of the petroleum diesel. However, the
brake-specific fuel consumption tends to increase as the percentage of biodiesel in a blend
increases. Such an increase can be best described by the B50 SME and B100 SME test fuels.
Furthermore, the relationship between pollutant concentrations in diesel engine exhaust and the

The authors are solely responsible for the content of this technical presentation. The technical presentation does not necessarily reflect the
official position of the American Society of Agricultural and Biological Engineers (ASABE), and its printing and distribution does not
constitute an endorsement of views which may be expressed. Technical presentations are not subject to the formal peer review process by
ASABE editorial committees; therefore, they are not to be presented as refereed publications. Citation of this work should state that it is
from an ASABE meeting paper. EXAMPLE: Author's Last Name, Initials. 2008. Title of Presentation. ASABE Paper No. 08----. St. Joseph,
Mich.: ASABE. For information about securing permission to reprint or reproduce a technical presentation, please contact ASABE at
rutter@asabe.org or 269-429-0300 (2950 Niles Road, St. Joseph, MI 49085-9659 USA).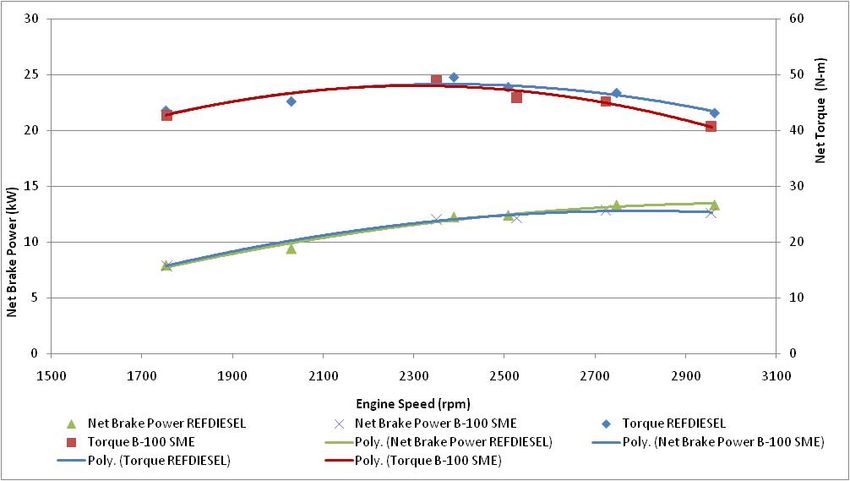
percentage of soy bean oil biodiesel in fuel blends was also determined. There was a significant
reduction in the emissions of pollutant concentrations (i.e. NOx and CO) as the percentage of
biodiesel in a blend increased.
Keywords. Biodiesel, Biodiesel blends, Biofuels, Diesel engine, Engine exhaust emissions,
Performance, Soy Methyl Ester.

The authors are solely responsible for the content of this technical presentation. The technical presentation does not necessarily reflect the
official position of the American Society of Agricultural and Biological Engineers (ASABE), and its printing and distribution does not
constitute an endorsement of views which may be expressed. Technical presentations are not subject to the formal peer review process by
ASABE editorial committees; therefore, they are not to be presented as refereed publications. Citation of this work should state that it is
from an ASABE meeting paper. EXAMPLE: Author's Last Name, Initials. 2008. Title of Presentation. ASABE Paper No. 08----. St. Joseph,
Mich.: ASABE. For information about securing permission to reprint or reproduce a technical presentation, please contact ASABE at
rutter@asabe.org or 269-429-0300 (2950 Niles Road, St. Joseph, MI 49085-9659 USA).
Introduction
One of the major advantages of biodiesel fuels is the fact that it can be used in existing diesel
engines with a modest amount of impact to an engine’s operating performance. However, in
some cases, engine performance may not be as comparable when using biodiesel to petroleum
diesel. In such a case, it would depend on the oil feedstock being used. According to Hansen et
al. (2006), torque loses 9.1% relative to Standard No. 2 Diesel from fueling the engine with
100% soybean biodiesel. Some fuel properties such as the degree of saturation of several oil
sources may have an effect on the engine performance primarily due to the heating value
differences, which will eventually have significant impact on the exhaust emissions.
According to the National Biodiesel Board (2006), one of the factors that affect vehicle fuel
economy, torque, and horsepower is the fuel’s volumetric energy content or its heating value.
The heating value of a fuel is the amount of heat released during combustion. In the U.S., the
heating value is usually expressed as British thermal units (Btu) per pound or per gallon at 60°F
(International metric [SI] units are kilojoules per kilogram or per cubic meter at 15°C). For gross
(high) heating value, the water produced by the combustion is assumed to be re-condensed to a
liquid. For the net (lower) heating value, the water remains as a gas. Since engines exhaust
water as a gas, the net heating value is the appropriate value for comparing fuels (NBB, 2006).
The heating value of biodiesel fuel is much less variable than that of petroleum diesel. And if a
biodiesel fuel meets the ASTM D 6751 standards, the heating value is more dependent upon
the feed stocks used than the particular process.
The objectives of this study are the following: (1) Evaluate the performance and (2) relate
exhaust emissions of biodiesel fuels derived from soybean oil and Standard no. 2 ultra low-
sulfur diesel fuel, in a 3-cylinder YANMAR diesel engine.
Materials and Methods
The engine performance and exhaust emissions testing were conducted at the Bio-Energy
Testing and Analysis Laboratory (BETA LAB) of the Biological and Agricultural Engineering
Department, Texas A&M University, College Station, Texas. The facility has the instrumentation
needed to measure some of the regulated emissions, such as Carbon Monoxide (CO), Carbon
dioxide (CO2), Oxides of Nitrogen (NOx), Total Hydrocarbons (THC), and Sulfur dioxide (SO2).
Test equipment
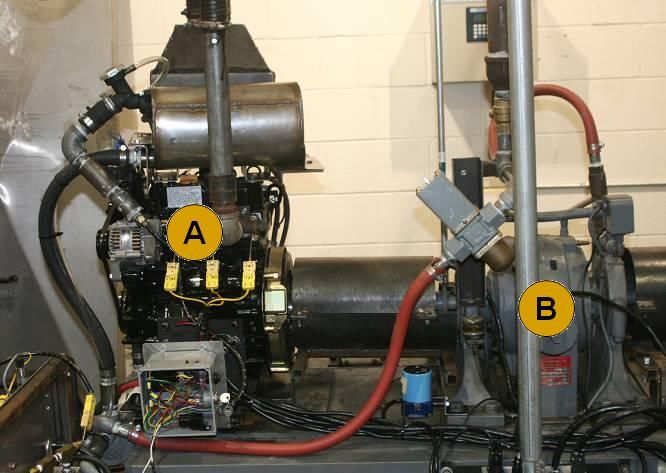
The BETA LAB has a 3-cylinder Yanmar 3009D diesel engine rated at 14.2 kW (19 Hp), which
was used for this research (Figure 1). Table 1 lists the general specifications of the test engine.
The engine load was controlled using a water-cooled eddy current absorption dynamometer
with a Dynamatic® EC 2000 controller. The maximum braking power of the dynamometer was
rated at 22.4 kW (30 hp) at 6000 rpm.
2Figure 1. The Dynamometer test system showing (A) 14.2 kW diesel engine,
and (B) the dynamometer.
Table 1. Specifications of Yanmar 3009D diesel engine
Rated Power 14.2 kW @ 3000 rpm
Number of Cylinders 3
Bore 72 mm
Stroke 72 mm
Displacement 0.879 L
Compression Ratio 22.6:1
Test Fuels
Commercially available soy methyl ester (SME) and ultra low-sulfur diesel were tested. They
were analyzed at the BETA LAB to determine if such fuels meet ASTM 6751 standard. Table 2
enumerates the properties of the test fuels. Fuels and fuel blends are as follows:
1. Standard No. 2 ultra low-sulfur diesel control fuel (REFDIESEL)
2. 100 percent soy methyl ester (B100 SME)
3. 50 percent soy methyl ester (B50 SME)
4. 20 percent soy methyl ester (B20 SME)
5. 5 percent soy methyl ester (B5 SME)
3Table 2. Test Fuel Properties.
Standard no. 2
Fuel Property B5 SME B20 SME B50 SME B-100 SME
ULS Diesel*
Gross Heating Value, MJ/kg 44.18 43.87 43.23 41.93 39.88
(Btu/lb) (18994.05) (18901.54) (18624.19) (180669.40) (17144.75)
Cloud point (˚C) -35 -34.75 -34 -32.5 -30
Flash Point (˚C) 128 131.5 142 163 198
Kinematic Viscosity (mm2/s)
2.2576 2.3364 2.5596 3.258 4.3965
@ 40˚ C
Density (kg/L at 21°C) 0.8445 0.8463 0.8515 0.8621 0.8796
Specific gravity (at 21°C) 0.8454 0.8472 0.8524 0.8630 0.8805
Acid number (mg KOH/g) 0.0373 0.0464 0.0739 0.1289 0.2204
* Ultra-low sulfur diesel
Data Acquisition Equipment and Exhaust Emissions Analyzer
Torque and engine speed data were collected using a NI LabView 8.0 program. Fuel flow was
measured using a Model 214 Piston Flow Meter, and then transmitted using a Model 294 High
Resolution, Linearized Frequency Transmitter (Max Machinery Inc., Healdsburg, CA).
Exhaust emissions, such as carbon monoxide (CO), carbon dioxide (CO2), oxides of nitrogen
(NOx), and sulfur dioxide (SO2), were determined with an Enerac™ model 3000E emissions
analyzer. The emissions analyzer has a capability of 0 to 3500 ppm NOx concentration
measurement with an accuracy of ± 2% of reading. In addition, it also measures the ambient
temperature, stack temperature, and O2 concentration of the test room. Since the analyzer is
new prior to this research, factory calibration was considered.
Experimental Method
Engine power tests were conducted in accordance with SAE Standard Engine Power Test Code
for diesel engines (SAE J1349 Revised MAR2008). The experimental framework for this
research was patterned to Powell’s (2007) work. Baseline engine performance and emissions
tests were performed using Standard no. 2 ultra low-sulfur diesel fuel. Variables such as air and
relative humidity were carefully monitored. Fuel temperature was controlled as outlined in the
test procedure. Tests were conducted in a systematically randomized order to prove that the
fuel sequence is not significant to the results of the study. There were three blocks, with each
block containing one set of tests for each fuel and fuel blend. The blocks are as follows:
Block 1 REFDIESEL, B50 SME, B5 SME, B20 SME, B100 SME, REFDIESEL
Block 2 REFDIESEL, B100 SME, B5 SME, B50 SME, B20 SME, REFDIESEL
Block 3 REFDIESEL, B5 SME, B100 SME, B50 SME, B20 SME, REFDIESEL
4The BETA LAB is equipped with a NI LABVIEW program that can perform remote-based
switching of fuel source. At each fuel change, the engine was warmed at idle speed on the new
fuel for 10 minutes to purge remaining previous test fuel from the engine’s fuel system. Then,
the engine was ran at full throttle and prepared for the next performance testing.
In order to understand the effect of the biodiesel on engine efficiency, brake specific fuel
consumption (BSFC) for B-100 SME and each fuel blend at peak brake power were measured
and compared to the BSFC of the control fuel using statistical analyses, One-way Analysis of
Variance (ANOVA) and Fisher’s Least Significant Distance (LSD) procedures, respectively.
Emissions results from the tests were then averaged.
RESULTS OF ENGINE PERFORMANCE TESTING
Basic engine performance from the test fuels was examined. All results presented in this
research were obtained from the average of the three blocks of performance tests. Figure 2
shows the performance curves for the diesel engine using Standard no. 2 ultra low-sulfur diesel
and B-100 SME. For the standard no.2 ultra low-sulfur diesel, the corrected peak brake power
was at 13.4 kW (18.0 hp) at an engine speed of approximately 2965 rpm. Consequently, at an
engine speed of 2390 rpm the peak torque was observed at 49.5 N-m (36.5 lb-ft).
Figure 2. Performance curves of the 14.2 kW diesel engine using
Standard No. 2 Ultra low-sulfur diesel and B-100 SME.
It was also observed that the peak brake power was at 12.9 kW (17.3 hp) at 2725 rpm when B-
100 SME fuel was used and it was 3.7% lower compared to the peak brake power using
petroleum diesel. Since there were no modifications in the injection rates, such power loss may
be attributed to the variation in densities and heating values of the test fuels.
The peak torque was observed at 48.9 kW (36.1 hp) at 2350 rpm, which may be comparable to
petroleum diesel with 1.2% change. Hansen et al (2006) and Peterson et al (1995), measured
5the engine performance of a diesel engine using soybean oil biodiesel, and they found similar
trend reductions in peak torque when compared to Standard no. 2 diesel fuel.
Brake specific fuel consumption (BSFC) is a good measure of an engine's efficiency. As shown
in Table 3, B50 SME and B100 SME have higher BSFCs compared to the reference diesel fuel.
The increase in BSFCs of these fuels is understandable since the biodiesel fuels have heating
values that are about 5.1% and 9.7% less than that of the reference diesel. These results were
in the same trend with the studies of Monyem (1998), McDonald et al (1995), and Canakci and
Van Gerpen (2003), who ascertained that the BSFCs for biodiesel fuels were about 13% to 14%
higher than no.2 diesel fuel.
Table 3. Average values and percentage changes in BSFC.
Test Fuel BSFC (g/kW-h) % change in BSFC
REFDIESEL 285.244389 -
B5 SME 281.6889697 - 1.24645
B20 SME 284.0386352 - 0.42271
B50 SME 294.7444105 3.330485
B100 SME 307.5007245 7.80255
The Box plots of the brake specific fuel consumption at peak brake power for B-100 SME and its
blends with REFDIESEL are shown in Figure 3. One-way ANOVA and Fisher’s LSD confirmed
that there are significant differences in BSFC’s between B100 SME and its blends to
REFDIESEL. Again, these differences can be attributed to the lower heating values of the
biodiesel and its blends.
Figure 3. Box plots of the BSFCs (g/kW-h) of
(1) REFDIESEL, (2) B5 SME, (3) B20 SME,
(4) B50 SME, and (5) B100 SME test fuels.
6RESULTS OF EMISSIONS TESTING.
Nitrogen oxides (NOx), carbon monoxide (CO), and sulfur dioxide (SO2) emissions were
measured for all the test fuels using an Enerac™ model 3000E emissions analyzer. Total
hydrocarbons (THC) emissions were not measured since the THC sensor of the analyzer
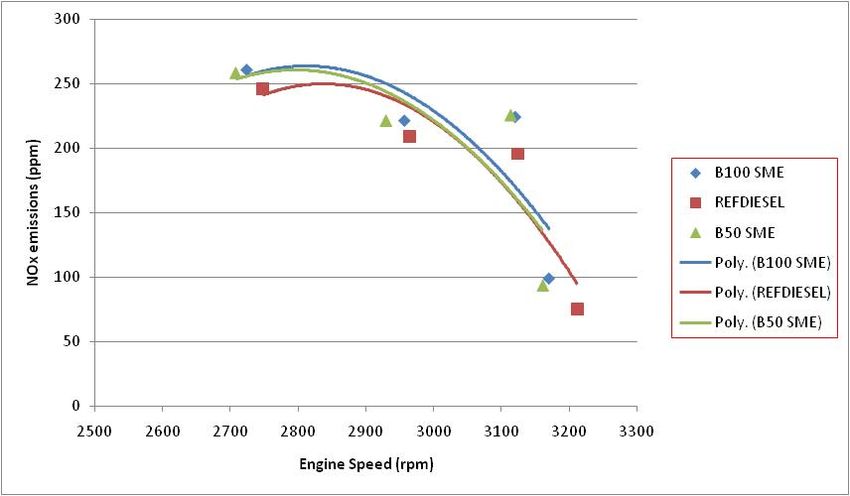
malfunctioned prior to testing. Figure 4 shows the amount of NOx produced at different engine
speeds for all biodiesel fuel blends including the Standard no. 2 ULS diesel as the reference
fuel. Based on the graph, a general decreasing trend was observed for NOx emission as the
engine speed was increased from 2700 rpm to 3200 rpm. The NOx emissions of the reference
fuel dropped by approximately 170 ppm while 160 ppm drop was noticed for B-100 SME.
The NOx emissions were higher for B100 SME and blends than the standard no. 2 ULS diesel
fuel. Compared to the reference fuel, the NOx emissions of B50 SME and B100 SME were
increased by 5.8% and 5.6%, respectively. Such increase may be associated to the oxygen
content of the biodiesel since it would have more oxygen to add up to the NOx formation.
Figure 4. NOx emissions using B50 SME, B100 SME and farm diesel.
Carbon monoxide concentrations decreased by 10% and 17% compared to diesel fuel when
B20 SME and B100 SME were used, respectively. However, an average of 15% increase in CO
concentrations was observed for B5 SME. In general, CO concentrations tended to decrease
as the percentage of biodiesel in the fuel blend increases. These results are in agreement with
Schumacher et al. (2001), who found that CO emissions decreased as biodiesel percentage in
fuel blends increased.
At peak power, CO2 emissions increased as the percentage of soy bean oil biodiesel increased.
However, there was no definitive trend found with regards to the other speeds. Sulfur dioxide
(SO2) emissions results were similar for all test fuels, at any engine speed, with readings of less
than 10ppm.
7Conclusion
The performance and exhaust emissions of biodiesel fuels derived from soybean oil and
Standard no. 2 ultra low-sulfur diesel fuel, using a 3-cylinder YANMAR diesel engine were
evaluated. Based on the results of the experiments performed, the peak power produced using
different blends of Soy bean oil biodiesel has no significant difference compared to that of the
petroleum diesel. However, the brake-specific fuel consumption tends to increase as the
percentage of biodiesel in a blend increases. Such an increase can be best described by the
B50 SME and B100 SME test fuels.
Furthermore, the relationship between pollutant concentrations in diesel engine exhaust and the
percentage of soy bean oil biodiesel in fuel blends was also determined. There was a significant
reduction in the emissions of pollutant concentrations (i.e. NOx and CO) as the percentage of
biodiesel in a blend increased.
Acknowledgements
The authors express appreciation to the Houston Advanced Research Center for sponsoring the
project. Assistance was also obtained from Xeunong Wang, visiting scholar and Jared Murdock,
Ordway Boriack and Nathan Ball, BAEN student workers, Texas A&M University.
References
Dorado, M.P., J.M. Arnal, J. Gomez, A. Gil, and F. J. Lopez. 2002. The effect of a waste
vegetable oil blend with diesel fuel on engine performance. Transactions of the ASAE.
45(3): 519-523.
EPA. 2002. A comprehensive analysis of biodiesel impacts on exhaust emissions; draft
technical report. EPA420-P-02-001. Washington D.C.: U.S. EPA, Office of
Transportation and Air Quality.
Hansen, A.C. M.R. Gratton, and W. Yuan. 2006. Diesel engine performance and NOx emissions
from oxygenated biofuels and blends of diesel fuel. ASAE Paper No. 065590. St.
Joseph, Mich.: ASAE.
McDonald, J. F., D. L. Purcell, B. T. McClure, and D. B. Kittelson.1995. Emission characteristics
of soy methyl ester fuels in an IDI compression ignition engine. SAE Paper No. 950400.
Warrendale, Pa.: SAE.
Monyem, A. 1998. The effect of biodiesel oxidation on engine performance and emissions. PhD
diss. Ames, Iowa: Iowa State University, Department of Mechanical Engineering.
NBB. 2006. Energy Content. National Biodiesel Board. Jefferson City, MO. Available at:
http://www.biodiesel.org.
NBB. 2006. Performance. National Biodiesel Board. Jefferson City, MO. Available at:
http://www.biodiesel.org.
Peterson, C. L., D. L. Reece, B. Hammond, J. C. Thompson, and S. Beck. 1995.
Commercialization of Idaho biodiesel (HySEE) from ethanol and waste vegetable oil.
ASAE Paper No. 956738. St. Joseph, Mich.: ASAE.
8Powell. Jacob. 2007. Engine Performance and Exhaust Emissions from a Diesel Engine Using
Cottonseed Oil Biodiesel. M.S. Thesis. Department of Biological and Agricultural
Engineering, Texas A&M University, College Station, Texas. December 2007.
Schumacher, L.G., Clark, N.N., Lyons, D.W., Marshall, W. 2001. Diesel Engine Exhaust
Emissions Evaluation of Biodiesel Blends Using a Cummins L10E Engine. Transactions
of the ASAE 44(6): 1461-1464.
US Department of Energy. 2004. 2004 Biodiesel Handling and Use Guidelines. US Department
of Energy, DOE/GO-102004-1999 Revised 2004.
9You can also read