Quality and health Assessment of the effects of the 1st Spanish - IIASA
←
→
Page content transcription
If your browser does not render page correctly, please read the page content below
Assessment of the effects of the 1st Spanish
 National Air Pollution Control Programme on air
 quality and health
 Air quality modelling: Effects on health and costs:
 Yolanda Lechón(1), Ana Gamarra (1),
 Marta G. Vivanco, Juan Luis Garrido,
 Fernando Martín, Mark Theobald, Eugenio Sánchez (2)
 Victoria Gil, José Luis Santiago (1) Energy Systems Analysis Unit
 (2) Software Development and
 Group of Atmospheric Pollution Computing Systems Unit
 Modelling
 CIEMAT
 CIEMAT

Measures & emission reductions estimated by:
Subdirección General de Calidad del Aire y Medio Ambiente Industrial. Ministerio para la
 Transición Ecológica y Reto Demográfico. In collaboration with TRAGSATEC

 49th TFIAM meeting 20-22 April 2020
Outline
• Brief overview of the objectives for Spain in the NEC
 Directive (EU 2016/2284) and main air quality problems

• Measures in the 1st Spanish National Air Pollution Control
 Programme (S-NAPCP)

• Expected effects of the S-NAPCP on air quality

• Expected (preliminary) effects of the S-NAPCP on health and
 the associated costs

• Conclusions
Brief overview of the objectives for
Spain in the NEC Directive (EU
2016/2284) and main air quality
problems

Overview of the
 areas with non-
 compliance during
 1-hr SO2 24-hr SO2 the period 2001-
 2017
2001 2017 2001 2017
 Reference: Air quality
 Database (Ministry for
 the Ecological
 1-hr NO2 1-yr NO2 Transition, MITECO)

 Based on observations

 health O3 vegetation O3

daily maximum value for 8-hour running mean

 1-yr PM10 24-hr PM10 1-yr PM2.5
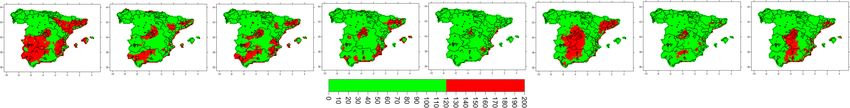
According to model & observations (M+O) estimates

 total zones
 Number of
 26th highest daily maximum value for 8-hour running mean for O3
2010 2011 2012 2013 2014 2015 2016 2017
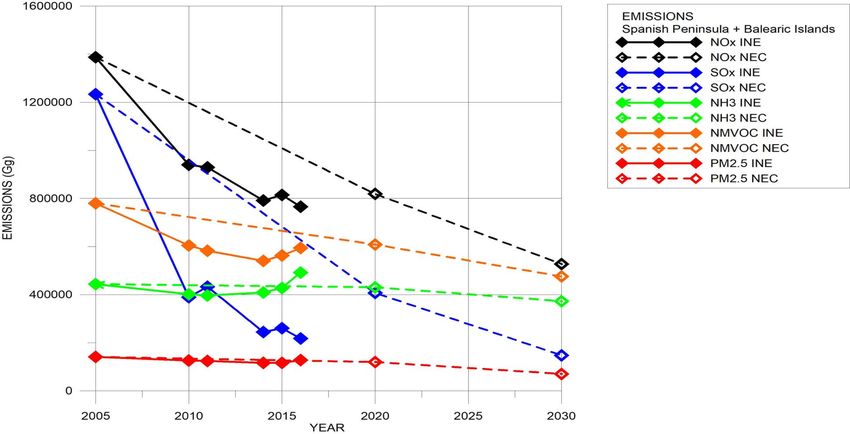
Evolution of NOx, SOx, NH3, NMVOC and PM2.5 emissions (% 2005 emissions) set in the National Emissions Ceilings Directive(NEC) (dashed lines) for Spain in 2020 and 2030. SO2 NOx NMVOCs NH3 PM2.5 2020-29 2030- 2020-29 2030- 2020-29 2030- 2020-29 2030- 2020-29 2030- 67% 88% 41% 62% 22% 39% 3% 16% 15% 50% 2005 2015 2030

Measures in the 1st Spanish National Air
Pollution Control Programme (S-NAPCP)
SERVICE CONTRACT TO CIEMAT FROM 1st Spanish National Air Pollution Control
 TRAGSATEC FOR SUPPORT ON AIR Programme for the period 2019-2022 (Approved
 POLLUTION IMPACTS on September, 27th, 2019)

Marta G. Vivanco, Mark Theobald, Juan Luis Garrido,
Victoria Gil, Fernando Martín (2019). Impact of the
reduction of pollutant emissions for 2020, 2015 and
2030 in the Spanish National Control of emissions https://www.miteco.gob.es/images/es/
Programe on air quality primerpncca_2019_tcm30-502010.pdf
Scenario WM: assuming no change to already adopted policies and
 measures
 WM

 total zones
 Number of
 Total
 number of
 zones
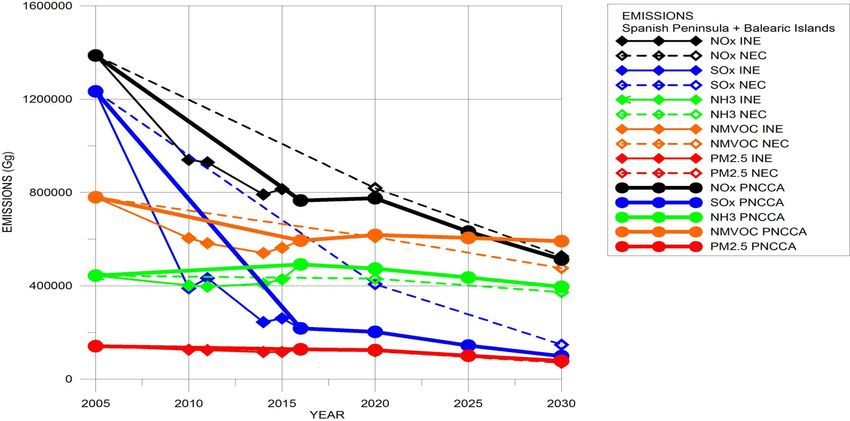
Evolution of NOx, SOx, NH3, NMVOC and PM2.5 emissions (% 2005 emissions) according to the Spanish National Inventory (INE) (2005, 2010, 2011, 2014, 2015, 2016) and in the S-NAPCP for 2020, 2025 and 2030 (scenario WAM) (solid lines) set in the National Emissions Ceilings Directive(NEC) (dashed lines) for Spain in 2020 and 2030. 2005 2015 2030
2D, 2G : Solvent and other product use
PACKAGE OF MEASURES
E.1 Energy mix

T.1 Emission reductions for road transport, rail, aviation and shipping

I.1 Improved energy efficiency in the industrial and manufacturing sectors

EE.1 Improved energy efficiency in the residential, commercial, institutional
 and other sectors
RS.1 Waste
A.1 Use of fertiliser plans
A.2 Reduction of emissions from burning prunings
A.3 Manure and housing management for cattle, pigs and poultry
 Reduction of emissions from residential wood burning
O.1
O.2 Reduction of emissions from the domestic use of solvents and paints
O.3 Analysis of the potential pollution from small and medium
 combustion plants
O.4 Reduction of harbour emissions
O5 Public awareness raising
The Spanish National Air Pollution Control Programme considers 13 packages with 57 measures (8 of these packages are included in the projected emissions; for 5 of them the emission reductions are not yet estimated) E.1 Energy mix New renewable energy installations Integration of renewable energy into the grid Self-production and distributed generation Increased use of renewable gases Refurbishment of existing renewable energy installations Power purchase agreements between energy provider and consumer Specific programs for biomass use Unique projects and renewable energy for islands T.1 Emission Advanced biofuels for transport reductions for Changes in mode of transportation road transport, More efficient use of transport rail, aviation and Fleet renewal shipping Promotion of electric vehicles Refueling/recharging points for alternative fuels
I.1 Improved energy Support for industry efficiency in the Framework for the development of renewable thermal industrial and technologies manufacturing Improvement of the technology and management sectors systems for industrial processes EE.1 Improved energy Integration of renewable thermal technologies efficiency in the Subsidies for installations in buildings and heating residential, networks commercial, Improved energy efficiency in the residential sector institutional and Renewal of installations in residential buildings other sectors Improved energy efficiency in public buildings and the tertiary sector Improved energy efficiency of large heating/air conditioning systems in the tertiary sector and public infrastructure Improved energy efficiency of agricultural installations, irrigation communities and agricultural machinery
RS.1 Waste Increased domestic and community composting Renovation of composting infrastructure Separation of biowastes for biomethanisation Reduction of food waste Increased paper collection in the municipal channel Increased collection of domestic cooking oil Increased collection of textiles Use of oxidising covers on landfill sites A.1 Use of Set a limit of 30% of plant N requirements by urea fertiliser Set conditions for urea application plans Ban the surface application of slurries and other substances with a water content > 40% Low emission application technologies Incorporation of solid organic fertilisers following application Use of fertilizer plans Soil nitrogen balance calculations Inclusion of environmental objectives in fertiliser plans Registro de operaciones en el cuaderno de explotación Registering activities in the farm log book
A.2 Reduction of Incorporation of prunings into vineyard and orchard soils emissions from instead of burning them burning prunings Reduction of the burning of olive prunings A.3 Manure and Multiphase feeding of livestock housing Frequent manure removal (twice per week) in existing management for breeding quarters of pigs and cattle cattle, pigs and Reduction of ammonia emissions by at least 60% with poultry respect to the reference technology in new and highly- modified pig and cattle installations Reduction of ammonia emissions by at least 30% with respect to the reference technology in existing poultry installations Reduction of ammonia emissions by at least 70% with respect to the reference technology in new and highly- modified poultry installations Reduction of ammonia emissions by at least 40% with respect to the reference technology in existing pig and cattle installations Reduction of ammonia emissions from manure storage by at least 80% with respect to the reference technology in new and highly-modified pig and cattle installations
Target measures (not included yet in the WAM scenario) O.1 Reduction of Reduce fine particulate emissions from fire and emissions from stove wood burning in rural areas residential wood burning O.2 Reduction of Responsible use of domestic of solvents and paints emissions from the domestic use of solvents and paints O.3 Analysis of the Analysis of the potential pollution reduction for potential pollution small and medium combustion plants (between 500 from small and kW and 50 MW) medium combustion plants O.4 Reduction of Reduction of harbour emissions harbour emissions O.5 Public awareness Public awareness raising raising
2030
 E.1

 T.1

 I.1

EE.1
 NMVOC
RS.1
A.1

A.2

A.3

 18
Expected effects of the S-NAPCP
 on air quality
Methodology

• CHIMERE model. Domain covering the Iberian Peninsula at 0.1 ° x 0.1 °
 (extending to the North) nested in a European domain at 0.15° x 0.15°
• Simulation of 2016 (base), 2020, 2025 and 2030.
• ECMWF-IFS meteorology for 2016
• Fixed global model conditions for all the scenarios
• Estimation of non-compliant zones:
 Correction of model results ; example for 2030
 2030
 2030, = 2030 + 2016
 MC: model concentration 2016
 R2016 : MC – OC OC: observed concentration

 Limitations
• Model resolution (~10kmx10km)
• Fixed meteorology (2016)
• Fixed boundary conditions; Fixed emissions for other countries, international maritime
 traffic
• Emissions reduction applied at 3rd level of SNAP categories uniformly on the national
 territory 2016
• PM10:
 , reductions
 = only
 + for the fine fraction (PM2.5)
• Correction of model results in2016
 future scenarios to estimate non-compliant zones:
 potential overestimation of future concentration
Total

zones
number of

 Number of
 total zones
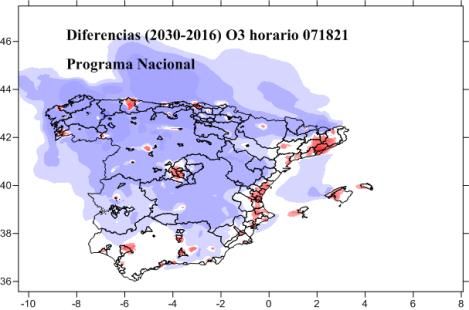
26th highest daily maximum value for 8-hour running mean for O3 (M+O)
 Relative differences Total differences

 2020

 2016 Scenario WAM

 2025

 2030
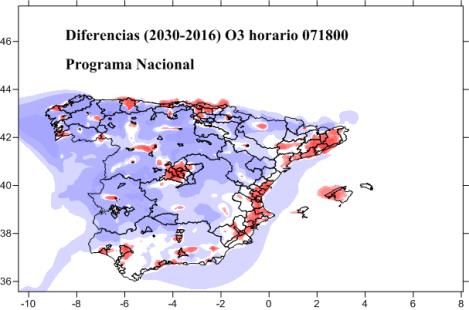
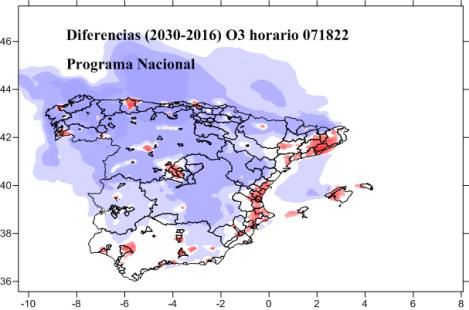
O 3 NO NO 2 O 2 NO O3 3:00 4:00 5:00 6:00 7:00 8:00 13:00 14:00 NO2 hυ NO O O O 2 M O3 M NO2 O3 19:00 20:00 21:00 22:00
Annual terms: In areas with high NOx levels and with an important titration
effect (that reduces O3), a decrease of NOx emissions will reduce titration
reaction, which can lead to higher O3 levels in the night, and thus higher
annual levels of O3 (less O3 destroyed in the night) . Also affecting max 8-hr,
SOMO35

Not for the max 1-hr : the reduction of NOx emissions at higher-radiation
hours reduces O3 formation, so an improvement of air quality is more
frequently found.

More in depth in the TFMM. Check with another chemical mechanism.
Expected (preliminary) effects of the
 S-NAPCP on health and the associated
 costs

Retos-AIRE: AiR pollution mitigation actions for EnvironmenTal
pOlicy Support. AIR quality multiscale modelling and evaluation
of hEalth and vegetation impacts
 RTI2018-099138-B-100
 Plan Nacional I+D+i
Effects on health & Cost Benefit Analysis
 Benefit
 2 scenarios: 1) 2016 2) WAM-2030
 WM2030
 WAM2030

 MODEL Estimation of effects
 Pollutants Concentration External Costs
 concentration Response Functions
 PM, NO2, O3 (WHO )

 Health Impact Assessment and Cost Benefit Analysis. Implementation of the HRAPIE
 Recommendations for European Air Pollution CBA. M. Holland - EMRC (2014)
 GIS Spatial distribution/allocation (model grid)
 Analysis
 Health Staticstics and National Health Survey
 for
Population
 (INE, 2026), data by regions, 2 administrative levels
 Population
 +
 Mortality
 +…
 Prevalence of
 data Other data: WHO DB database (spatial asthma in children
 >30 years
 distribution) 5-14 years
Health effects
NO2 O3
Impacts on O3 are
estimated
considering
SOMO35..
Impacts on O3 are estimated considering SOMO35..
Health effects
PM10 PM2.5
 WAM 2030
WAM 2030

 Avoided costs
 51244 MEuro

7746 MEuro

 VOLY Value of Life Value of a
 VOLYapproach
 approach year Lost
 VSL
 VSLapproach
 approach Statistical Life
Some conclusions I
Emissions and impacts on air quality:

• The scenario WAM achieves the target emissions reductions set in the NEC
 Directive for Spain in 2030 for all the pollutants except for NMVOCs, for which
 there is a reduction of 30% versus the 39% in NEC Directive.

• General improvement of air quality for the WAM scenario. No further non-
 compliant air quality zones for annual NO2 and PM10 indicators.

• Ozone will still produce non-compliant areas (from 42 in 2016 to 31 in WAM-
 2030 (max 8-hr); from 22 to 6 (O3 1-hr)), with reductions of 32.9% of NOx
 emissions )

• The reduction of NOx reduces the removal of O3 by titration, leading to
 increased concentrations of O3 over areas with high NOx emissions in the
 night (Madrid, Barcelona). During the hours with high solar radiation, there is
 a reduction of O3 over these areas. Thus there are different net effects
 depending on the O3 metric.
Some conclusions II
Impacts on health:

• There is an improvement of impacts on health for the scenario WAM 2030
 for the whole studied area, specially considering NO2 and PM2.5.
 Nevertheless, for specific cities (Madrid, Barcelona) health effects for O3
 could present worse results, as the SOMO35 presents higher values in WAM
 2030 (more studies on-going to study these cities individually).

• Monetary valuation of total health effects shows benefits from adopting the
 additional measures in WAM 2030 ranging from around 7746 to 51244
 Million Euro (depending on how mortality impacts are valued).
Limitations:

• Variation of meteorology has not been considered. We are addressing this
 point in the Retos-AIRE project (other years, climate meteo for 2030)

• Reductions of other countries should be considered to account for 2030
 boundary conditions. Also for the international maritime traffic (high in the
 Mediterranean area)
Some conclusions III

• The correction applied to address the underestimation of peaks over
 urban areas could be producing an overestimation of O3 peaks in 2030
 and consequently an overestimation of impacts on health.

• Benefis from PM10 emission reductions (air quality , health, costs) are
 underestimated due to the lack of information about the emission
 reduction in the PM2.5-10 fraction (the inventory includes emissions for
 this fraction in the agriculture sector.

• Population has not been extrapolated. Benefits could be overestimated.

• The use of Concentration Response Functions adapted to the Spanish
 conditions could be benefitial (collaboration with the ISCIII, Spain)
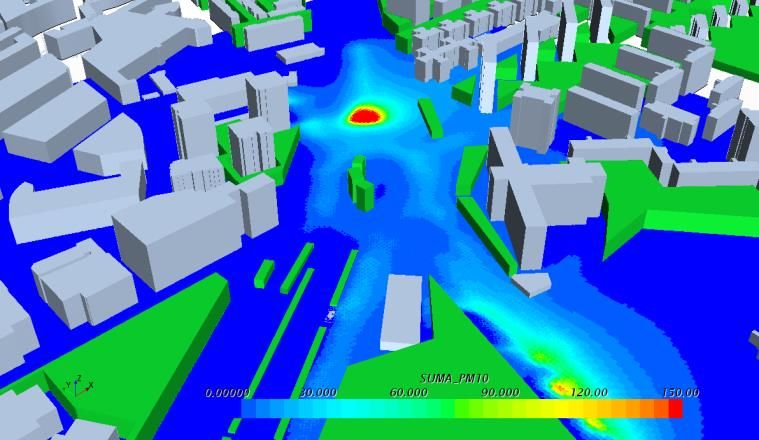
Some conclusions IV
• Higher resolution should be used for urban areas (Retos-
 Aire project) to estimate air quality and population
 exposure more accurately.
 Retos-AIRE: AiR pollution mitigation actions Plaza Elíptica
 for EnvironmenTal pOlicy Support. AIR
 quality multiscale modelling and evaluation
 of hEalth and vegetation impacts
 RTI2018-099138-B-100
 Plan Nacional I+D+i

• Zooms in some cities, at 1km x 1km
 with CHIMERE and with CFD models
• Assessment of individual measures
• Risk assessment of N deposition in
 the Natura 2000 network
Thank you for your
 attention!
[Atmosphere] (ISSN 2073-4433, IF 2.046) . Special Issue "Air
Pollution in Europe: Source Apportionment, Trends, and
Emission-Reduction Measures“
 Please contact me if you want to participate
 m.garcia@ciemat.es

Thanks to the project Retos-AIRE (Plan Nacional I+D+i RTI2018-
099138-B-100) financed by the Ministry of Science and
Innovation
You can also read