Euspen's 21st International Conference & Exhibition, Copenhagen, DK, June 2021
←
→
Page content transcription
If your browser does not render page correctly, please read the page content below
euspen’s 21st International Conference &
 Exhibition, Copenhagen, DK, June 2021
 www.euspen.eu

Behaviour of porous aerostatic bearings with various restrictor permeabilities

Maria Hübner2, Mikael Miettinen1, Valtteri Vainio1, Christian Cierpka2, René Theska2, Raine Viitala1
1
Aalto University, 2TU Ilmenau

maria.huebner@tu-ilmenau.de

Abstract

Aerostatic bearings are externally pressurized gas lubricated bearings. Aerostatic bearings are used in high speed and precision
motion applications due to low friction and high accuracy. They use a restrictor to limit the flow of the gas into the bearing gap. The
presence of the restrictor increases the stability of the bearing against self-excited vibrations. This study focuses on porous graphite
restrictors and the effect of permeability on the behaviour of the bearing.
The bearings were studied both experimentally and with a simulation model. Flat bearing pads with 37 mm diameter and different
restrictor bulk permeability were manufactured and tested.
 Experimental measurements were conducted on a test setup allowing loading of the bearing against a ground steel plate. The load
was supplied with a series of weights. The air gap was measured with a linear length gauge, measuring the displacement of the air
bearing. The pressure was controlled with a regulator and the flow rate into the bearing was measured.
 In order to build an accurate simulation model, the permeability of the used material was calculated from the measured short
circuit flow through each 4.5 mm thick sample. The flow in the porous material and in the restrictive layer follows Darcy’s law, the
flow in the air gap is described by the Navier-Stokes-equation. The simulation model was validated with experimental results.
 Measurement and simulation results include the air gap height, load and flow rate at a supply pressure of 0.4 MPa. According to
previous research and preliminary results the surface restrictor layer has increased the resistance of the bearing to self-excited air-
hammer vibration, leading to a higher load capacity.

Aerostatic bearing, porous restrictor, restrictive layer

1. Introduction 2. Methods

 Aerostatic bearings are commonly used in precision motion The structure of the investigated bearing is shown in Figure 1,
and positioning applications. Aerostatic bearings have low and the dimensions shown are explained in Table 1. The bearing
friction, high positioning accuracy, no stick-slip phenomenon consists of an aluminium body and the porous restrictor, and the
and tolerate high operating speeds. However, the bearings have commercially available bearing has an additional restrictive
a relatively low load capacity. The bearing is lubricated by layer. The external pressure supply distributes the inlet air to the
externally pressurized gas that is fed into the bearing gap porous restrictor through the inlet grooves. The air flows into
through a restrictor. A restrictor restricts the flow of the air the bearing gap through the porous restrictor and flows out of
entering the bearing gap and improves the stiffness of the the gap to the ambient atmosphere.
bearing and reduces the air consumption. Common restrictor
types include orifices, grooves, slots and porous materials.
 Aerostatic bearings with porous restrictors are preferred to
orifice-fed bearings as they offer higher load capacity and high
stiffness over a large range of air gap height as shown by, for
example, Fourka and Bonis [1].
 Different studies to determine the design parameters
affecting the performance of porous aerostatic bearings have
been made [1-9] and were reviewed by Gao et al. [10].
 One parameter that influences load capacity and stiffness is
the permeability of the porous material. Fourka and Bonis found Figure 1. Cross-section of the investigated bearing.
that the permeability has to be smaller than 10-12 m2 to achieve
a good performance. They performed an in-silico study of The bearing was investigated numerically and experimentally
permeability in different orders of magnitude, in order to get a with the focus on the static stiffness and load capacity to
basic understanding of the influence of the permeability. [1] develop a robust simulation model with a good understanding
 In this paper, three in-house manufactured porous bearings of the influence of the permeability.
from commercially available graphite materials and one
commercially available porous bearing were investigated. The
results were used to validate a simulation model, which enables
further parameter studies.
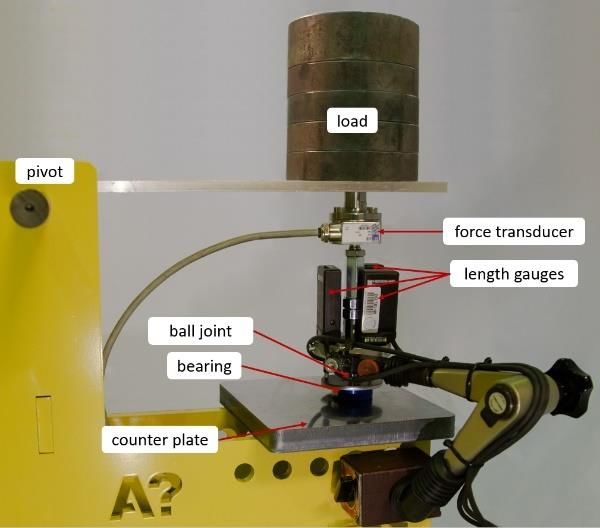
Table 1. Dimensions of the investigated bearing. dynamics’ in the porous domain. This results in a total amount
 Dimension Description Value (mm) of 751290 elements.
 D Diameter of porous restrictor 37.0 The following assumptions and boundary conditions were
 D1 Outer diameter of outer 30.0 used in the simulation:
 groove - Air as fluid at isothermal conditions, ∞ = 20 °C
 D2 Outer diameter of inner 17.5 - Gravitational forces neglectable

 groove - Weakly compressible flow (Mach number = < 0.3)

 ℎ
 h Height of porous restrictor 4.5 - Laminar flow (Reynolds number = < 10)

 gh Height of groove 1.8 - Pressure-driven flow, with inlet pressure ∆ = , −
 gw Width of groove 3.0 = 0.4 MPa and ambient pressure = 0.1 MPa
 - No-slip-boundary-condition at all outer walls and the
 In the numerical simulation, the air gap was set between 1 and counter plate
25 µm. The load was calculated with the resulting pressure - Interface between porous domain and free flow has
distribution in the air gap at the counter plate and the volume continuous pressure and velocity fields, which implies a
flow was calculated with the velocity profile at the edge of the stress discontinuity [12]
bearing. On the contrary, the experimental measurements were
conducted with a set load between 6 and 360 N and the resulting
air gap and volume flow at the inlet were measured. 2.2 Measurement setup
 The measurement setup, shown in Figure 3, loaded the
 investigated bearings (see Table 2) against a ground steel plate.
 The setup allowed measurement of the gap height, air
 consumption and load capacity of the investigated bearings. The
 bearing was loaded using a series of weights and the amount
 was changed to vary the load.

Figure 2. 2D simulation model of porous bearing.

2.1 Simulation model
 The simulation model for the bearing consists of the porous
domain in the restrictor of the bearing and the air gap between
the bearing and the counter plate as shown in Figure 2.
 The flow through a porous material is defined by the pressure

loss and is described by Darcy’s law as stated in eq. (1)

 ⃗ = − (1)
 Figure 3. The measurement setup.
with the velocity of the fluid ⃗, the dynamic viscosity of the fluid
 and the specific permeability . The latter one is independent Table 2. Three of the four investigated bearings were manufactured in
of the fluid properties but depends on the geometry of the house. The dimensions of the in-house bearings match the dimensions
porous material. In the case of a single-phase flow the specific of the commercial bearing. The graphite restrictor was mounted to the
permeability equals the permeability of the porous material. aluminium housing with an epoxy resin. The surface of the bearing was
 lapped with 6-micron abrasive film.
 In the case of a laminar flow with non-linear drag coefficient,
which can be assumed with a Reynolds number in the range of Bearing Graphite material
1-10, eq. (1) is extended by the Forchheimer equation: 1 AXM-5Q, POCO Material (USA)
 1 2 TM1, POCO Material (USA)
 = − ⃗ − −2 | ⃗| ⃗ (2)
 3 Q70, Meusburger Georg GmbH & Co KG (Austria)

 1.75 4 commercially available bearing S104001 from New
 = ⋅ −3/2 (3)
 √150 Way Bearings (USA)
with the density of the fluid and the Forchheimer coefficient
 , shown in eq. (3). Latter depends on the porosity of the The measurement setup used a NI USB-6215 DAQ device to
restrictor. [11] control the pressure regulators and record the measurements.
 The flow in the air gap is described by the Navier-Stokes The air consumption was measured with a SMC PFM510 flow
equation for the stationary case without additional forces: meter at the inlet, the load capacity was measured with a HBM
 ⃗ ⋅ ( ⃗) = − + ( 2 ⃗) (4) U2B force transducer and AE 101 amplifier, and the gap height
In this study, the commercial software COMSOL 5.4 with the between the bearing and the counter plate was measured with
‘free and porous media flow’ interface was used. It is based on three Heidenhain MT-12 length gauges. The range and accuracy
the finite element method. The simulation model is 2D axis- of each measurement device can be found in Table 3.
symmetric to reduce computational requirements. The mesh Three length gauges were used to neglect the effect of the
was studied in a refinement study. The resulting mesh consists bearing tilting during the measurement. The displacement of the
of 5 layers in the z-direction of rectangular elements in the air three gauges was averaged and compared against the reference
gap and of a free triangular mesh with the setting ‘finer for fluid measurement with the bearing air supply turned off.
Table 3. Range and accuracy of measurement devices. The static stiffness of the bearing, which was calculated using
 Device Range Accuracy eq. (5), is presented in Figure 6.
 NI USB-6215 -10 − 10 V ±2.690 µV
 SMC PFM510 0.2 − 10 l/min ±3 % F. S.
 HBM U2B (5kN) Calibrated for 600 N ±1 % F. S.
 HBM AE 101 -10 − 10 V ±1 % F. S.
 Heidenhain MT-12 12 mm ±0.5 µm

 Each bearing was measured 5 times to investigate the
repeatability of the measurement and the standard uncertainty
 ( ̅ ) of type A was calculated.
 The measurements were carried out with the following
procedure:
 1. The investigated bearing was placed on the steel plate
 and the loading arm was put in place.
 2. The displacement of the bearing was measured to set
 the reference point for the air gap measurement.
 3. All weights were placed on top of the bearing.
 4. The load was decreased in steps and the displacement Figure 4. Load capacity in relation to the gap height at 0.4 MPa bearing
 supply pressure. Measurement points are marked with stars and dashed
 and air consumption was measured at each step.
 lines. Solid lines depict the simulated results. Graph 2S is hidden behind
 5. After measurements, the air supply was turned off and 3S. Error bars represent the standard uncertainty of the measurement.
 the next bearing sample could be measured, starting The abbreviations in the legend stand for M – measured, S – simulated
 from step 1. and S* - simulated with restrictive layer.

2.3 Data processing
 To calculate the static stiffness , the graphs of the load
capacity over the air gap height ℎ were derived with

 = . (5)
 ℎ
The permeability was determined with eq. (6) from the
measured short circuit flow . The short circuit flow is the free
flow into the ambient atmosphere, measured at the desired
supply pressure.
 8∙ ∙ ∙ℎ∙
 = 2 2 2 , (6)
 ∙ ∙( , − )
where ℎ is the thickness of the porous material, is the
absolute ambient pressure and , is the absolute supply
pressure. The measured permeability was used in the simulation
model. For the case of bearing 4 with an additional restrictor
layer this reduces the two different permeabilities to one value. Figure 5. Volume flow in relation to the gap height. Measurement
 points are marked with stars and dashed lines. Solid lines depict the
This was addressed in a separate model with two porous simulated results. Graph 2S is hidden behind 3S. Error bars represent the
domains, for which the bulk permeability was measured standard uncertainty of the measurement. The abbreviations in the
separately and the resulting permeability in the restrictive layer legend stand for M – measured, S – simulated and S* - simulated with
was calculated. restrictive layer.

3. Results

 The presented preliminary results were measured at a relative
bearing supply pressure of 0.4 MPa.
 The permeability of the graphite restrictor in each bearing was
determined with the measurement of the short circuit flow. The
permeabilities, calculated using eq. (6), are presented in Table 4.

Table 4. Permeability of the investigated bearings. Bearings 1-3 are
manufactured in-house and bearing 4 is a commercially available
bearing, the porosity for it is calculated.
 Bearing h Porosity Permeability at 0.4 MPa
 (mm) (%) (m2)
 1 4.49 0.23 (0.710 ± 0.0515) ∙ 10−15
 2 4.43 0.2 (1.768 ± 0.1283) ∙ 10−15
 3 4.48 0.2 (1.764 ± 0.1279) ∙ 10−15 Figure 6. Static Stiffness in relation to the gap height. Dashed line is used
 4 4.50 0.33 (1.052 ± 0.1279) ∙ 10−15 for measurement results and solid line is used for simulation results.
 Graph 2S is hidden behind 3S. The abbreviations in the legend stand for
 The load capacities of the investigated bearing are presented M – measured, S – simulated and S* - simulated with restrictive layer.
in Figure 4, and the volumetric flow rates at corresponding gap
heights are presented in Figure 5.
4. Discussion exponential fit. Based on the numerical curves and the fit of the
 experimental data, it is possible to assume a proportional
 The present study compares the performance of aerostatic increase of the load capacity as well as the volume flow with
bearings with various restrictor permeabilities. increasing permeability.
 The measured load agrees fairly well to the simulated load for To achieve a better agreement between the numerical and the
bearings 1, 2 and 4 (Figure 4). During the measurements of experimental results, the assumptions for the numerical
bearing 2 and 3, audible vibrations occurred. The vibration was calculations must be reviewed. As the numerical solution is
presumably the self-exited air-hammer phenomena [13]. The based on perfect surface qualities, dimensions and
increased uncertainty of the measurements of those bearings, measurements, it increases the disagreement between
shown by the uncertainty bars in Fig. 4 and 5, is an effect of the numerical and experimental results. If possible, surface
vibration. roughness of both counter plate and bearing should be included
 The results in Figure 6 suggest, that the stiffness of the in the model, as well as measured in the experimental setup.
bearings increases significantly at low air gap height or that the Further studies should focus on the effect of manufacturing
bearing contacts the counter plate at high loads. This occurs at errors on the performance of the bearing and to decrease the
350 N and 260 N, for the bearings 1 & 2 and 3 & 4, respectively. uncertainties of the measurements by improving the
The experimentally determined stiffness of bearings 1-3 measurement setup.
approaches the same value from 10 µm onwards, whereas The following improvements could reduce the measurement
bearing 4 has a larger curvature and agrees better with the uncertainties:
numerical data. - Replacing the pivot by a flexure and thus eliminating
 In Figure 5, the measured flow rates are larger than the friction from the system.
simulated by a factor of 3. Presumably the difference originates - Replacing the ball joint with a flexure to enable angular
from some error in the simulation, as the measured values and tilting movement without friction.
correspond to the ones provided by the manufacturer of the - Increasing the stiffness of the measurement frame and
commercial bearing. Possible error sources are the calculation the counter plate to avoid deflection in the measurement
of the permeability, leakage of the real bearing or the path.
assumption of weakly compressible flow. Further investigation - Polished surface with high surface quality for the counter
will be carried out to determine the concrete influences. plate for accurate measurement of the air gap height.
 The commercially available bearing, denoted with number 4,
has an added surface restrictor layer, while the in-house made References
bearings have none. The simulation model with the surface layer
is closer to the measured results than the model without the [1] Fourka M and Bonis M, Wear 210 311-317
surface layer. [2] Cui C and Ono K, 1997 Transactions of the ASME 119 486-492
 The comparison regarding the permeability of the bearings is [3] Gururajan K and Prakash J, 1999 Transactions of the ASME
difficult, as the measurement uncertainties are high in 121 139-147
 [4] Yoshimoto S and Kohno K, 2001 Journal of Tribology 123.3
comparison to the differences between the load capacity. It can
 501–508
be seen that the volume flow rate highly depends on the [5] Schenk C, 2007 Dissertation Technische Universität Ilmenau (in
permeability, with an increase of the volume flow rate with german)
increasing permeability. [6] Otsu Y, Miyatake M, Yoshimoto S, 2011 Journal of Tribology
 The measurement setup produced systematic uncertainties to 133 011701-1 - 10
the measurement results. These uncertainties were due to e.g. [7] Huang T, Hsu S, Wang B and Lin S, 2014 Key Engineering
the insufficient stiffness of the counter plate, resulting in a Materials 625 384-391
deflection in the range of a few micrometres under the [8] Heidler N, 2015 Dissertation Universitätsverlag Ilmenau (in
 german)
measurement load. The negative gap heights visible in the
 [9] Cui H, Wang Y, Yue, X, Huan M and Wei Wang, 2017 Tribology
results are presumably a result of the measurement setup International 115 246-260
deforming or due to movement of the bearing. Additionally, the [10] Gao Q, Chen W, Lu L and Cheng K, 2019 Tribology International
ball joint introduces a moment to the bearing, as the friction in 135 1-17
the joint increases as the load on the bearing increases. [11] Nield D A and Bejan A, 2017 Springer International Publishing,
 1-19
5. Conclusion [12] Bars M L and Worster M G, 2006 J. Fluid Mechanics 550 149-
 173
 The present study investigated the effect of the restrictor [13] Jacob J S, Yu J J, Bently D E and Goldman P, 2001 Int. Symp. on
 Stability Control of Rotating Machinery
permeability on the load capacity, gap height, and air
consumption of porous aerostatic bearings with 37 mm
diameter. Three custom bearings with varying restrictor
permeability and one commercially available bearing were
compared.
 The investigation consisted of an experimental study and a
numerical simulation based on the measured permeability of
the bearings.
 The compared parameters include the load capacity, volume
flow rate and static stiffness of the bearing. It was shown that
there are some differences between the numerical and the
experimental results especially in the volume flow rate, but the
qualitative behaviour is visible for both approaches.
 Due to occurring vibrations in the measurement of bearing 2
and 3, a proportional relation between the permeability and the
measured load or volume flow can only be assumed from the
You can also read