Nitrogen Fleet Information - Description Fleet Savings Examples Listing of Fleets Using Nitrogen Citrus County, FL Letter New York City Transit ...
←
→
Page content transcription
If your browser does not render page correctly, please read the page content below
Nitrogen Fleet Information
Description                                Page
Fleet Savings Examples                     2
Listing of Fleets Using Nitrogen           3
Citrus County, FL Letter                   4
New York City Transit Report               5
Exxon-Mobil Study                          15
Canadian Fleet Study                       36
Fleet Savings Examples with Nitrogen Tire Inflation
Tire manufacturers and industry studies conducted on Nitrogen for tire filling agree that under-inflated tires
waste between 2% and 4% of fuel due to increased rolling resistance. Tires inflated with Nitrogen maintain
correct pressure longer than air-inflated tires – up to 5 times longer, which reduces rolling resistance and lowers
fuel consumption. Studies also conclude that approximately 25% longer tire tread wear can be achieved by
removing the Oxygen (oxidation) from inside the tire casing, as well as keeping them properly inflated. Under-
inflated tires wear faster. Additionally, 20 lbs of CO2 emissions are saved for each gallon of fuel not consumed.
These excess costs may be now be recouped. The following examples illustrate the annual savings potential for
fuel and tires by switching to high-purity Nitrogen for your fleet.
Fuel Cost Assumptions
20,000 average miles per year per vehicle
15 miles per gallon
$2.25 average fuel cost per gallon
1,333 average gallons per vehicle per year (20,000 miles ÷ 15 mpg)
$3,000 average fuel cost per vehicle per year (1,333 gallons x $2.25)
Tire Cost Assumptions
$90 average cost per tire
20,000 average road miles per tire
1 average tires per vehicle per year – single tire (20,000 miles ÷ 20,000 road miles per tire = 1)
4 average tires per vehicle per year – total vehicle (1 average tires per vehicle – single tire x 4 tires = 4)
$360 average tire cost per vehicle per year (4 tires per vehicle x $90 per tire)
Current Annual Cost Summary
Current annual fuel cost per vehicle per year $3,000
Current annual tire cost per vehicle per year $360
Current average annual cost per vehicle $3,360
Savings Range
Projected Fleet Savings
Minimum Average Maximum
FUEL SAVINGS PER VEHICLE 2% 3% 4%
Projected Savings per Vehicle $60 $90 $120
TIRE SAVINGS PER VEHICLE 15% 25% 35%
Projected Savings per Vehicle $54 $90 $126
OVERALL SAVINGS PER VEHICLE 3.4% 5.4% 7.3%
Projected Savings per Vehicle $114 $180 246
PROJECTED FLEET SAVINGS:
300 Vehicles $34,200 $54,000 $73,800
500 Vehicles $57,000 $90,000 $123,000
1,000 Vehicles $114,000 $180,000 $246,000
2,000 Vehicles $228,000 $360,000 $492,000
3,000 Vehicles $342,000 $540,000 $738,000
4,000 Vehicles $456,000 $720,000 $984,000
5,000 Vehicles $570,000 $900,000 $1,230,000
8,000 Vehicles $912,000 $1,440,000 $1,968,000
10,000 Vehicles $1,140,000 $1,800,000 $2,460,000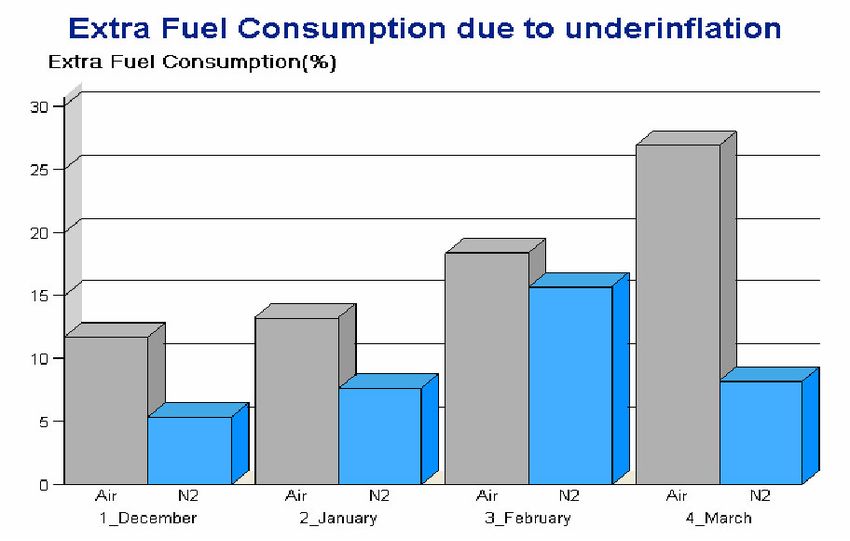
Following is a partial list of fleets which are working with Nitrogen Tire Inflation: REPRESENTATIVE MUNICIPAL FLEETS REPRESENTATIVE PRIVATE FLEETS West Palm Beach Transit Westchester County Police Department Westchester Dept. of Public Works Brothers Auto Transport Oahu Transit Services Inc. Adams Motor Express City of Allentown, PA Wood County Bandag Lehigh County, NY Winnipeg Motor Express NYC Transit Harris Transport USPS Air Products & Chemicals Broward County, FL Sheriff’s Office Kraft Foods Citrus County, FL Larsen Trucking Inc. Pearland School District, TX Ajax Paving Coconut Creek, FL Aberdare Cables Jefferson County, FL Drexan Corporation Canyon County, ID LCT Transportation Services City of Milwaukee, WI PJAX Freight System, Fairfax County Police Department, VA Gibsonia, PA Richardson, TX Pete Larsen Trucking, Euless, TX Greenville, Mi US Air Force Colorado State Penal System

Board of County Commissioners
                              Office of Fleet & Transportation Management
                                     1300 S. Lecanto Hwy., P.O. Box 215
                                           Lecanto, Florida 34460

                                  (352) 527-7626         FAX (352) 527-7625

July 28, 2009

Re:    Purigen98 Nitrogen Tire Inflation

To Whom It May Concern:

Citrus County Fleet Management participated in a controlled test with Florida
Atlantic University utilizing the Purigen98 Nitrogen Tire inflation system. The test
lasted approximately 10 months and involved our ½ ton pick-up trucks. We
compared 28 trucks filled with Nitrogen with an equal number of the same class of
truck that was filled with ambient air.

I have seen many articles touting the advantages of filling tires with Nitrogen.
Unfortunately all of the tests were done with long haul trucking companies. I was
skeptical of the benefit for the every day, local driving. I was eager to participate in
this test to determine if there was any advantage of Nitrogen on your standard
work truck.

After 10 months of test data, the results were surprising. We documented an
increase in mpg of 5.1% over the control group filled with ambient air. We had an
increase in mpg of 4.6% in the test group compared to the same period last year.
The only negligible change made to the two groups was the tire fill.

Citrus County used the Purigen98 Mobiflator M6324 unit. This system was easy to
operate and had four hoses to inflate quickly. The technicians appreciated the
ease of operation. We are now looking forward to filling the rest of our fleet with
Nitrogen to maximize our fuel savings.

Regards,

Michael R. Webster
Director
Office of Fleet & Transportation Management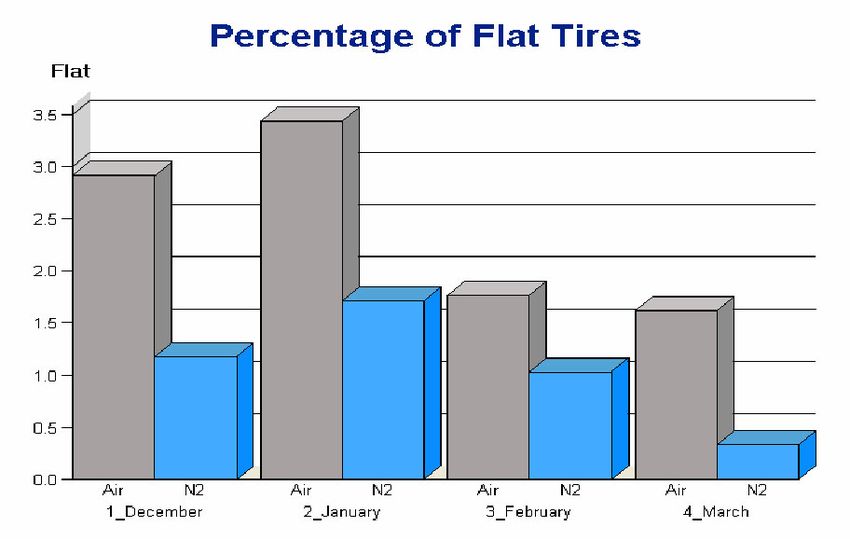
Nitrogen Tire Filling
      Field Data Analysis
NY City Transit, Flatbush Depot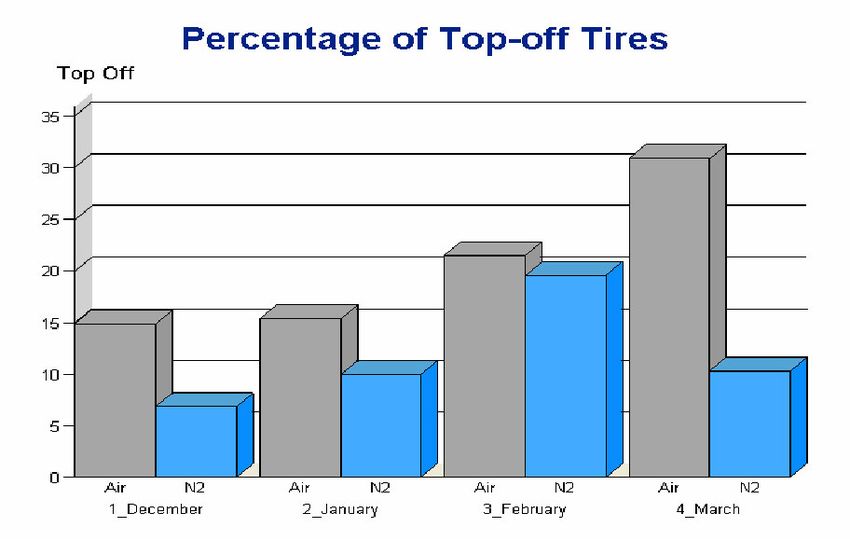
NYC Transit Bus Fleet
                  Base Data
A trial was conducted by NYC Transit, NY Power Authority to evaluate the
benefits of using Nitrogen in bus tires at NYCT’s Flatbush Avenue bus depot
in Brooklyn, NY in December 2007. This rigorously collected data formed the
basis for further conversion of other depots to nitrogen. Since then, 4 more
depots have been converted to Nitrogen.

Fleet Size                                                                          285
Miles/yr (per vehicle)                                                      ~25000
Fuel Cost ($)/gallon (corrected for current cost)                                   ~2
Tire Life (years)                                                                   ~3
Test Period (months)                                                                >3
Dates                                                         Dec ‘07 – Mar ‘08
Average Miles/gallon                                                                2.5

 Analysis done in this report is based only on field data collected in the trial.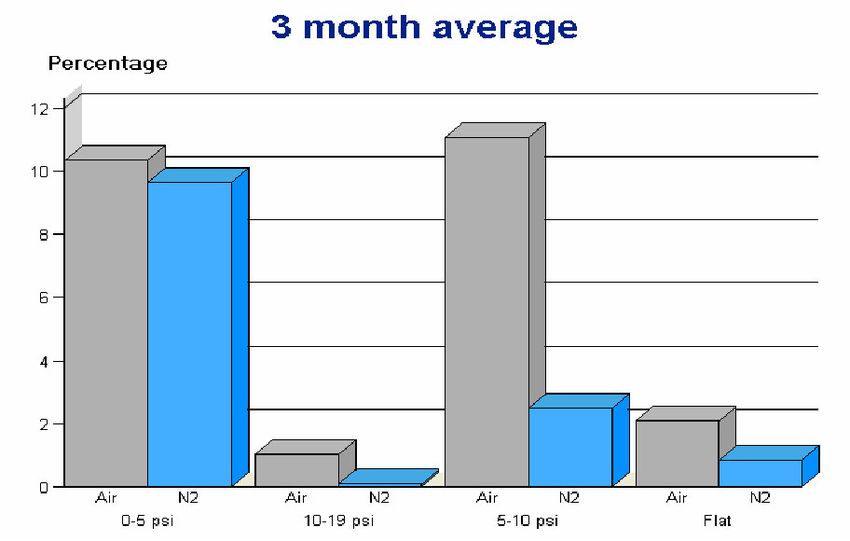
Tires Requiring Top‐off in 30 days

    Air Filled Tires
    Nitrogen Filled Tires
Number of Flat Tires Every Month
Air Filled Tires
Nitrogen Filled TiresPressure Loss Data
Air Filled Tires
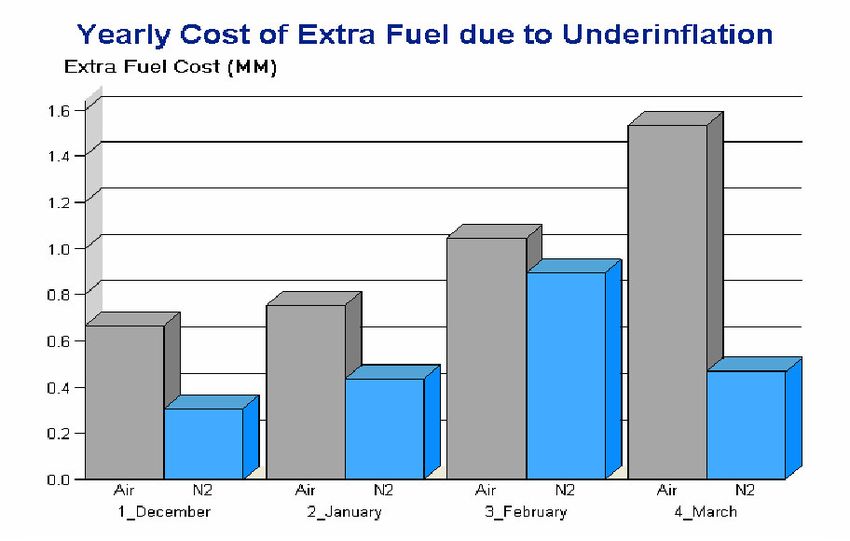
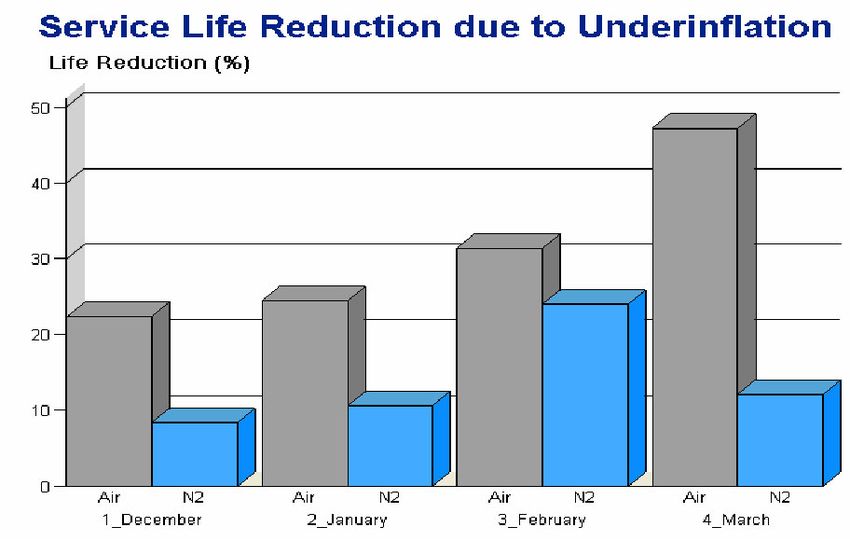
Nitrogen Filled TiresImpact of Under‐Inflation
Data from various Tire Companies
Extra Fuel Consumption (%)
Under Inflation (%) Michelin Continental Goodyear
5 0.75 1 2
10 1 2.5 4
20 2.25 7.5 12
Shortening of Tire Life (%)
Under Inflation (%) Michelin Continental
5 1 2
10 2 5
20 20 28
Most Conservative estimates from Michelin are used for cost savingsFuel Consumption Impact
Based on Michelin Data
Air Filled Tires
Nitrogen Filled TiresFuel Cost Impact Air Filled Tires Nitrogen Filled Tires
Tire Life Impact

Air Filled Tires
Nitrogen Filled Tires
Conclusions
Nitrogen tire filling showed clear & demonstrated benefits over
air filled tires as listed below:

1.Tires retained correct pressure for longer time
   •   Less tire top offs would result in lower labor cost
   •   Lower number of flat tires (by ~3/month) would help reduce
       expensive downtime and tire cost
2.Tire rolling resistance was reduced
   •   Lowered fuel consumption is projected to be $0.5 MM/year
       based on Michelin’s conservative basis
3.Tire friction and tire wear was reduced
   •   Tire life improvement is extrapolated to be about 20% based on
       the most conservative data
ExxonMobil PROPRIETARY
NITROGEN INFLATION OF TIRES
presented to
National Highway Traffic Safety Administration
Washington, DC
Walter H. Waddell
Butyl Product Technology
August, 2006
2006PYBXA 12Agenda
• Introduction
• Filling Gas Studies
– New Tires
– Oven-Aged Tires
• Summary
2Introduction: Gas Permeability
• Nitrogen inflation utilized for tires used in severe service conditions
– NASA, race cars, truck fleets, military applications, agricultural machinery
– FAA requires nitrogen inflation of tires on braked wheels of all aircraft over
75,000 lbs takeoff weight
• Nitrogen (0.10975 nm) is smaller molecule than Oxygen (0.1208 nm),
but is 50% less soluble in Natural Rubber than is Oxygen gas
(ref: van Amerongen, Rubber Reviews 37, 1065 (1964))
• Nitrogen is less permeable in rubber than is Oxygen gas
– Natural Rubber @25oC N2 = 6.12 O2 = 17.7 (10-8cm2.sec-1.atm-1)
• For Natural Rubber QAir ~ 1.4 QNitrogen Î 70% of Air
– Butyl Rubber @25oC N2 = 0.247 O2 = 0.99
• For Butyl Rubber QAir ~ 1.63 QNitrogen Î 60% of Air
Nitrogen Less Permeable and Less Soluble than Oxygen
3Agenda
• Introduction
• Filling Gas Studies
– New Tires
• Inflation Pressure Retention
• Roadwheel Durability
• FMVSS 139 Testing
– Oven-Aged Tires
• Summary
4Production of Experimental Tires
• Compounds prepared in 2-step factory mix
– GK400 sheeted out on extruder with roller die
– GK160 sheeted out on two-roll mill
• Experimental summer tires made on full
automatic building machines
– P205/60 SR15 (no nylon cap ply)
– Cured innerliner gauges of 1.0 mm
Ingredient 1 2 3
ExxonTM Bromobutyl 2222 100 80 60
Natural Rubber, SMR 20 20 40
Processing Aid, 40MS 7 7 7
Carbon Black, N660 60 60 60
Processing Aid, SP1068 4 4 4
Processing Oil, TDAE 8 8 8
Stearic Acid 1 1 1
Zinc Oxide 1 1 1
Sulfur 0.5 0.5 0.5
Accelerator, MBTS 1.25 1.25 1.25
ExxonMobil Chemical Company Data 5Filling Gas Effects: Tire IPR
Walenga (Bridgestone/Firestone) reported on 11R22.5 truck tires
(ref: Guy Walenga, Clemson Tire Conference, Mar 11, 2004)
• Air-inflated tires lost 2.7%/month; dry nitrogen inflated tires lost 0.7%/month
• ‘Nitrogen Inflation does reduce the oxidation degradation of rubber
components in Truck Tires’
Used ASTM F-1112-00 to study IPR of P205/60 SR15 tires with
different innerliners
Inflation Pressure Retention of CIIR / NR (80/20)
Inflation Pressure Retention of 100-phr BIIR
2 2 1.84
1.45 1.5
1.5
1.01
IPR
1
IPR
1 0.79
0.5
0.5
0
0 Air Nitrogen
Air Nitrogen
Filling Gas
Filling Gas
IPR Loss Rates Reduced 45% using Nitrogen Inflation
ExxonMobil Chemical Company Data 6Filling Gas Effects: Roadwheel Durability
Tokita et. al. (Uniroyal) studied passenger tires with different liners
and different oxygen contents by testing on a lab test wheel
(ref: N. Tokita, W. D. Sigworth, G. H. Nybakken, G. B. Ouyang, International Rubber Conference, Kyoto, Oct 15-18, 1985)
• Air-inflated tires failed at 215 and 240 hours, nitrogen-inflated tires did
not fail at 600 hours
• ‘Liner permeability and its gauge are the most influential for BES’
Studied Tread Separation of P205/60 SR15 tires with different liners
1000
Nitrogen Inflation
900 2
R = 0.9764 Air Inflation Durability: Tread Separation
800
50/50 N2/O2 R 2 = 0.9927
900 806.5
700 2
R = 0.9905
800
Hours to Failure
700 612.9
Hours to Failure
600
600
469.5
500 500
2
R = 0.6961 400
400
300
300 200
200
100
0
100 1 21 50
0 %-Oxygen in Fill Gas
100 BIIR 80/20 BIIR/NR 60/40 BIIR/NR
Innerliner
New Tire Results Improved by Reducing Oxygen
ExxonMobil Chemical Company Data 7New Tire Performance: FMVSS 139
205/60 SR15 tires made with different innerliner compositions tested
according to three FMVSS 139 test standards, then until tire failure
FMVSS 139
High Speed Endurance Low Inflation
120 90 minutes
97.0 100.7
100 90.1
Hours to Failure
86.4 84.5 34 hours
80 +90 minutes
57.2
60
40 24.2 26.7
18.1
20
0
100 80/20 60/40
BIIR / NR
All New Tires Pass Tests, and Performance is Comparable
ExxonMobil Chemical Company Data 8Filling Gas Effects: FMVSS 139 Endurance
FMVSS 139 Endurance test modified by
• running until tire failure
• using dry, 99.9% Nitrogen as the fill gas
FMVSS 139 Endurance to Failure FMVSS 139 Endurance to Failure
Air Inflation Nitrogen Inflation of CIIR / NR (80/20)
140
140
118.6
117.0 120 110.8
120
Hours to Failure
97.0 100.7 101.9
90.8 90.1 100
Hours to Failure
100
80 80
60 60
40 40
20 20
0 0
100 BIIR 80/20 BIIR/NR 60/40 BIIR/NR Air Nitrogen
Filling Gas
Performance of New Tires Comparable
ExxonMobil Chemical Company Data 9New Tire Performance: FMVSS 139E / SUL
FMVSS 139 Endurance test modified by following-up with a
Stepped-Up Load test until failure
• Temperature: 38oC
• Speed: 120 km/h (75 mph), Pressure: 180 kPa (26 psi) air
• Load: 4 hr @85% / 6 hr @90% / 24 hr @100% of rating
• Stepped-Up Load: 10% @ 4-hour intervals until tire failure
FMVSS 139 Endurance, Step-Up Load
60
49.5 48.1
50 46.1
Hours to Failure
40
30
20
10
0
1.45 2.00 2.65
Inflation Pressure Retention
Performance of New Tires Comparable
ExxonMobil Chemical Company Data 10Agenda
• Introduction
• Filling Gas Studies
– New Tires
– Oven-Aged Tires
• FMVSS 139 Endurance / SUL Testing
• Shearography
• Summary
11Oven Aging Studies
P205/60 SR15 tires aged in air-circulating oven for 4 weeks @ 70oC
• 100-phr Bromobutyl rubber, and 80/20 and 60/40 BIIR / NR innerliners
• Tires inflated with dry nitrogen (99.9%) or dry air
Oven-aged tires were then tested on a 1.7-m laboratory road wheel
at the Bangalore Research & Development Technology Center
according to the new FMVSS 139 standards
• FMVSS 139 Endurance / Stepped-Up Load to failure completed
New and oven-aged / road wheel tested tires analyzed by Akron
Rubber Development Laboratory
• 100% Modulus, Elongation at break, Peel Strength, Crosslink Density
• Shearography
ExxonMobil Chemical Company Data 12Filling Gas Effects: FMVSS 139 Endurance/ SUL
FMVSS 139 Endurance / SUL
New Oven Aged, N2 Inflation Oven Aged, Air Inflation
60
49.5 48.1
50 46.1 47.3 44.0 44.5 42.7 43.6
Hours to Failure
38.6
40
30
20
10
0
100/0 80/20 60/40
BIIR / NR
Endurance of Aged Tires Improved using Nitrogen Inflation
ExxonMobil Chemical Company Data 13Filling Gas Effects: FMVSS 139 Endurance/ SUL
FMVSS 139 Endurance, SUL
Air Inflated, Oven Aged N2 Inflated, Oven Aged
47.3 R2 = 0.9272 R2 = 0.9422
50 44.0 44.5 43.6
42.7
38.6
Hours to Failure
40
30
20
10
0
100/0 80/20 60/40
BIIR / NR
Roadwheel Results Improved by Reducing Oxygen
Benefits Largest for Highest IPR Innerliner
ExxonMobil Chemical Company Data 14Tire IPR Effects: FMVSS 139 Endurance/ SUL
FMVSS 139 Endurance, Step-Up Load
R2 = 0.9376
50.0 47.3
44.5 43.8
45.0 42.7
38.6
40.0
Hours to Failure
35.0
30.0
25.0
20.0
15.0
10.0
5.0
0.0
0.79 1.10 1.45 2.00 2.65
Inflation Pressure Retention
Red = Nitrogen Purple = 1 Nitrogen and 1 Air-filled Tire Blue = Air
Lab Roadwheel Endurance Quantitatively Correlates to
Tire Inflation Pressure Retention
ExxonMobil Chemical Company Data 15Filling Gas Effects: Shearography
Shearography
Air Inflated Nitrogen Inflated
30000
25,344
25000
Cracks, mm2
20000
15000 12,729
10000
5000
642 0 0 500
0
100 BIIR 80/20 BIIR/NR 60/40 BIIR/NR
Cracking of Aged Tires Significantly
Reduced by Reducing Oxygen
ExxonMobil Chemical Company Data 16Tire IPR Effects: Shearography
Shearography Crack Area
2
R = 0.9862
30000
25344
25000
20000
mm2
15000 12729
10000
5000
0 0 571
0
0.79 1.10 1.45 2.00 2.65
Inflation Pressure Retention
Shearography Cracking Quantitatively Correlates to
Tire Inflation Pressure Retention
ExxonMobil Chemical Company Data 17Agenda
• Introduction
• Filling Gas Studies
– New Tires
– Oven-Aged Tires
• Summary
18Summary
• Nitrogen gas permeates slower than Oxygen through rubber
– Tire IPR is reduced 45% using dry, 99.9%-nitrogen inflation
• Laboratory roadwheel durability of new tires increased
quantitatively with decreasing %-Oxygen in the filling gas
• FMVSS 139 Endurance testing of new tires is insensitive to %-
Oxygen in the filling gas
• FMVSS 139 Endurance/Stepped-Up Load testing of new tires is
insensitive to Tire IPR
• FMVSS 139 Endurance/SUL testing of oven-aged tires can be
quantitatively correlated to Tire Inflation Pressure Retention
• Shearography cracking of oven-aged tires reduced using
Nitrogen as fill gas
• Shearography cracking of oven-aged tires can be quantitatively
correlated to Tire Inflation Pressure Retention
ExxonMobil Chemical Company Data 19Summary
• All passenger tires that were tested in our laboratory under
carefully controlled conditions were aged either in an oven
and/or on a roadwheel.
• We have quantitatively shown that use of materials that
afford the lowest IPR loss values per month retard this
aging process.
• Use of dry, 99.9% Nitrogen to inflate tires can also be
beneficial under these idealized laboratory conditions.
• Use of materials that afford the lowest IPR loss values per
month with dry, 99.9% Nitrogen inflation further retard this
laboratory aging process.
• Results that could potentially be obtained by the average
consumer have not been studied.
ExxonMobil Chemical Company Data 20Nitrogen Inflation of Tires
Disclaimer
©2006 ExxonMobil Corporation. To the extent the user is entitled to disclose and distribute this document, the user may
forward, distribute, and/or photocopy this copyrighted document only if unaltered and complete, including all of its headers,
footers, disclaimers, and other information. You may not copy this document to a Web site. The information in this document
relates only to the named product or materials when not in combination with any other product or materials. We based the
information on data believed to be reliable on the date compiled, but we do not represent, warrant, or otherwise guarantee,
expressly or impliedly, the merchantability, fitness for a particular purpose, suitability, accuracy, reliability, or completeness of
this information or the products, materials, or processes described. The user is solely responsible for all determinations
regarding any use of material or product and any process in its territories of interest. We expressly disclaim liability for any
loss, damage, or injury directly or indirectly suffered or incurred as a result of or related to anyone using or relying on any of the
information in this document. There is no endorsement of any product or process, and we expressly disclaim any contrary
implication. The terms, “we”, “our”, "ExxonMobil Chemical", or "ExxonMobil" are used for convenience, and may include any
one or more of ExxonMobil Chemical Company, Exxon Mobil Corporation, or any affiliates they directly or indirectly steward.
21You can also read