A 6 YEAR LONGITUDINAL STUDY OF GAMBLING & PROBLEM GAMBLING IN MASSACHUSETTS - ROBERT J. WILLIAMS, PHD
←
→
Page content transcription
If your browser does not render page correctly, please read the page content below
A 6 YEAR LONGITUDINAL STUDY OF
  GAMBLING & PROBLEM GAMBLING
         IN MASSACHUSETTS

March 2021    Robert J. Williams, PhD
RESEARCH TEAM
Dr. Rachel Volberg
Research Professor, Public Health & Health Sciences; UMass Amherst
Dr. Robert Williams
Professor, Health Sciences; University of Lethbridge, Alberta, Canada
Martha Zorn
Data Manager, Public Health & Health Sciences; UMass Amherst
Dr. Ed Stanek
Professor Emeritus, Public Health & Health Sciences; UMass Amherst
Valerie Evans
Biostatistician & SEIGMA/MAGIC Project Manager, UMass AmherstMAGIC
Massachusetts Gambling Impact Cohort
(MAGIC) is the first major cohort study of
gambling in the United States
Began in 2013Research Goals 1. Monitor changes in level of gambling and problem gambling over time within the cohort that might identify impacts of MA-casino introduction. 2. Determine stability and course of problem, at-risk, and recreational gambling. 3. Identify predictors of problem gambling onset, continuation, remission, and relapse for the purposes of developing an etiological model of problem gambling. 4. Operationalize above findings to optimize treatment and prevention of problem gambling in MA.
Details of Each Wave
Wave 95% Assessment Window Complete Response/Retention
1 Sep 2013 – Apr 2014 3,096 36.6% response
2 Mar – Jun 2015 3,139 65.1% response
Jun 24, 2015: Opening of Plainridge Park Casino (PPC)
3 Apr – Jul 2016 2,450 78.1% retention
4 Postponed due to budgetary constraints
4 Apr – Jun 2018 2,444 81.1% retention
Aug 24, 2018: Opening of MGM Springfield (MGM)
5 Mar – Jun 2019 2,382 79.7% retention
Jun 23, 2019: Opening of Encore Boston Harbor (EBH)
Wave 1 over-selected for at-risk characteristics: all problem gamblers, at-risk gamblers,
weekly gamblers, >$1200 past year gambling expenditure, military service.
Limited number of variables assessed in Wave 1 and 2; comprehensive set included in Waves
3 – 5.CHANGES IN LEVEL OF GAMBLING AND PROBLEM GAMBLING WITHIN THE COHORT THAT MIGHT IDENTIFY IMPACTS OF MA-CASINO INTRODUCTION
Gambling Participation within the
                    Cohort Across Waves
                                PPC                             MGM            EBH
80%                                                                                    • Wave 3 → 5
                                                                                         decrease in out-of-
70%
                                                                                         state casinos and
60%                                                                                      increase in MA
                                                                                         casinos due to MA-
50%                                                                                      casino introduction.
40%
           33.4%             33.0%                                                     • No negative impact
30%                                                                                      on lottery
                                             22.6%
                                                       19.7%
                                                                      15.7%
                                                                                         participation.
20%
                                                                          16.3%
10%                                     6.8%           7.1%                            • Wave 3 increase in
                                                                                         daily lottery, online
0%                                                                                       gambling likely
       WAVE 1         WAVE 2           WAVE 3          WAVE 4         WAVE 5             artifactual due to
      (2013/14)       (2015)           (2016)          (2018)         (2019)
                                                                                         change in question
       Traditional Lottery           instant Tickets            Raffles                  wording.
       Daily Lottery                 Bingo                      Out-of-State Casinos
       Horse Racing                  Sports Betting             MA Casinos
       Online Gambling
Gambling Categorizations within
the Cohort Across Waves
PPC MGM EBH
80% • Wave 3 increase in
70%
Recreational
72.5% 73.1%
70.5%
68.2%
70.2% Gambling likely
60% due to 2016
Powerball jackpot.
50%
40% • Wave 4 & 5
increase in Problem
30%
Gambling
20% 14.5% 15.2% 13.7%
potentially related
12.7% 12.5%
to casino
10% 12.6% 13.5% 11.7% 10.6%
2.5% 3.1% 3.1% 3.8% 12.4% introduction, but
3.7%
0% perhaps not their
WAVE 1 WAVE 2 WAVE 3 WAVE 4 WAVE 5 physical
(2013/14) (2015) (2016) (2018) (2019)
availability.
Non-Gambler Recreational Gambler
Problem Gambler At-Risk GamblerINDIVIDUAL STABILITY OF NON-
GAMBLING, RECREATIONAL GAMBLING,
AT-RISK GAMBLING AND PROBLEM
GAMBLING ACROSS WAVES• N = 322; each row
represents an individual
• NON-GAMBLING a fairly
stable category, with
majority in one wave
continuing to be Non-
Gamblers at the next wave.
• However, only minority Non-
Gamblers in all 5 waves.
Majority transitioned to
Recreational Gambling in
Wave 2, 3, 4, or 5 with
minority transitioning back
to Non-Gambling in
following wave.
Non-Gambler Recreational Gambler At-Risk Gambler Problem GamblerWave 1 Wave 2 Wave 3 Wave 4 Wave 5
• N = 1472; each row
represents 50 individuals
• RECREATIONAL
GAMBLING a very stable
category, with large
majority continuing to be
Recreational Gamblers in
the next wave, and most
being Recreational
Gamblers in all five
waves.
• Small percentage
transitioned into Non-
Gambling or At-Risk
Gambling and an even
smaller percentage (3.9%)
became Problem
Gamblers.
Non-Gambler Recreational Gambler At-Risk Gambler Problem Gambler• N = 262; each row
represents an individual
• AT-RISK GAMBLING an
unstable category, with
minority being in same
category in the next wave
and only small minority
continuing in this category
for four consecutive waves.
• Although a significant
percentage of At-Risk
Gamblers subsequently
become Problem Gamblers
(19.8%), a much more
common route was
transitioning back to
Recreational Gambling.
Non-Gambler Recreational Gambler At-Risk Gambler Problem Gambler• N = 168; each row represents an
individual
• PROBLEM GAMBLING somewhat
more stable than At-Risk
Gambling, but still fairly unstable,
with majority transitioning to At-
Risk or Recreational Gambling in
next wave.
• One year the modal duration of
PG, occurring in 53.0%, with only
6% being PGs in all 5 waves. Risk
of chronicity increased with each
consecutive year of PG status.
• At-Risk Gambling preceded PG
69% of the time.
• High remission and relapse rates.
• Increase in PG in Wave 4 due to
increasing relapse rates (77% of
PGs in Wave 5 were relapsed
PGs). This increase occurred prior
to MGM & Encore opening.
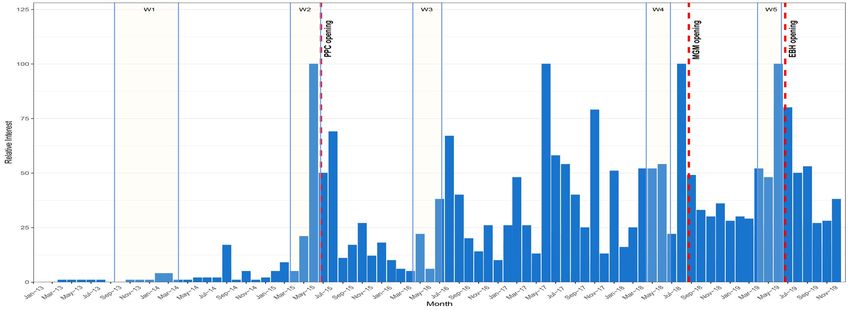
Non-Gambler Recreational Gambler At-Risk Gambler Problem GamblerNews Stories and Google Searches for
PPC, MGM, WBH/EBH from 2013-2019
News
Stories
Google
SearchesBIVARIATE & MULTIVARIATE PREDICTORS
OF CONCURRENT AND FUTURE
PROBLEM GAMBLINGMethod
Discrete and Continuous Dependent Variable (DV)
PPGM Problem Gambler Status (discrete)
PPGM Total Score (continuous)
105 Independent Variables (IV)
Everything significantly related to problem gambling in prior research
Concurrent and Lagged Analysis
IVs predicting DV in same wave and in the next wave
Generalized Estimating Equations
Bivariate relationship between each IV and DV over time
Collective multivariate analysis of all significant IVs with the DV over timeBivariate Results
16 variables with no significant concurrent or future relationship with PG:
Number of children under 18 in the household
Importance of religion
3 Attitudes toward gambling (perceived benefit or harm; types that should be legal; whether gambling
too widely available in MA)
Alcohol use in past 30 days
Main reason for gambling: makes me feel good about myself
Awareness of PG prevention programs at work, school, or in community
Age
Marital status
Born in the United States
Distance from home to closest electronic gambling machine (EGM) or table game venue
Level of stress in the past 12 months
Physical, sexual or emotional abuse as a child
Employment status
Having served in the military
Italicized variables are ones that have been significant in other research; bolded variables are ones
significant (p < .01) in the MA Baseline General Population Survey in 2013/2014Bivariate Results
67 variables with significant concurrent and lagged
bivariate relationship with problem gambling
Additional 22 variables with significant concurrent or
lagged bivariate relationship with problem gamblingBivariate Results
Strongest IVs with both a concurrent and future
relationship with problem gambling were gambling-
related variables:
Biggest loss in single day
Biggest win in single day
Intensity of gambling involvement (#formats; frequency; $)
Importance of gambling as recreational activity
Current gambling category (non-gambler, recreational
gambler, at-risk gambler, problem gambler)Bivariate Results
Many other strong variables robustly predictive both
concurrently and prospectively:
Instant lottery participation
Traditional lottery participation
Daily lottery participation
Higher psychopathy/antisociality
Family member been a regular gambler
Current substance use disorder (DSM-5)
Lifetime history of drug or alcohol problems
Lifetime history of behavioral addiction
Greater portion of friends and family that are regular gamblers
Higher impulsivityBivariate Results
Many other strong variables robustly predictive both
concurrently and prospectively:
Higher level of gambling fallacies
Higher number of significant life events in past 12 months
Younger age when first gambled for money
Higher number of financial/property events in past 12 months
Casino participation
Race/ethnicity (Black, Hispanic)
Lower educational attainment
Lower self-rated happiness
Higher excitement seeking
Lower agreeablenessBivariate Results
Many other strong variables robustly predictive both
concurrently and prospectively:
Lower household income
Higher rating for ‘wealth a good measure of success in life’
Any past year DSM-5 mental disorder
Sports betting participation
Having a criminal record
Higher number of health life events in past 12 months
Tobacco user past 30 days
Higher levels of neuroticism
Higher number of friends/family life events in past 12 months
Higher levels of vulnerabilityBivariate Results
Many other strong variables robustly predictive both
concurrently and prospectively:
Poorer general health in past 12 months
Poorer rating of current marital relationship
Typically gamble alone rather than with friends
Higher current debt
Parents not responsibly modelling gambling or providing education
Online gambling participation
Electronic gambling machine participation
Significant family history of addiction or mental health problems
Lifetime history of mental health problems
‘Private gambling’ participationBivariate Results
Many other strong variables robustly predictive both
concurrently and prospectively:
‘Other types’ of gambling participation
Major Depression (DSM-5)
Bingo participation
Main reason for gambling to socialize or to support worthy causes (-ve)
Horse race betting
Lower conscientiousness
Non-medical use of drugs in past 12 months
Male gender
Committed illegal activities in past year
Generalized Anxiety Disorder (DSM-5)Multivariate Results
IVs often correlated with one another (e.g., educational
attainment with income with race/ethnicity).
Consequently, bivariate relationships with the DV do not identify
whether there may be specific attribute(s) underlying a range of
bivariate associations.
Relative importance of IVs better established in stepwise
multivariate analysis where IVs having strongest association with
DV enter the model first, and other IVs only enter model if they
add additional predictive power beyond their shared variance.Multivariate Results
Strongest IVs with both a concurrent and future
relationship with problem gambling were again
gambling-related variables:
Biggest loss in single day
Biggest win in single day
Intensity of gambling involvement (#formats; frequency; $)
Importance of gambling as recreational activity
Current gambling category (non-gambler, recreational
gambler, at-risk gambler, problem gambler)Multivariate Results
12 other strong variables robustly predictive both
concurrently and prospectively:
Higher impulsivity
Daily lottery game participation (past 12 months)
Instant lottery participation (past 12 months)
Higher # of significant property/financial life events (past
12 months)
Lower levels of happiness (past 12 months)
Lower household incomeMultivariate Results
12 other strong variables robustly predictive both
concurrently and prospectively:
Male gender
Traditional lottery participation (past 12 months)
Problems with drugs or alcohol prior to past 12 months
Higher levels of antisociality/psychopathy
Sports betting participation (past 12 months)
Higher levels of gambling fallaciesPredictors of Problem Gambling
(PG) Remission
Bivariate and multivariate analyses conducted on PGs
who remitted vs. continued being PGs in the next wave.
Variables that best predicted remission were:
No prior lifetime problems with gambling
Less severe current manifestations of PG (lower PG scores, lower
gambling expenditure)
Fewer comorbidities (less impulsivity, absence of behavioral
addictions, no illegal activity, no mental disorders, fewer life events)
Fewer gambling fallaciesSUPPLEMENTAL DESCRIPTIVE RESULTS
Supplemental Descriptive Results:
                      Prevention Awareness

                                                  Wave 1 Wave 2 Wave 3 Wave 4 Wave 5 Average
1. Seen/heard media campaigns to prevent
   problem gambling in MA (past 12 months)?       49.2%   50.1%   43.9%   33.6%   34.3%   42.2%
   (% yes)
2. Aware of any prevention programs at
   school, work, in community or elsewhere?       15.1%   16.6%   18.0%   16.5%   17.1%   16.7%
   (past 12 months) (% yes)
If yes to   Did you participate in any of these
                                                   1.7%   1.2%    1.9%    1.5%    2.5%    1.8%
    2           prevention programs? (% yes)
                Did these media campaigns or
If yes to
                programs alter your gambling       1.2%   0.8%    1.1%    1.1%    1.2%    1.1%
  1 or 2
                           behaviors? (% yes)
Supplemental Descriptive Results:
Problematic Types of Gambling for PGs
Wave 1 Wave 2 Wave 3 Wave 4 Wave 5 Average
Are there particular types of gambling
that have contributed to your problems 23.3% 36.5% 53.2% 44.8% 47.5% 41.1%
more than others? (% yes)
Instant Lottery Tickets 23.5% 28.6% 66.7% 66.7% 67.9% 50.7%
Slot Machines or VLTs -- 28.6% 27.3% 23.3% 21.4% 23.6%
Traditional Lottery Tickets -- -- 24.2% 36.7% 28.6% 23.1%
Daily Lotteries -- -- 18.2% 20.0% -- 16.2%
If yes, Casino Table Games -- -- -- -- 21.5% 13.3%
which
ones? Sports Betting -- -- -- 20.0% -- 11.2%
Bingo -- 0% -- -- -- 7.6%
Horse or Dog Race Betting 0% -- -- 0% 0% --
High Risk Stocks 0% 0% -- 0% -- --
Online Gambling -- 0% -- 0% 0% --Supplemental Descriptive Results:
Help Seeking among PGs
Wave 1 Wave 2 Wave 3 Wave 4 Wave 5 Average
Have you wanted help for gambling
-- 7.9% 11.3% -- -- 7.8%
problems in the past 12 months? (% yes)
Have you sought help for
If yes: gambling problems in past 12 -- -- -- -- -- 36.1%
months? (% yes)
Have you excluded yourself from a casino
12.3% 21.1% 19.4% 19.4% 17.5% 17.9%
or slots parlor in past 12 months? (% yes)Supplemental Descriptive Results:
Self-Reported Causes of PG
Wave 3 Wave 4 Wave 5 TOTAL %
Desire to Win Money 18 18 19 55 30.2%
Boredom/Enjoyment/Excitement 14 13 12 39 21.4%
Denial of Problem 5 7 5 17 9.3%
Stress/Depression/Escape 6 2 6 14 7.7%
Addiction/Poor Self-Control 5 2 6 13 7.1%
Chasing Losses 3 3 1 7 3.8%
Availability of Gambling 3 1 2 6 3.3%
Losing 4 0 2 6 3.3%
Social Pressure 1 2 1 4 2.2%
Don’t Know 0 2 1 3 1.6%
Other 5 7 6 18 9.9%
TOTAL 64 57 61 182 100%POLICY IMPLICATIONS
Policy Recommendations

1. These results largely confirm previous research. Consequently,
   they provide a more solid scientific footing for prior
   recommendations about how to best prevent problem
   gambling (e.g., Williams, West & Simpson, 2012).

2. There is no ‘silver bullet’ to prevent problem gambling. Rather,
   a wide array of educational and policy initiatives is needed to
   address the multi-faceted biopsychosocial etiology.
Policy Recommendations
3. Because of their etiological connection, effective treatment of
substance abuse and/or mood disorders will also help reduce
the future incidence of problem gambling.
For similar reasons, would be useful to screen for gambling problems
for people presenting for mental health or substance use problems.
4. Limit the placement of gambling opportunities and the
marketing of gambling in lower socioeconomic neighborhoods.Policy Recommendations
5. Educational efforts are needed to promote knowledge,
motivations, and attitudes conducive to responsible gambling.
• Demographic Focus: all ages, race/ethnicities, and genders with extra focus
on males and lower income groups.
• Location Focus: media campaigns, school-based programs, mental health
and substance abuse clinics, gambling venues, on the gambling product.
• Content Focus:
o Countering gambling fallacies
o Risk factors for problem gambling identified in the present research
o Lower Risk Gambling Guidelines (LRGG)
o Symptoms of problem gambling and where to get helpPolicy Recommendations
6. Limit advertising as it potentially precipitates relapse and may
counteract educational messaging.
7. Increase availability of self-help materials, as only minority of
problem gamblers want or will ever seek out formal treatment.
8. Encourage treatment-seeking, as people who obtain formal
treatment have better long-term outcomes.
Strive for abstinence but have a low threshold for treatment access (i.e.,
‘reduced gambling’ or ‘harm reduction’ as an initial step)
Treating comorbid mental health problems and gambling fallacies essentialPolicy Recommendations
9. Implement policies recommended by other research:
• Restrict access to ATMs in gambling venues.
• Mandatory player pre-commitment on player reward cards.
• Automated alerts to players when gambling behavior escalates.
• Reward responsible gambling rather than just gambling consumption on
player reward cards.
• Restrict alcohol on the gaming floor.
• Limit the availability of gambling:
• Continued age 21 restrictions for casinos
• Continued prohibition of EGMs outside of dedicated gambling venues
• Limitations on online gamblingMAGIC Panel Discussion
You can also read